Abstract
Imaging of hip in osteoarthritis (OA) has seen considerable progress in the past decade, with the introduction of new techniques that may be more sensitive to structural disease changes. The purpose of this expert opinion, consensus driven recommendation is to provide detail on how to apply hip imaging in disease modifying clinical trials. It includes information on acquisition methods/ techniques (including guidance on positioning for radiography, sequence/protocol recommendations/ hardware for MRI); commonly encountered problems (including positioning, hardware and coil failures, artifacts associated with various MRI sequences); quality assurance/ control procedures; measurement methods; measurement performance (reliability, responsiveness, and validity); recommendations for trials; and research recommendations.
Keywords: hip osteoarthritis, imaging, clinical trial guidelines
Introduction
Recent use of imaging in the evaluation of progression of hip osteoarthritis (OA) has greatly increased. The previous guidelines for imaging of the hip in clinical trials published in 1995 included recommendations for imaging with a predominant focus on radiography (consistent with the era) with some detail in the appendices on methods of acquiring radiographs and use of magnetic resonance imaging (MRI)(1). There were little if any details on different imaging methods available, pitfalls inherent to each modality, or performance metrics of different imaging markers.
The purpose of this expert opinion, consensus driven recommendation is to provide details to researchers involved in disease modifying OA clinical trials on how one might use and apply this knowledge when using hip imaging assessments. It includes information on acquisition methods/ techniques (including guidance on positioning for radiography, sequence/protocol recommendations/ hardware for MRI); commonly encountered problems (including positioning, hardware and coil failures, artifacts associated with various MRI sequences); quality assurance/ control procedures; measurement methods; measurement performance (reliability, responsiveness, and validity); recommendations for trials; and research recommendations.
Methods
This review began with a search of Pubmed using terms of osteoarthritis, hip, and imaging. We also conducted general searches for manuscripts covering general RCT implementation methods, covering each of the sub-topics below; from this literature we identified key study frameworks, designs and methods, as well as other manuscripts of high relevance. Authors communicated via a series of teleconferences and email correspondence to identify additional topics and manuscripts for inclusion and to develop and reach concurrence on a set of recommended principles for inclusion of hip imaging methods in OA implementation trials. Authors of this review included multiple experts familiar with different approaches for imaging of the hip joint, including radiologists, rheumatologists, and engineers. Final recommendations (Tables 2 and 3) were obtained by averaging the responses to a survey among the 12 authors for the strength of recommendation from 0 to 100.
Table 2.
Average strength of recommendation from the 12 persons on the working group who responded to the survey. The response scale ranged from 0 (don't recommend) to 100 (strongly recommend).
| Radiography | Strength of recommendation (range 0–100)# |
|---|---|
| Radiographs of the hip should be done in supine position for comfort of The subject rather than weight-bearing | 53 |
| Scoring of hip OA on radiographs is best done with KL grades or the OARSI Atlas | 85 |
| Automated methods for assessing parameters of JSW offer promise of improved precision and therefore improved responsiveness. | 64 |
| Radiographic JSW is still a recommended option for trials of structure modification, with the understanding that the construct represents a number of pathologies and trial duration may be long. | 60 |
| MRI | |
| Using MRI it is possible to accurately and feasibly measure change in cartilage morphometry over 12–18 months for hip OA and we recommend the use of MRI for assessing cartilage morphometry in trials of OA structure modification. | 63 |
| Rather than try to assess hip cartilage morphometry with MRI, we are better off at the current time recommending semi-quantitative evaluation. | 61 |
| Structure modification should be considered in a broader context than that of cartilage alone. Since MRI has the capacity to image the other tissues, further work is needed on the quantification and predictive validity of non- cartilage MRI pathologies The performance metrics of non-cartilage MRI features have not been extensively studied but there is a rapidly emerging literature in this field. | 82 |
| MRI is now recommended for clinical trials in terms of semi-quantitative scoring. | 75 |
Table 3.
Average strength of recommendation from the 12 persons on the working group who responded to the survey. The response scale ranged from 0 (don't recommend) to 100 (strongly recommend).
| General comments | Strength of recommendation (range 0–100)# |
|---|---|
| Evaluation of age dependence of structural changes (cartilage thickness and others) due to mechanical stress in different age groups. | 74 |
| Conventional radiography | |
| For joint space width, measurement performance (reliability and responsiveness) dependency on projection technique, dependency on axial loading studies need to be done | 71 |
| For bony changes (osteophytes, erosions, cysts, attrition) dependency of reproducibility on projection technique needs study | 74 |
| MRI | |
| Comparison between quantitative cartilage volume/thickness with semi-quantitative scoring such as HOAMS and SHOMRI should be performed. | 74 |
| Further investigation should also be done for compositional MR methods such as T2 mapping and T1rho to find correlations between macro-and microstructure changes in the hip joint. | 71 |
| Further investigation should be done for MRI assessment of femoroacetabular impingement and its potential relationship to the onset of hip OA | 78 |
| A correlation with clinical scores, clinical importance of individual variables in the semi-quantitative scoring systems as well as with quantitative values of the compositional MR techniques should be performed. | 88 |
| Develop and appraise methods that will allow qualitative (semi- quantitative) measures to be quantitatively assessed as well as development of semi-automated to fully automated measures. | 78 |
| Improved detection, quantification and measurement performance of structural, compositional changes of hyaline and fibrocartilage using MRI. | 67 |
| Development of semi-quantitative and quantitative as well as fully automated evaluation of inflammatory changes of the synovium. | 80 |
| Clinical validation of MRI methods and techniques in general - What is their ability to predict real hip replacement? | 90 |
ACQUISITION METHODS AND TECHNIQUES
Radiography
Introduction
Radiography is commonly used to evaluate patients with hip OA. Radiography is widely available, inexpensive, and easy to obtain, and interpretation of the radiographs is relatively simple when compared to more sophisticated imaging modalities such as MRI that depict more tissues with more types of available contrast. Radiography can be used to measure radiographic joint space width (JSW) and thereby to indirectly assess cartilage thickness. In fact, joint space narrowing (JSN) on radiographs is the only outcome measure recommended by the United States Food and Drug Administration for use in OA clinical trials at present. However, the limitation of radiography is that it can only assess bone abnormalities such as osteophytes, subchondral cysts, sclerosis, cortical irregularity, fracture and deformity. Radiography cannot directly evaluate articular cartilage or assess other non-calcified joint structures including the labrum, synovium, ligaments, tendons or bone marrow lesions (BMLs, all of which can be sources of pain and possibly cause further damage to other structures in OA. Furthermore, since radiography is a projection technique, variability in positioning and superimposition of overlying structures can obscure joint abnormalities, and morphological distortion and magnification can complicate quantitative measurements.
General anatomical consideration
The orientation of the acetabulum relative to the AP x-ray beam and/or tomographic images does not follow one of the 3 orthogonal planes in space: In a standing position, both anterior superior iliac spines and the pubic symphysis are all located in a coronal/frontal plane (Figure 1). The vector normal to the “entrance” plane of the acetabulum, however, is oriented 24.3±4.7° toward anterior (in the axial/transverse plane) and 40.2±4.3° towards inferior (in the coronal/frontal plane) (2). The articular cartilage surface does not cover the entire acetabulum, but assumes the form of a horseshoe (the lunate surface), excluding the acetabular fossa (3). Different parts of the lunate surface are commonly addressed as the acetabular roof (top), anterior horn, and posterior horn. The mean cartilage thickness of the lunate surface is 1.3 mm in the acetabulum, and 1.4 mm in the femoral head (3). The maximum cartilage thickness in the acetabulum was reported to be located ventrally in the acetabular roof, at the outer rim of the lunate surface.
Figure 1.
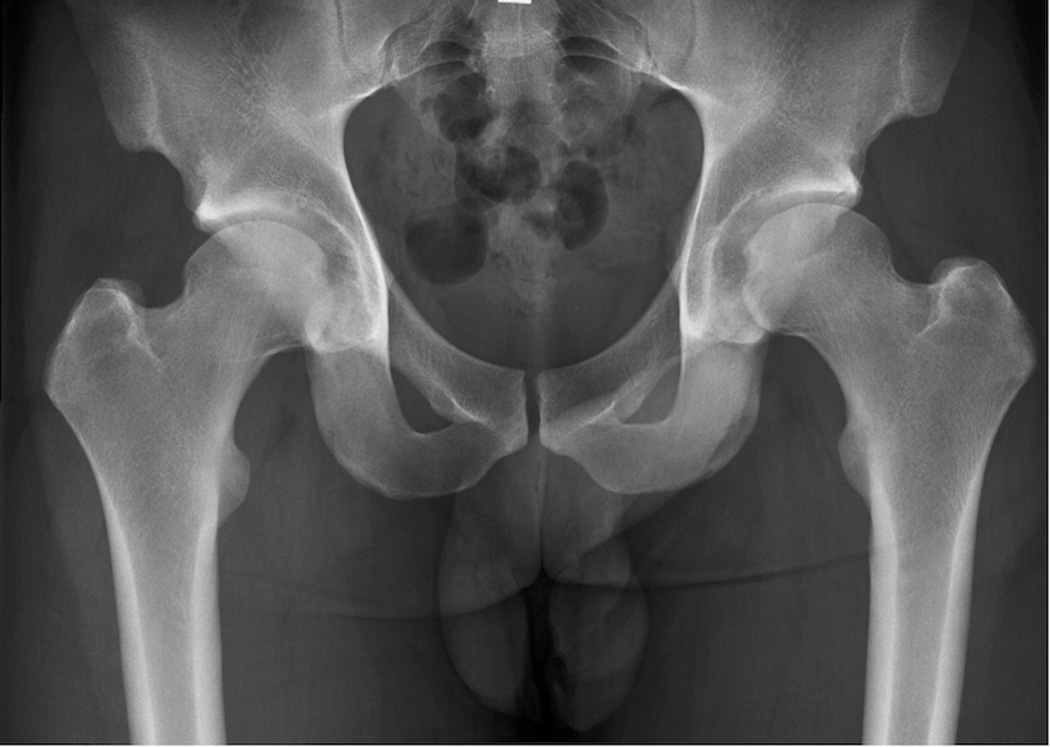
AP supine radiograph of the pelvis. Focus to film distance was approximately 100 cm, and digital detector was used.
The inferior outlet of the acetabular fossa, i.e. the incisura acetabuli, displays a 20.0±6.0° ventral deviation from inferior in the sagittal plane (2), and is bridged by the transverse acetabular ligament (TAL). Ventrally, the fibers of the TAL insert close to the labrum a fibrocartilage that entirely surrounds the acetabulum, whereas dorsally, the TAL inserts at the bone below the posterior horn, where it is continuous with the periosteum and the joint capsule (4).
Radiography: positioning, and image acquisition orientations
A hip radiographic study commonly consists of an anteroposterior (AP) and either a cross table or externally rotated frog-leg lateral view. The hip should be internally rotated for the AP radiograph. For the lateral projection, the patient’s hip should be flexed and externally rotated with the X-ray beam directed antero-posteriorly. Bone landmarks are helpful to determine adequacy of the AP and lateral projections. On the AP radiograph the greater and lesser trochanter should be clearly defined and the greater trochanter should not overlap the femoral neck. The calcar femoris should be visible and there should be little overlap between the anterior and posterior margins of the femoral head-neck junction. The most common error is external rotation, but excessive internal rotation should also be avoided, as both can impact measurements of JSW. In the context of clinical trials a Lesquesne’s view (also called false profile) (5) might be helpful to assess the joint space width and capture early signs of OA. Lesquesne’s view is an oblique view of the edge of the acetabulum, to diagnose OA affecting the anterior part of the joint and to measure the anterior coverage of the femoral head. For this view the patient is standing with the affected hip on the cassette, the ipsilateral foot parallel to the cassette and the pelvis rotated 65° from the plane of the cassette. The beam should be centered on the femoral head perpendicular to the cassette.
It is vital that the specific techniques used to acquire and interpret radiographs are standardized when evaluating patients with hip OA in multicenter or comparative research studies. All AP radiographs should be obtained with digital detector systems and low dose exposure using a focus to film distance of approximately 100 cm (1). Radiographs may be acquired with the patient in a standing or supine position (Figure 2). While standing radiographs may theoretically provide more accurate estimation of cartilage thickness by exposing cartilage to the same loading and hydration conditions which occur during weight-bearing activity (6), accurate measurements of hip JSW can be obtained on both on standing and supine radiographs(7–9). Standing radiographs have been shown to provide more accurate assessment of JSW in patients with dysplasia of the hip (10). In obese patients, abdominal pannus may project over the hip joint in the standing position and limit penetration of the x-ray beam with the effect of reduced image quality (7). Longitudinal studies should not switch between views on different subjects or at different time points.
Figure 2.
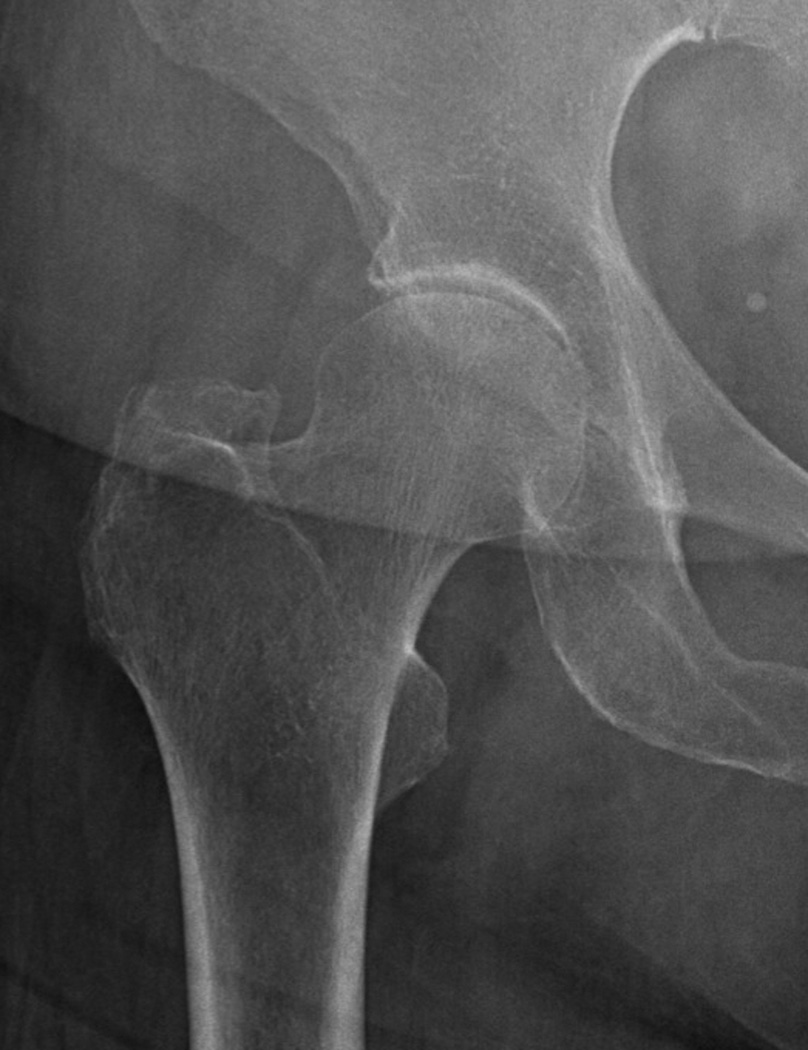
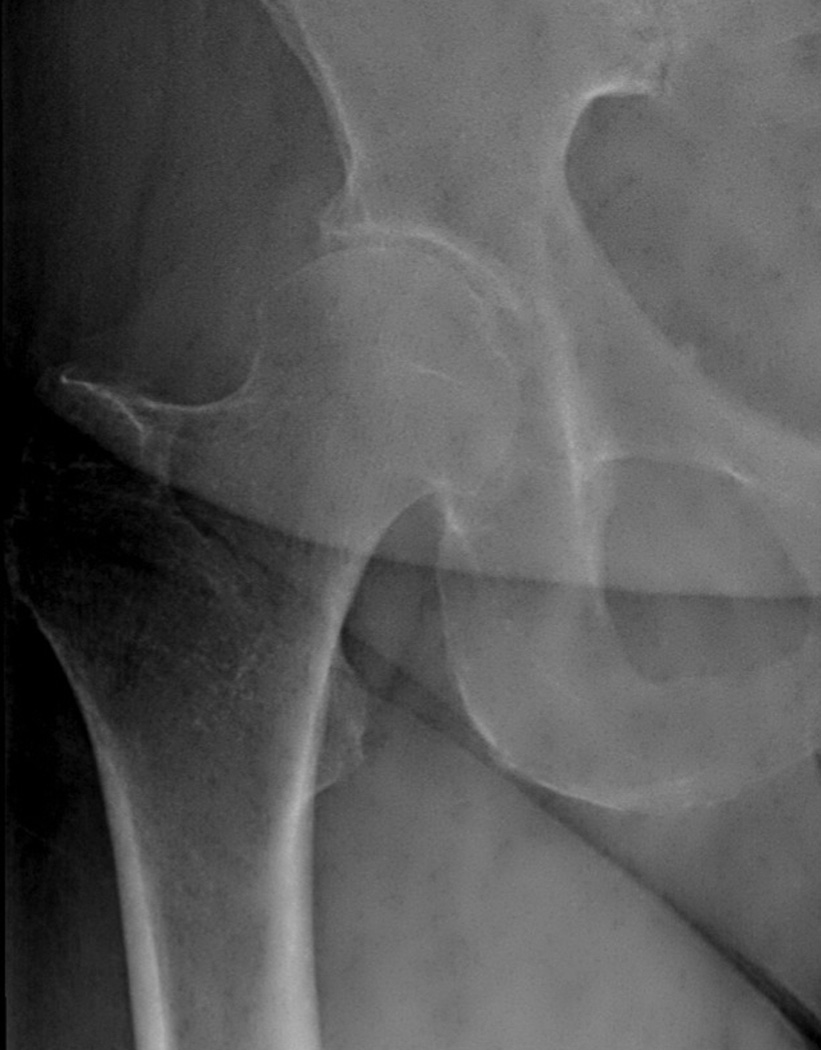
(a) Supine and (b) weight-bearing radiographs of the hip. Note the weight bearing view has overlying pannus that degrades image quality. Either image could be used to measure joint space width.
If the subject is standing, both feet should be internally rotated by 10 degrees (11). Foot maps aid reproducibility of positioning which is especially important in longitudinal studies. If the subject is supine, the X-ray beam should be perpendicular to the table and centered on the superior aspect of the symphysis pubis, and the feet should be internally rotated 15 to 20 degrees to generate force on the articular surface, obviating the need for standing weight-bearing acquisition (1). Auleley recommended use of a positioning device to ensure the femur was rotated at a standard 15 degrees of internal rotation (7). All other papers measuring hip JSW in a supine position acquired images without use of a positioning device and with the femur rotated between 5 degrees of external rotation and 15 degrees of internal rotation (12–15). A recent paper by Maheu, et al. concluded that front AP pelvic or front hip view of the target hip should be preferred (16).
Magnetic Resonance Imaging
Introduction
MRI assessment of the hip is challenging for several reasons:
The hip joint is deep within the body and it is not in the isocenter of the magnet.
The cartilage is very thin and differentiation between the acetabular and femoral cartilage layer is difficult(2).
Homogeneous fat suppression with larger field of view (FOV) is problematic below 3T.
The hip is a spherical joint and as a consequence partial volume effects are stronger than in the knee joint.
Surface coils need to be used which allow high signal and high resolution imaging, but there are no dedicated hip coils (17, 18).
Image Acquisition
Given the complex geometry of the hip joint, standardized MRI of the hip should be performed in multiple planes of imaging. For imaging of tissue morphology (thickness, volume, position), the best orientations are coronal, sagittal and oblique axial. Coronal and sagittal sequences allow good visualization of the cartilage and the labrum (18), while oblique axial sequences provide information on head-neck deformity, which is seen with CAM type femoroacetabular impingement (19). Axial or radial images can also be used for assessment of the femoral head-neck junction anatomy. For quantitative determination of the hip cartilage, sagittal images avoid the acetabular fossa which is mostly covered by synovial tissue (20). Radial acquisitions passing through the center of the femoral neck and the fovea allow for more direct tangential assessment of cartilage and labral integrity, reducing partial volume averaging and enhancing delineation between femoral and acetabular cartilage surfaces (21). However, radial imaging suffers from signal loss at the center due to saturation from different slices if acquired in 2D. Use of coronal, axial, and sagittal 3D sequences with near isotropic resolution has the potential to overcome limitations of radial acquisitions(22).
Accurate and reproducible assessment of the hip may be performed at either 1.5 or 3.0 Tesla (T) field strength (23). However, 3.0T imaging systems do provide better signal-to-noise ratio (SNR) that allows higher resolution images to be acquired in the same scan time without a reduction in image quality. Several coils can be used for MRI of the hip including: a cardiac surface coil, a flexible body coil (21), or one of several new multiple channel flexible coils that provide high signal to noise. Comfortable positioning is indispensable to avoid motion artifacts, which adversely impact image quality. In order to achieve high resolution and signal to noise in a limited examination time, one hip should be examined at a time with a dedicated coil (17). It should be noted, however, that small FOVs may lead to aliasing or wrap around artifacts, and phase oversampling may not completely resolve these issues. MRI assessment of the hip may be impacted by rotation of the femoral neck, and reproducible positioning of the lower extremity with internal rotation will improve imaging during longitudinal studies.
Image Contrast
MRI protocols of the hip typically use two-dimensional fast spin-echo sequences with intermediate-weighted and T2-weighted contrast with fat suppression or short tau inversion recovery (STIR), which are effective in assessing occult fracture or unsuspected intra-pelvic pathology (Figure 3). Femoral anteversion may be assessed using low-resolution axial images acquired through both distal femora in combination with standard axial images of the pelvis including both hip joints. This may eliminate the need for ionizing radiation and version assessment using computerized tomography (CT) (25).
Figure 3.
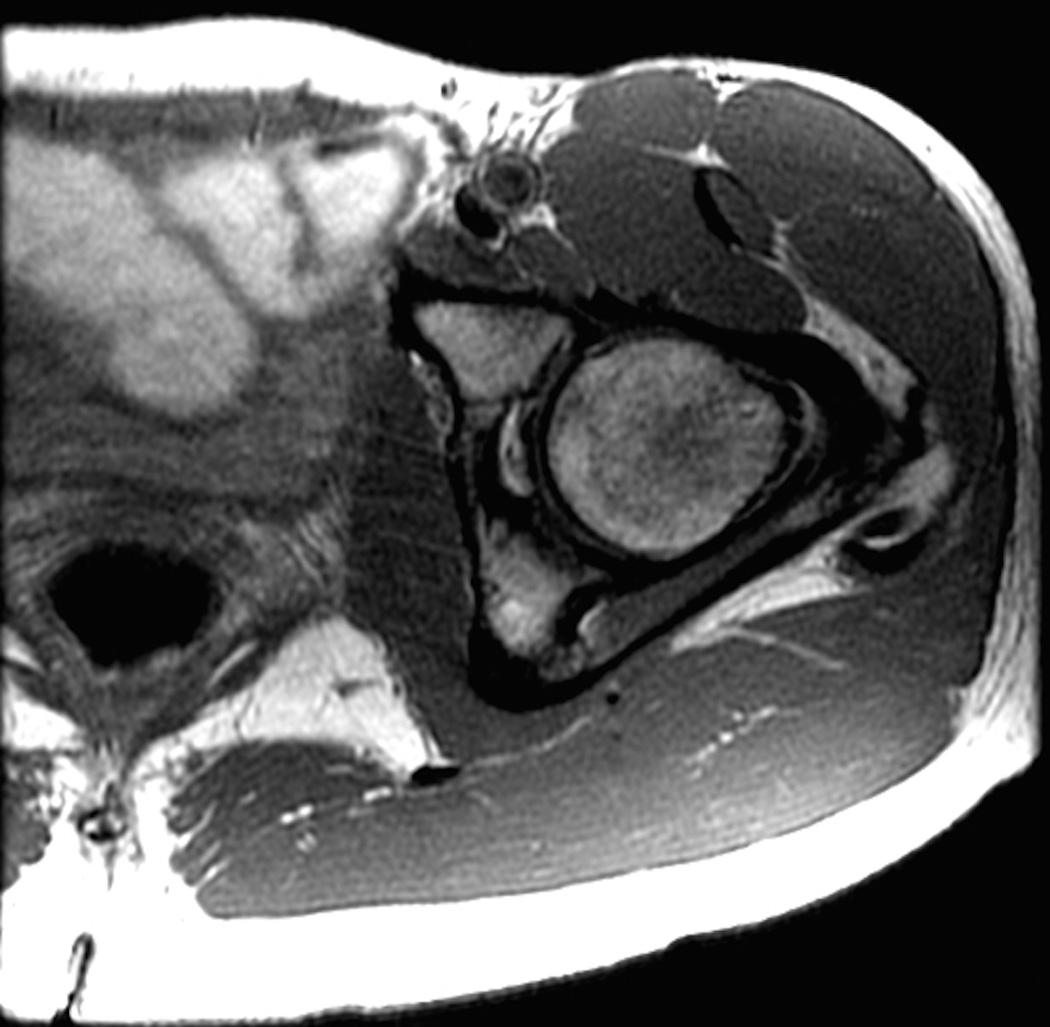
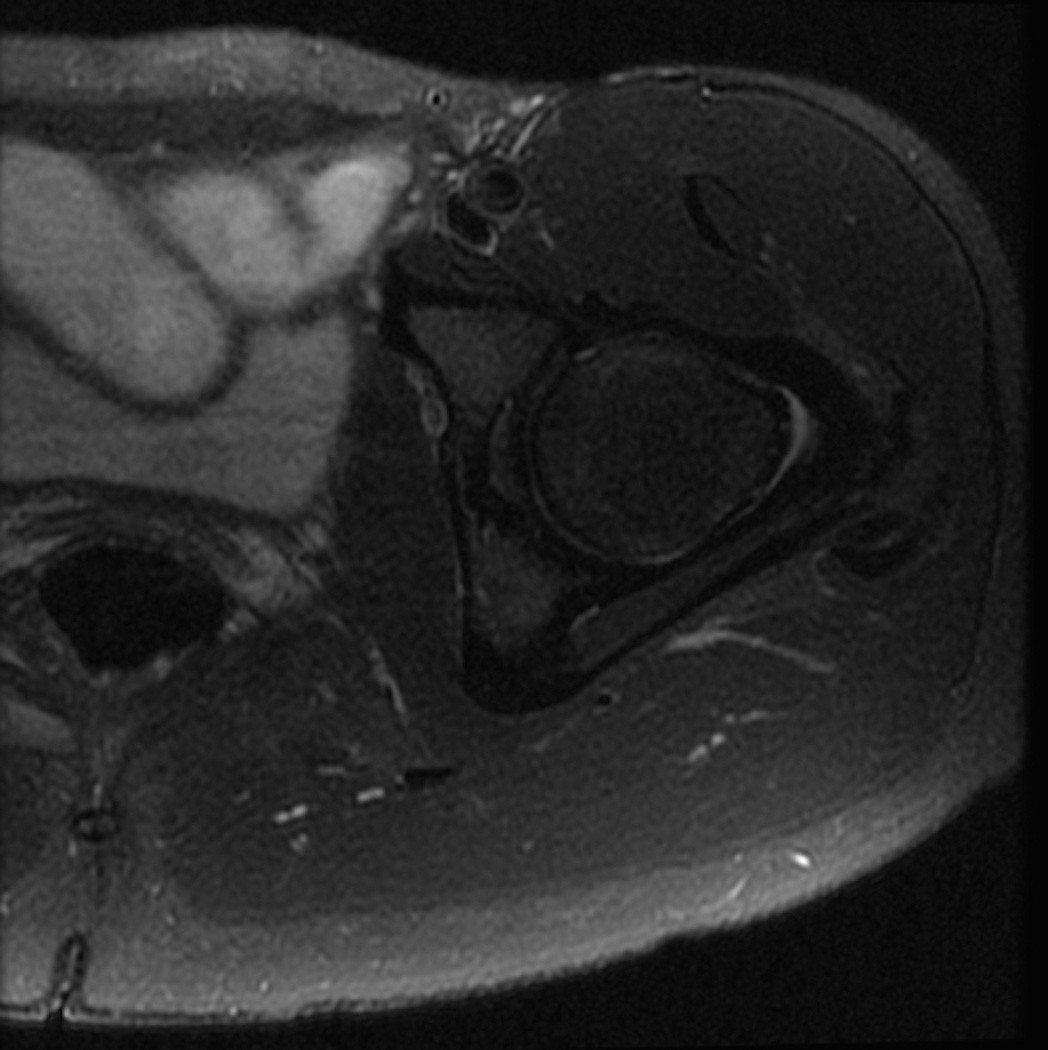
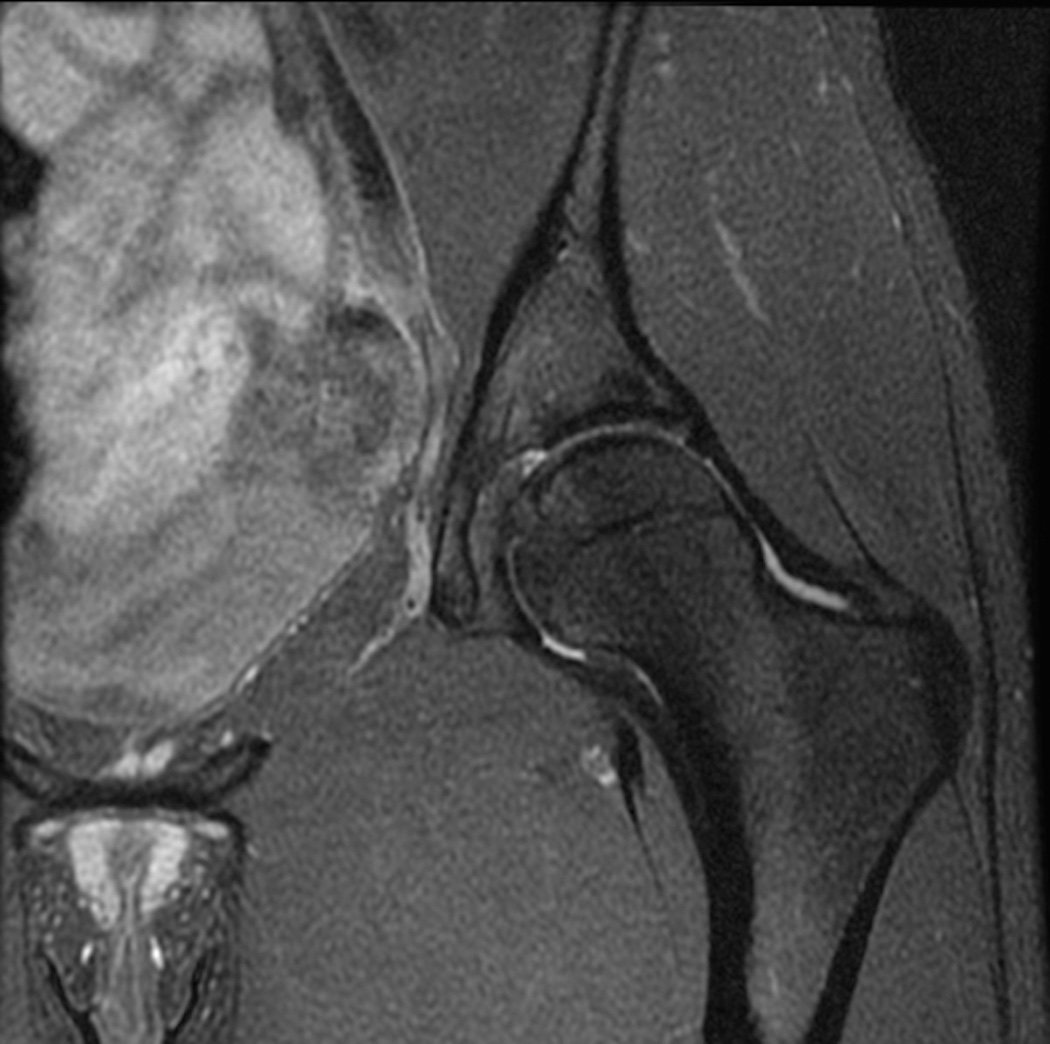
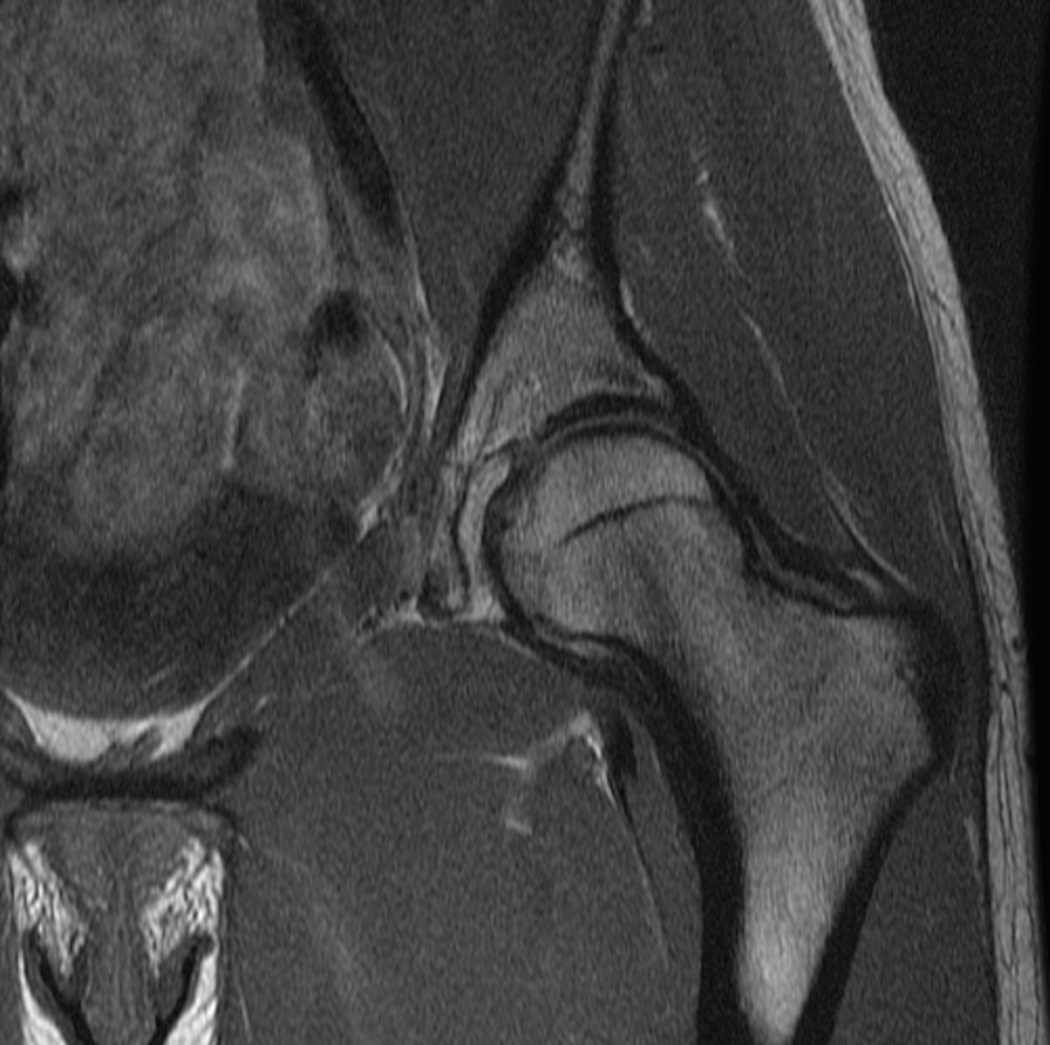
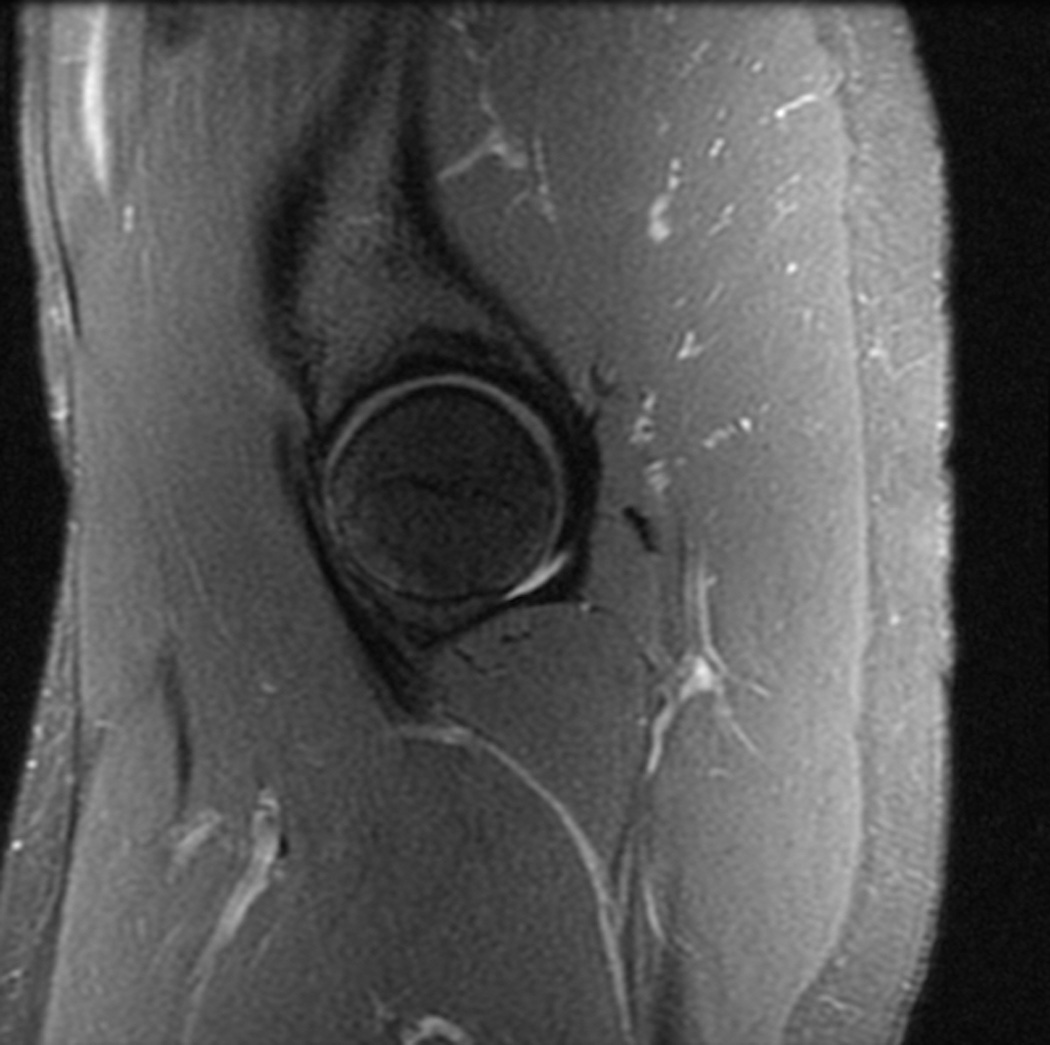
Standard MRI examination of the hip with two-dimensional fast or turbo spin echo sequences. (a) Axial intermediate weighted MRI without fat suppression. (b) Axial T2-weighted MRI with fat suppression. (c) Coronal intermediate weighted MRI with fat suppression. (d) Coronal T1-weighted MRI without fat suppression. (e) Sagittal intermediate-weighted MRI with fat suppression. All relevant anatomy (bone, cartilage, joint fluid, labrum) can be evaluated on these images.
Some authors have advocated the use of MR arthrography of the hip, this being more invasive with potential risks of infection, nerve injury, and pain associated with injection of intra-articular contrast. MR arthrography may be useful in the clinical setting for joint distention and intra-articular nerve block for diagnosis. The decision whether the hip is imaged using MR arthrography or high-resolution non-contrast MRI should be based upon the personal experience of the referring physician and the musculoskeletal radiologist. In a clinical trial setting MR arthrography may be challenging to pursue due to reasons of difficulty obtaining IRB approval, selection bias of patients, and the invasive nature and associated risks of hip joint injection as described above, as well as operational challenges.
Non-contrast MR protocols for evaluating the hip should ideally take advantage of the inherent magnetization transfer effect in articular cartilage, allowing for differential contrast between intermediate signal intensity cartilage, low signal intensity labrum, and high signal intensity subchondral bone marrow(26). Fat suppression techniques may be employed to optimize the dynamic contrast range of the image and to reduce chemical shift at the bone-cartilage interface(27). Furthermore, fat-suppressed sequences are highly sensitive to bone marrow abnormalities that may be missed when applying only non-fat-suppressed imaging. Use of a wider receiver bandwidth on non-fat suppressed images minimizes chemical shift artifact and decreases inter-echo spacing, reducing scan times and artifact. Increased receiver bandwidth comes at the cost of signal-to-noise ratio. MR protocols should use echo times between 30 milliseconds (ms) and 60 ms. Slice thicknesses of 2.0 – 2.5mm with no gap between slices are most effective for detecting cartilage and labral pathology. Oversampling in the frequency direction with a 512 matrix, combined with 320 to 384 phase encoding steps, allows for a high in-plane resolution of 0.30 – 0.35 mm which is especially important for identifying subtle labral tears and cartilage defects and delamination (26).
Three-dimensional MRI
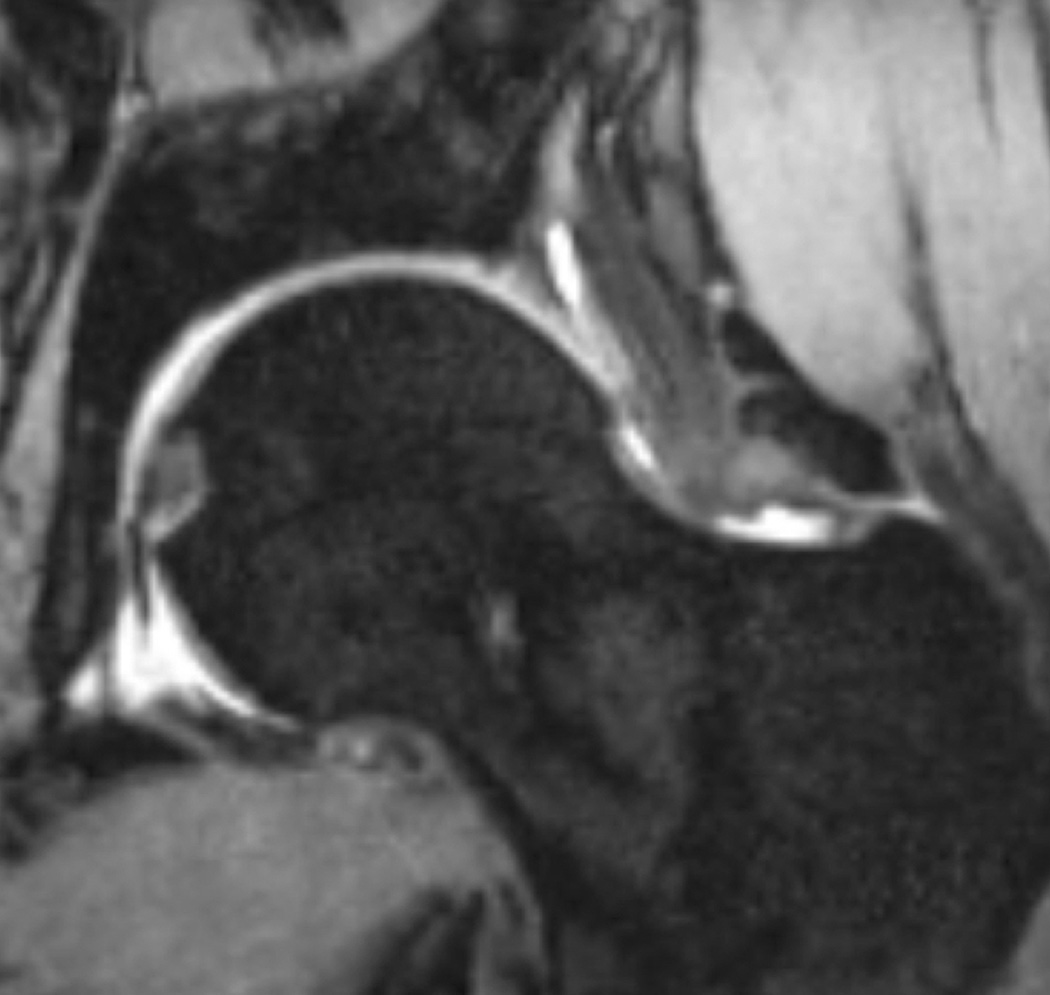
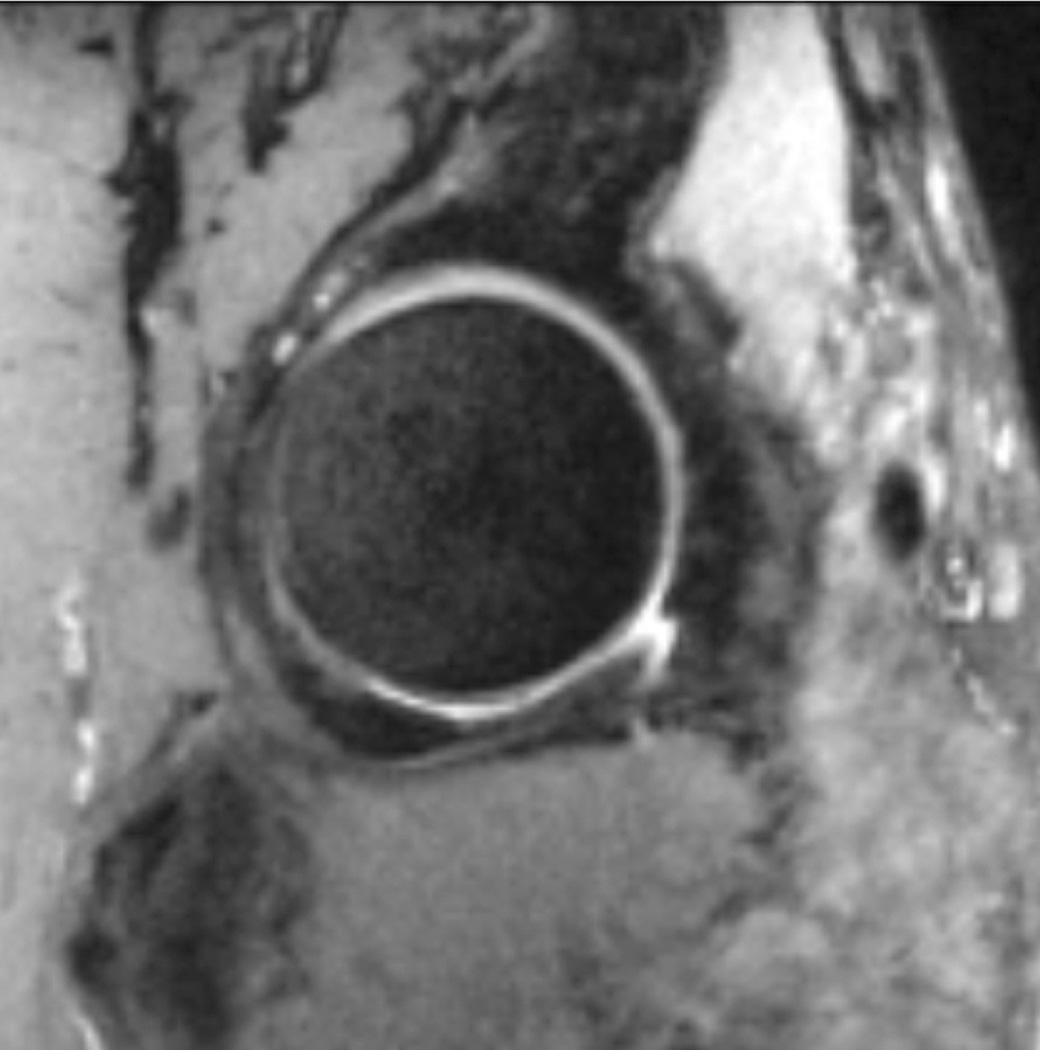
Three-dimensional gradient-echo and fast spin-echo sequences (Figure 4) are useful in longitudinal studies for measuring cartilage thickness change in the hip joint (28). However, three-dimensional imaging can be more susceptible to artifacts such as motion due to longer scan times and phase wrap. Tissue contrast in three-dimensional gradient echo sequences limits the evaluation of the labrum, ligaments and tendon insertions. Quantitative assessment of hip cartilage is challenging due to the spherical surface geometry of the femoral head and acetabulum, the thin cartilage, and the inherent difficulty in differentiating acetabular from femoral cartilage. However, with use of high field strength scanners and multi-channel coils, three-dimensional images of articular cartilage with 0.3mm × 0.3mm in-plane spatial resolution and 1.5 mm slice thickness can be acquired in relatively short imaging times (29). Quantitative assessment is best performed in a standardized fashion, dividing the articular surface into zones for regional analysis. Intra-articular contrast and traction may allow separation of acetabular from femoral head cartilage, but both are challenging for clinical trials (30). MR sequences that provide bright (hyperintense) joint fluid may have the best chance of delineating the layers consistently, or use of radial two-dimensional approaches(21).
Figure 4.
Reformations from an axial 0.8 mm isotropic 3D fast spin echo acquisition at 3T. (a) Coronal reformat, 3 mm slice. (b) Sagittal reformat, 3 mm slice.
MRI of Cartilage Composition
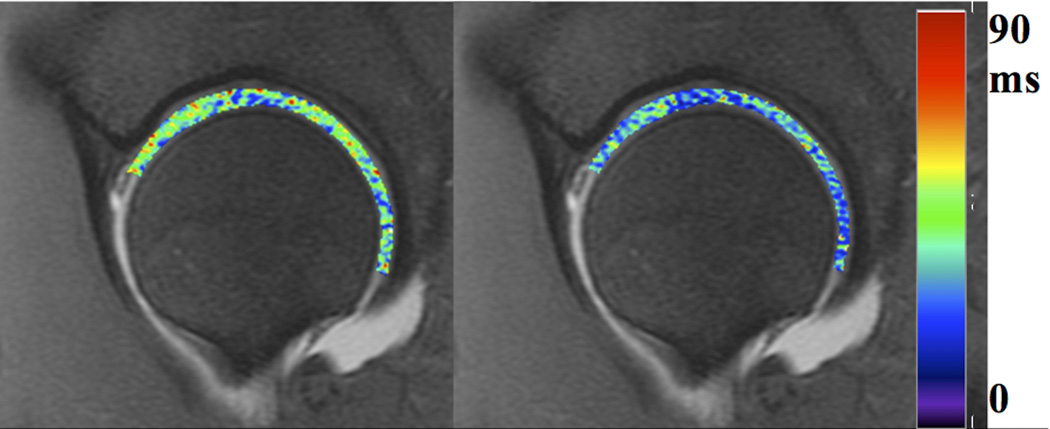
Various compositional MR techniques have been used to evaluate hip cartilage such as delayed gadolinium enhanced imaging (dGEMRIC) (31, 32), T2- (33, 34), and T1rho mapping (35). The use of dGEMRIC provides a sensitive and specific measure of the proteoglycan content of cartilage, but is less popular due the relatively long (one- to two-hour) delay between injection and imaging, and the potential risk of contrast reactions (36–38). The use of T2 or T1rho mapping (Figure 5) for assessing collagen ultra-structure (39) and proteoglycan depletion (40–43) respectively obviates the need for contrast, but T2 and T1rho relaxation times of cartilage are non-specific which may reflect multiple biological (compositional) changes that occur with cartilage pathology (44, 45), mechanical loading (46), and orientation of cartilage relative to the main magnetic field (47, 48). Thus, interpretations of changes in T2 and T1rho relaxation time of cartilage in longitudinal studies are difficult. Validation of these techniques is still ongoing and recommendations on which technique is best suited for application in a clinical trial setting are premature.
Figure 5.
T1rho (left) and T2 (right) color maps of the hip in a healthy volunteer, for evaluation of cartilage matrix properties. T2 is correlated with collagen organization, and T1rho with proteoglycan content.
Computed Tomography/Arthrography/Ultrasound
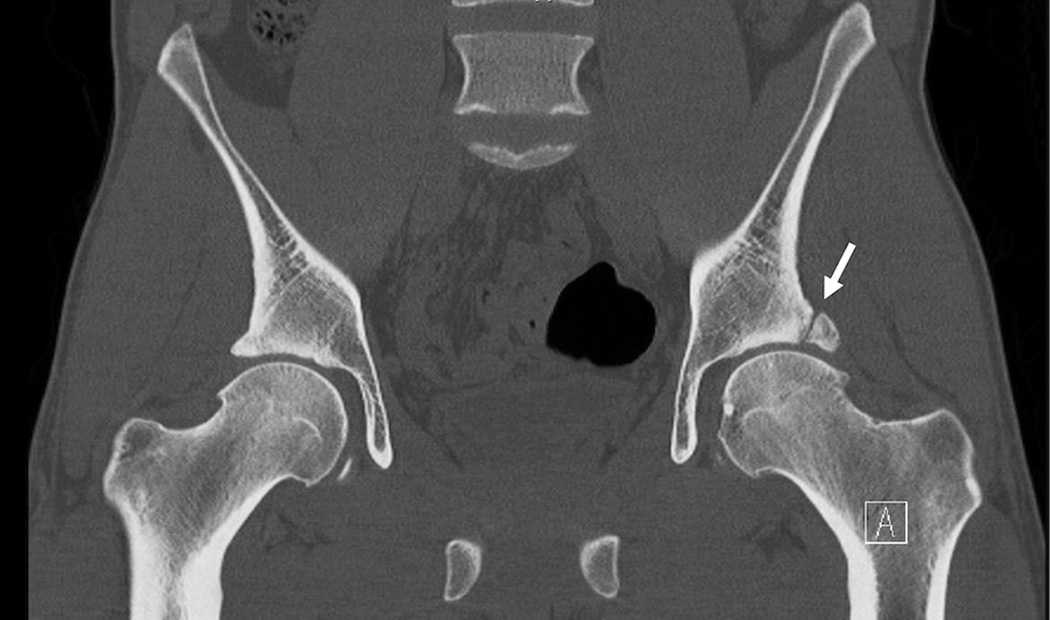
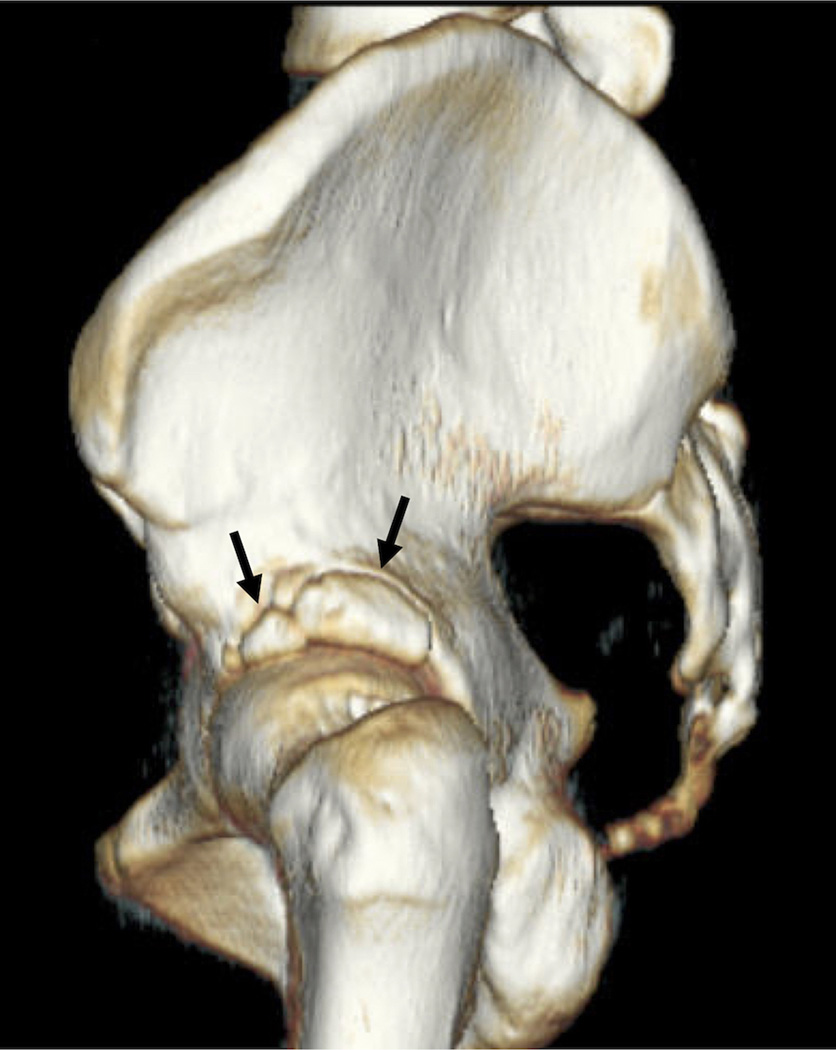
Computed tomography (CT) can be used in the hip joint to provide a 3D assessment of bone anatomy, and is useful in measurement of FAI for pre-surgical planning (Figure 6). CT is a widely available modality that can rapidly provide information on the bony anatomy with high spatial resolution; further images can be automatically segmented to provide this 3D information. Without intra-articular contrast, however, CT provides little information on the cartilage, labrum, and soft tissues of the joint. Also, because CT of the hip exposes sensitive organs with ionizing radiation, the small risk of potential induction of cancer in subjects in larger clinical trials should be considered. Ultrasound may be used to detect hip joint effusion but is not commonly used in hip OA clinical trials.
Figure 6.
(a) Coronal reformation of computed tomography study of the pelvis, demonstrating os acetabula (arrow). (b) Three-dimensional shaded-surface display of the same hip, shown from a sagittal orientation. Arrows show the os acetabula.
COMMONLY ENCOUNTERED PROBLEMS: POSITIONING, HARDWARE AND COIL FAILURES, SEQUENCES/ARTIFACTS
Commonly encountered problems in radiography
Subtle positional changes of the hip, which may be due to pain or secondary to OA, may alter the measured JSW on AP abdominal and pelvic radiographs (14). The influence of joint positioning and radiographic procedures was also analyzed (7) and it was found that modifying the X-ray beam and foot rotation increases variability in JSW measurements. One study reported that 15 degrees of adduction or 30 degrees of flexion of the hip resulted in apparent widening of the hip JSW, whereas hip abduction caused reductions in JSW. Minor hip flexion (<15 degrees); however, did not seem to influence the JSW measurement. These patterns were reproduced at superior-lateral, superior-medial, and superior-intermediate locations of hip JSW measurement. Assessment at the point of maximal narrowing appeared to be influenced less by positional changes than the average of the three defined-site measurements (14) or other measurement locations.
Commonly encountered problems in MRI
Similar to other clinical trials utilizing imaging in OA, it is important to consider the specific trial endpoints when determining the MRI protocol and the required field strength of the MRI unit. Regardless of whether the endpoints will be semi-quantitative scores or quantitative measurements, to ensure reliable results the imaging protocol must be defined before the trial starts and complied with by all clinical sites for the duration of the trial. All trial sites must comply with the specified standardized imaging protocol. In addition, incoming data quality control needs to include verification of imaging parameters, including slice thickness and in-plane resolution. To avoid future errors, and maximize the chance of recalling subjects when necessary for re-imaging and retaining them in the study, feedback to imaging sites needs to happen quickly and on an ongoing basis.
Imaging Planes and Resolution
Imaging planes should be aligned in the anatomic coronal and sagittal planes, with the option for additional special radial views that can be used for assessment of the acetabular labrum. For quantitative analysis of the cartilage, high resolution and high SNR is required. Selection of an oblique axial imaging plane aligned with the femoral neck can be used to assess the alpha angle. Although thin slices are not considered to be as essential for semi-quantitative scoring as for quantitative measurements of cartilage thickness, thicker slices will make the detection of changes in all scored parameters difficult. This affects mostly scoring of cartilage thickness and cartilage defects; small defects may seem to come and go and changes in cartilage thickness are hard to see due to partial volume effects and the relationship between the voxel size and the size of the feature may change. However, thicker slices also affect scoring of bone marrow lesions and even the amount of joint fluid. For reliable scoring results, especially for cartilage, slice thickness should ideally be 2–3mm and should not exceed 3.5mm and there should be no gap between slices. However, researchers have to be aware that thinner slices require longer acquisition times and result in a loss of signal compared to thicker slices.
Quantitative cartilage imaging is more demanding for spatial resolution, with slice thickness from 1.5 to 2 mm and in plane resolution from 0.4×0.4 mm to 0.6×0.6 mm necessary to reliably detect and follow small defects less than 5 mm2. In OA the presentation of cartilage loss can vary from enlargement of a single defect to the thinning of cartilage over large areas, therefore a slice thickness of 2–3 mm and in-plane resolution of 0.6×0.6mm or higher are recommended. In this context it is important to note that quantitative analysis does not require isotropic resolution. Consistency of slice thickness is important in scoring change and measuring cartilage thickness.
Imaging sequences
The goals of imaging sequences for quantitative cartilage analysis in the hip are similar to the knee joint. As such, they are manufacturer-dependent as every manufacturer has a proprietary approach to some type of fat suppressed/fat saturated/water excited acquisition; either a 3D fast spin echo or some form of 3D fast gradient echo sequence. All of those sequences have been validated for imaging of cartilage (22, 49–52). Their ability to show the boundaries between bone-cartilage, cartilage-cartilage, cartilage-degenerated meniscus, cartilage-inflamed synovium, and cartilage-synovial fluid varies. While selecting a sequence it is important to ensure that the imaging parameters are selected so that the visualization of those interfaces are optimally delineated, particularly those with the greatest impact on study endpoint.
MRI for quantitative assessment of cartilage composition using T2 and T1rho mapping has similar resolution dependencies as quantitative imaging of cartilage thickness. Thick slices and low in-plane resolution will limit detection to generalized changes while preventing detection of local abnormalities and their progression. For T2 measurements a practical slice thickness is 3 mm. There are varying opinions of the number of echoes needed in the multi-echo spin echo series for reliable T2 calculations, varying from two echoes to 11 echoes (53, 54), as well as of the smallest reliable echoes(55). The practical issue is that the larger the number of echoes, the smaller the number of slices that can be acquired, limiting anatomical coverage of the hip with thin slices. Regardless of the number of slices, however, assessments are only useful for comparison if the area covered and the imaging plane used are the same from time point to time point.
The variability of T2 measurements between different manufacturers and different imaging units is a well-known confounding factor. The effect of the variability can be minimized by using small, standardized MRI phantoms with different T2 relaxation times, which are positioned in the imaging field of view of the T2 series acquired for each subject at each time point. This facilitates pooling of T2 data across multiple sites and equipment and verifies possible change between time points (56). Imaging of the transverse relaxation time using gradient echoes, T2*, has been studied in femoroacetabular impingement, but has not been validated in OA trials (57). At this time, T1rho sequences have not been validated for use in OA trials; therefore, their use will be limited to provide only experimental endpoints.
Since both quantitative and qualitative assessments may use fat-suppressed/saturated sequences, inhomogeneous fat suppression due to field inhomogeneity will affect analysis results. Distortion due to field inhomogeneity affects the qualitative measurements (58, 59). Since the cartilage thickness changes over time are relatively small geometric distortion can affect the reliability of the results. The stability of field homogeneity should be monitored by scanning special uniformity and linearity phantoms at the start of the study and periodically throughout (60). Transmit/receive as well as receive only coils, which are used for knee and hip imaging tend to start failing slowly (61). Therefore phantom scanning should monitor coil performance throughout the study. Although of relatively rare occurrence, significant changes in imaging performance can be caused by software or hardware upgrades of the scanner, or problems requiring a re-shim. Periodic phantom scanning can detect these issues before too much study data has been potentially lost.
Commonly encountered problems in Ultrasound and CT
Ultrasound may be used to assess joint effusion and synovitis. If inflammation in the hip joint is an endpoint of a study, ultrasound may be considered but is prone to operator dependence. Ultrasound is not routinely used in the evaluation of hip OA.
CT allows exquisite delineation of the bony structures but is limited in assessment of soft tissue structures. If the bony anatomy is an important endpoint, CT can be considered. Generally, thin slices with high in-plane resolution should be obtained for reformations and 3D models.
QUALITY ASSURANCE/CONTROL PROCEDURES
Quality Assurance of Hip Radiography
For quality assurance in radiography, the most important aspect is that images are acquired in a consistent manner for any subject in a study evaluating longitudinal measurements. The choice of standing or supine is less critical than consistency. Studies attempting to use images obtained for another purpose, such as abdominal films, show less consistency in grading and measurement of hip JSW. In summary, antero-posterior radiographs of the pelvis that includes both hips with feet rotated in 15–20° should be obtained utilizing a foot map. There may be a slight advantage of weight bearing over reclined position in more severely narrowed hips(12), but in obese subjects weight-bearing images can reduce image quality.
Quality Assurance of Hip MRI
To date no clinical trials have applied MRI for serial assessment of the hip. MRI of the hip has drawn a lot of attention in recent years due to its potential role of assessing joints of patients with femoroacetabular impingement and acetabular dysplasia, both a potential risk for consequent hip OA and surgically treatable condition (62–64). In order to stratify patients that might potentially benefit from surgery, complex MRI protocols have been developed to evaluate all intra- and periarticular structures such as the labrum, cartilage, subchondral bone, and periarticular tissues (26, 30, 62–64). These protocols include 1.5 T and 3 T MRI systems, the application of reformatted or primarily acquired radial sequences, the application of gadolinium-based contrast agents for assessing cartilage matrix composition, and oblique planes along different anatomical structures of the joint (26, 30, 65, 66).
While MRI is capable of visualizing extremely detailed anatomy and pathology, the implementation of some of the above protocols appears to be challenging due to complex requirements on the technologist’s side and lengthy exams that predispose to patients’ motion artifacts (67, 68). Advanced and complex protocols are challenging to implement when to be applied to large studies including multiple clinical sites. For whole joint assessment standard fast or turbo spin echo sequences using anatomic imaging planes have proven sufficient for achieving a reasonable reliability for the different features assessed (69). Further the definition of the outcome, i.e. a single joint or both hips, is relevant to protocol development. Acquisition of both sides, especially with the purpose of quantitative assessment of cartilage, is much more time consuming and prone to motion artifacts due to long acquisition time.
The same quality assurance measures that apply to the knee joint also apply to the hip joint, including calibration markers visible in the FOV for quantitative measurements and periodic phantom calibration to ensure longitudinal repeatability.
MEASUREMENT METHODS - HIP IMAGING
Radiography
Radiographic methods are mostly based on measurements of JSW (quantitatively stated in mm) and the size of osteophytes. Semi-quantitative methods have been used for several decades and include the Kellgren and Lawrence (KL) grading (70, 71), the Croft score (72) and the OARSI scores of osteophytes and JSN base on the Atlas (73). The OARSI atlas does not define OA but grades different features of hip OA and defines these by presenting image examples. The main features are superior acetabular and femoral osteophytes, inferior osteophytes as well as superior and medial joint space narrowing, which are classified from 0–3. In addition subchondral cysts, subchondral sclerosis and thickening of the medial femoral calcar (buttressing) are differentiated.
KL grading differentiates 4 grades of hip OA: grade 1 (doubtful OA), no narrowing of the joint space and possible osteophytes; grade 2 (mild OA), definite osteophytes, and possible JSN; grade 3 (moderate OA), definite JSN, moderate osteophytes, some sclerosis and cyst formation, and possible deformity of the femoral head and acetabulum; and grade 4 (severe OA), complete loss of JSW with sclerosis and cysts, marked deformity of the femoral head and acetabulum, and large osteophytes. Excellent inter-reader variability has been reported in a recent study of KL grades of the hip (74). The Croft score grades OA into 5 categories: grade 1, osteophytes only; grade 2, JSN only; grade 3, two of osteophytes, JSN, subchondral sclerosis, and cyst formation; grade 4, three of the same features as above; and grade 5, as in grade 4 but with deformity of the femoral head. A previous study comparing both grading systems by intra-and inter-observer variation found kappa values of around 0.6, which were somewhat lower for the Croft score (75). The same study showed higher kappa scores for measuring reductions in JSW (kappa value = 0.87).
Different quantitative measurements to assess JSW are available (76–78). A recent comparison of manual versus computed-assisted JSW measurement over 3 years on pelvic radiographs, front hip view and Lequesne’s oblique view concluded that front AP pelvic or front hip view of the target hip should be preferred. This paper showed that the manual reading (using a 1/10 mm graded magnifying glass) by a highly trained reader was more accurate and sensitive to change than the computed-assisted measurement (16).
Hip OA was defined on radiographs by a minimum JSW ≤ 2.0 mm and was found to be the simplest and most reproducible classification in long-term follow-up of patients with developmental hip dysplasia and OA (77, 79). An alternative to JSW is to use 2D statistical shape models (SSSMs) (80, 81) that may reduce the tendency of the measurements to vary as a result of beam angle or positioning.
MRI
MRI based semi-quantitative measurements allow classifying a large variety of tissues involved in OA such as cartilage abnormalities, labral tears, bone marrow lesion (BML) pattern, synovitis and ligamentous abnormalities. Two semi-quantitative scoring systems have been used to date; i.e., the HOAMS score (69) and the SHOMRI score (82). HOAMS is a whole-joint MRI score that incorporates 14 articular features including: cartilage morphology, subchondral BMLs, subchondral cysts, osteophytes, acetabular labrum, synovitis (whenever contrast-enhanced sequences were available), joint effusion, loose bodies, attrition, dysplasia, trochanteric bursitis or insertional tendonitis of the greater trochanter, labral hypertrophy, paralabral cysts and herniation pits at the superior lateral femoral neck (69). Three of the features examined (cartilage morphology, subarticular BMLs, subarticular cysts) related to the articular surfaces were subdivided into 9 sub regions for cartilage evaluation, in relation to their position on the articular surfaces, and 15 sub regions for acetabular and femoral subchondral BMLs. The articular cartilage surfaces of the acetabulum and femoral head were scored together as a clear delineation of both surfaces is not possible on standard non-arthrography 1.5 T MRI. The SHOMRI classification scores only 8 features including articular cartilage loss, BML pattern, subchondral cysts, labral abnormalities, loose bodies, joint effusion and ligamentum teres abnormalities (82, 83). Ten sub regions are used in evaluation of cartilage, BML pattern, and subchondral cysts, 4 sub regions in the acetabulum and 6 in the femur.
The Hip Inflammation MRI Scoring System (HIMRISS) has also been described but was designed only for active lesions (BML, synovitis/effusion) (84, 85). The HIMRISS classification only focuses on so-called active lesions, i.e. BML and synovitis/effusion.
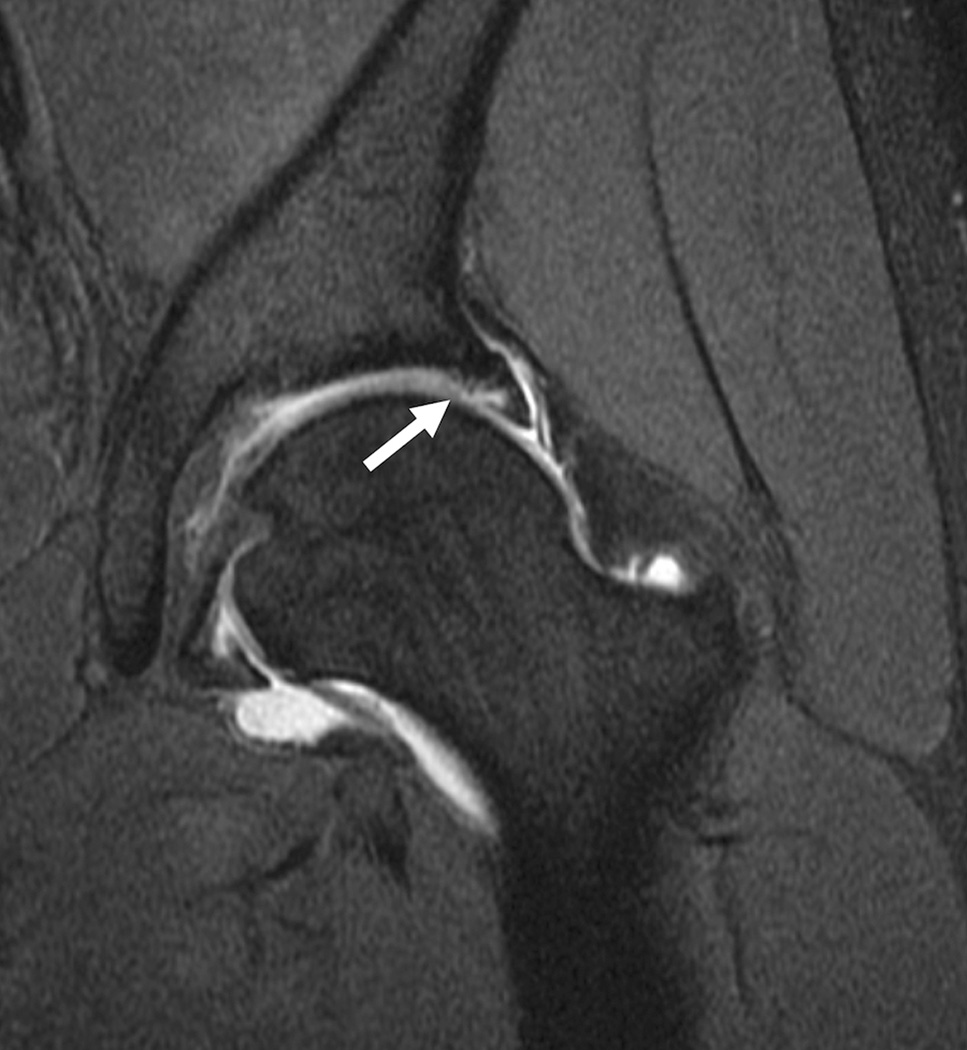
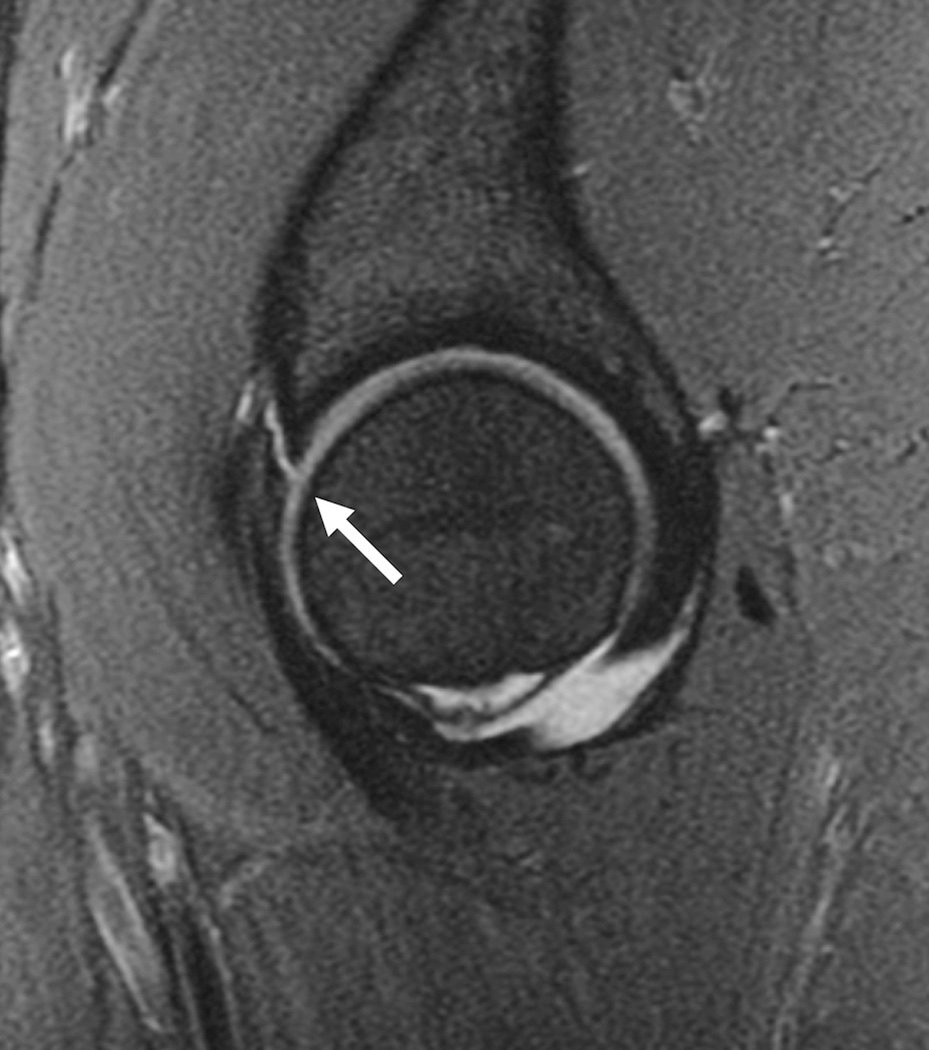
Cartilage biochemical composition of the hip has been quantified with T2 (20, 33, 86) and T2* relaxation time measurements (87), dGEMRIC (31, 32, 66, 88–96) and T1rho relaxation time measurements (35). An initial study (95) found high reproducibility using dGEMRIC (ICC range, 0.667–0.915) in young healthy subjects. Additional studies applied dGEMRIC to the study of femoroacetabular impingement (96–98) and hip dysplasia (66). Using T1rho and T2 a recent study demonstrated regional variations in hip cartilage composition and suggested that analysis based on local regions was more sensitive than global measures in subjects with and without femoroacetabular impingement (20). Overall it should be noted that most of these studies analyzing quantitative MR parameters at the hip were performed in small populations and targeted early changes mostly in patients with femoroacetabular impingement (Figure 7) and hip dysplasia; these techniques at the hip are inherently challenging because of the thin cartilage layer and required high resolution MRI.
Figure 7.
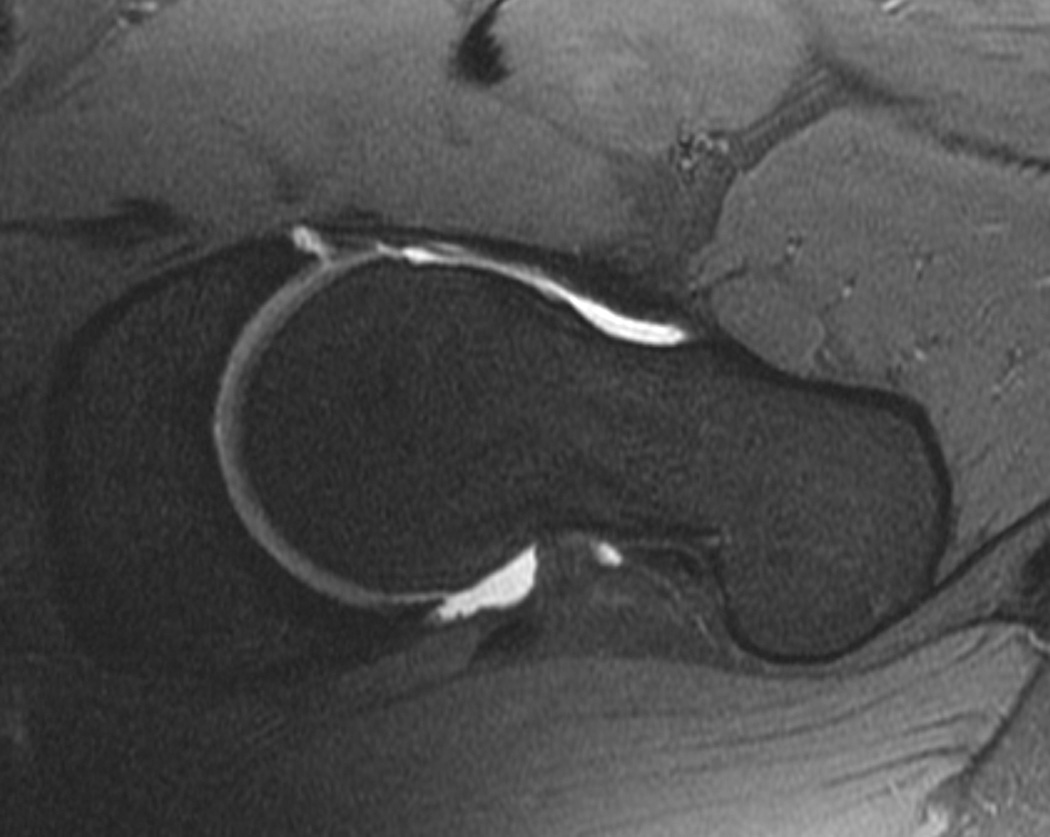
T1-weighted fat-suppressed images from an MRI arthrogram in a subject with a history of femoroacetabular impingement. (a) Coronal image showing a labral tear (arrow). (b) Sagittal image showing an anterior labral tear. (c) Oblique axial image for measurement of alpha angle.
Ultrasound and CT
Both Ultrasound and CT have a limited role in assessing OA and are commonly used for evaluating synovitis and joint effusion (ultrasound) or for fracture diagnosis (CT). CT provides detailed information on osteophytes, subchondral sclerosis and joint space narrowing but is not used as a standard technique for OA assessment. Also Nuclear Medicine techniques are generally not used for measuring hip OA although subchondral bone alterations may be characterized by bone scintigraphy (99) or 18F-fluoride PET (100).
MEASUREMENT PERFORMANCE: RELIABILITY, RESPONSIVENESS, VALIDITY
Radiography
Concurrent Validity
Several studies showed cross-sectional relationship between JSW and symptoms as reported in a relatively recent meta-analysis (13). For example, in a population-based study including 3,595 participants, it was shown that the presence of hip pain, of moderate and severe disability and, to a lesser extent, stiffness, were associated with minimal JSW (101). In another population-based study of 3,208 participants, a minimal JSW ≤ 2 mm was significantly associated with self-reported pain in or around the hip joint during the previous 12 months (102). Another study in 735 participants from the Johnston County Osteoarthritis Project that took JSW measurements at the first follow-up, reported minimal JSW not to be related to pain, but a minimal JSW < 2.5 mm was found to be associated with functional impairment (103).
The same meta-analysis looked at longitudinal validity and only found 2 articles with relationship between baseline symptoms and subsequent JSW loss (13). In the first study of 458 patients in a 3-year randomized controlled trial (RCT), a baseline Lequesne’s index > 10 was an independent predictor of subsequent 1-year change in minimal JSW ≥ 0.6 mm (104). In the second study of 745 women aged over 65 with radiographic hip OA (936 hips), the JSW loss during follow-up was greater in subjects with baseline hip pain (105).
Table 1 provides the inter- and intra-observer variability of the JSW from a number of studies evaluating the hip with manual and semi-automated software. Reproducibility was poorer in the hip than in the knee and even with semi-automated software about 25% of cases required operator intervention. Hip JSW loss amounts to between 0.02 mm/yr (5) and 0.09 mm/yr (106) but specific subgroups (about 15%) may display a more rapid progression of up to 0.42 +/− 0.24 mm/yr (106). Moreover, a high proportion of patients vary and very few do not vary at all, over a 3-year period of time, which means that the distribution of changes in JSW does not follow a normal distribution, as shown in a recent structure-modifying trial(107).
Table 1.
Intra-observer and inter-observer variabilities of radiographic hip measurements
| Article | Number of subjects |
Acquisition | Intra-observer variability |
Inter-observer variability |
|---|---|---|---|---|
| Lequesne et al. (77) | 30 | Supine | Observer1: SD = 0.26 / ICC=0.90 / LoA: [-0.90; 0.55] Observer2: SD = 0.33 / ICC=0.77 / LoA: [-1.09; 0.74] |
ICC=0.78 |
| Maheu et al.(16) | 50 | Standing | Manual reading Observer1: SD = 0.25 / ICC=0.96 / LoA: [-0.49; 0.51] Observer2: SD = 0.15 / ICC=0.98 / LoA: [-0.29; 0.31] |
SD = 0.39 / ICC=0.88 |
| Okano et al.(10) | 162 | Standing and Supine | SD=0.13 mm / CR=0.26 mm | NA |
| Conrozier et al. (9) | 50 | Standing | Computer assisted reading Observer1: SD = 0.13 / ICC=0.96 Observer2: SD = 0.33 / ICC=0.88 |
SD=0.31 mm ICC=0.98 |
| Nishii et al. (15) | 156 | Supine | SD = 0.140 mm / ICC = 0.993 | SD= 0.248 mm / ICC = 0.979 |
If additional views of the hip joint are needed for a particular study, then alternative positions, such as the Frog leg and/or Lesquesne’s position can be performed.
Predictive Validity
When looking at the prediction of future JSW loss, an 3-year RCT study in 458 patients demonstrated baseline minimal JSW < 2.0 mm was an independent predictor of 12 month radiological progression (104).
Regarding prediction of future JSW loss or future total hip replacement (THR), a prospective cohort (mean follow-up = 6.6 ± 0.5 years), showed that baseline minimal JSW ≤ 2.5 mm was a predictor of a JSW loss ≥ 1.0 mm or a THR (11).
With respect to predicting THR, 5 studies showed a relationship between baseline JSW and later THR. In a 3-year RCT in 506 patients, the combination of a baseline minimal JSW < 2 mm and the rate of first year change in minimal JSW was more strongly associated with THR during the 2-year follow-up (108). These same patients were followed-up for an additional 2 years and the study showed a decrease of minimal JSW of at least 0.2 mm during the first year predicted THR during the 4 following years and a decrease of minimal JSW of at least 0.4 mm during the first two years predicted THR during the 3 following years (109).
Responsiveness
In a recent meta-analysis, data on minimal JSW were extracted from 11 articles (7 cohort studies, 4 RCTs. Minimal JSW was assessed using a manual technique in 4 studies, and a computer-based technique in 7. The mean sample size was 164. The overall SRM was 0.66 (95% confidential interval (95%CI) = 0.41–0.91). The responsiveness tended to be higher in observational studies (SRM = 0.83; 95%CI: 0.49, 1.16) than in RCTs (SRM = 0.35; 95%CI: 0.12, 0.57). Responsiveness varied by method of measurement, with greater responsiveness seen in studies using computer-based measurement (SRM = 1.12; 95%CI: 0.64, 1.59) compared to manual measurement (SRM = 0.47; 95%CI: 0.31, 0.62) (13).
Reliability
Improved inter-observer agreement (kappa value = 0.87) on radiography was obtained with minimum JSW (< 2.0 mm). Inter-observer agreement was moderate (kappa = 0.55) for KL and Croft grading, but kappa increased when the number of categories was reduced from 5 to 3 (no OA, mild OA, and severe OA). The intra-observer agreement was better than inter-observer agreement (75).
MRI
Reliability
Reliability for HOAMS was performed on a random subset of 15 cases with hip pain (69). Weighted-kappa statistics as measure of intra- and inter-observer reliability were as follows: Intra-reader reliability for the different features ranged from 0.18 (cysts) to 0.85 (cartilage). Inter-reader reliability ranged between 0.15 (cysts) and 0.85 (bone marrow lesions). For bone marrow lesions, synovitis/effusion, reliability of HOAMS and HIMRISS were as follows: HIMRISS: ICCs of 0.52, 0.61, 0.7, and 0.58 for femoral BMLs, acetabular BMLs, effusion, and total scores; HOAMS: ICCs of 0.52 and 0.46 for summed bone marrow lesions and synovitis in with improvement of ICCs in the second exercise. Inter-reader agreement for change scores was 0.81 (HIMRISS – femoral) and 0.71 (HOAMS summed) BMLs (110).
Reliability for the SHOMRI score was analyzed in 72 subjects with and without radiographic evidence of OA (82). Intra- and inter-reader intra-class correlation coefficients ranged from 0.91–0.98. Intra-reader kappa values were between 0.65 and 0.79 with lowest values obtained for paralabral cysts and highest values for BMLs. Inter-reader kappa values were between 0.55 and 0.79 with lowest values seen for effusion/synovitis and highest values for intra-articular bodies.
In one study of cartilage volume (4), intraobserver reliability was assessed in 100 subjects on the same images with at least a 1-week interval between measures. The coefficient of variation (CV) was 2.5%. Interobserver reliability was assessed in 20 subjects, with a CV of 4.4%.
An automated method for cartilage volume measurement (21) has also been tested. Acquisition was done on 1.5T Siemens MRI scanner using radial sequence. Cartilage volume/thickness variation of the implementation of the bone registration: femoral head ≤0.08%±0.04; acetabulum ≤0.05%±0.09. Intra-reader coefficient variation or the global and each sub region ≥0.942, p<0.0001. Inter-visit coefficient variation: global ≥0.983, p<0.0001; femoral head ≥0.984, p<0.0001; acetabulum ≥0.956, p<0.0001; each subregion ≥0.837, p<0.005. Repeatability measurements were root mean square CV% for global 3%, femoral head 3.6%; acetabulum 5.6%. In a study by Mechlenburg et al, 3 different methods of quantifying cartilage thickness measures from MRI were compared in subjects with hip dysplasia (111). The authors concluded that a radial acquisition might be the optimal one. As the cartilage surface was intersected perpendicular so the partial volume effect was avoided.
Responsiveness
Both HIMRISS and HOAMS showed moderate to high responsiveness and discrimination for synovitis and effusion (110). Jaremko et al performed a recent systematic review where the authors evaluated relevant features to be assessed including the ones associated with inflammation (BMLs, synovitis/effusion), structural damage (cartilage and labrum damage, subchondral cysts) and deformities (dysplasia, CAM- or Pincer-impingement)(84). However, the sole parameter of validation for HOAMS and HIMRISS was assessment of reliability, since neither one of these systems has thus far been tested for responsiveness or validity regarding longitudinal clinical outcomes. There is a severe lack of data of responsiveness of quantitative measures of hip OA for clinical trials.
Validity
The HOAMS scoring system (69) showed a non-significant trend associated with hip pain. Compared to X-ray, HOAMS showed severe cartilage damage (>3), P<0.001 for trend, also BMLs, cysts, synovitis (all significant). When applying both HIMRISS and HOAMS, a recent study demonstrated significant associations between BMLs or synovitis scores with Western Ontario and McMaster osteoarthritis index (WOMAC) pain scores at baseline (110).
SHOMRI BML pattern and subchondral cysts scores showed a significant correlation with all three hip disability and osteoarthritis outcome score (HOOS) subscales (P range <0.001–0.01) (82). Articular cartilage and paralabral cyst scores correlated with symptoms and activities of daily living (ADL) subscales (P range 0.01–0.05). Labrum scores also correlated with the symptom subscale (P= 0.03).
There are no data on correlations with hip symptoms and cartilage thickness. Compared to X-ray, femoral head cartilage volume as measured by MRI was significantly correlated with total hip radiographic JSN (Spearman’s rho = −0.24, P < 0.01), superior JSN (Spearman’s rho = −0.18, P < 0.03), and axial JSN (Spearman’s rho = −0.23, P < 0.01) (28).
Relatively little data exists for use of parameter mapping in articular cartilage in OA. T2, T1rho, and dGEMRIC have all been applied in small studies and shown some promise. There is no data comparing these methods with symptoms. There is some evidence that the dGEMRIC index of the acetabular cartilage may better predict early joint failure than radiographic measures of hip OA (112). dGEMRIC values have been found to be significantly higher in a control group than in a patient group with different hip joint deformities (113). A recent study using dGEMRIC showed that lower dGEMRIC indices (marker for cartilage degeneration) were found at the superoinferior and superior regions of the femoroacetabular joint in patients with CAM-type impingement (compared to controls), and were correlated to beta- but not alpha-angles (92). Another study including patients with hip dysplasia showed that the dGEMRIC indices were globally decreased (in the whole joint) and not only in specific locations, supporting that hip OA in acetabular dysplasia is a biologically event affecting the whole femoroacetabular joint (88). Other interesting studies showed that dGEMRIC was capable in mapping the regions of the femoroacetabular joints affected by early cartilage degeneration (lower indices) in patients with femoroacetabular impingement anatomy (32, 114). To our knowledge, no longitudinal studies of hip OA demonstrated the ability of dGEMRIC indices in predicting cartilage loss or relevant structural deterioration over time.
RECOMMENDATIONS FOR CLINICAL TRIALS – HIP
Introduction
Recommendations for clinical trials in hip imaging (Table 2) will follow closely the recommendations for the knee, hand, and other joints. Differences between joints reflect differences in anatomy and technical factors for modalities such as MRI. Because imaging of the hip joint is not as advanced as that of the knee for MRI, adjustments need to be made in acquisition techniques for the anatomy, thin articular cartilage, and depth of the joint. In general, all trials using hip imaging methods should have a protocol that is tested on volunteers and images should be evaluated prior to implementation.
Radiographic Scores – Semi-quantitative
As detailed above, a variety of semi-quantitative (subjective) radiographic scoring systems exist to evaluate hip OA on x-ray. Most widely used and recommended are KL scores (70) and the OARSI atlas (73). These measures are simple to perform, and given the cost and widespread availability of radiography, are fairly standard in clinical trials. A recent large study of X-ray grading in hip OA concludes that although KL, OARSI stages and categorization of JSW all have similar predictive and construct validity, it appears that categorical JSW is more reproducible and more sensitive to change(103).
Radiographic Scores – Quantitative
For quantitative assessment of hip OA on radiography, standing JSW measurements are recommended. The JSW is assessed on a single yearly standing AP plain radiograph of the pelvis or individual hip with feet internally rotated 15–20 degrees (12).
MRI – Semi-quantitative scores
For MRI, use of a semi-quantitative scoring system such as HOAMS, SHOMRI, or HIMRISS is recommended. Use of semi-quantitative scoring systems has been very successful in the knee in evaluating disease progression, but has been used in a rather limited fashion in the hip. Technical factors of hip MRI such as image resolution and SNR (see above) need to be paid attention to so as to have sufficient image quality for accurate scoring.
MRI - Quantitative measurements
Use of quantitative MR endpoints is recommended as a secondary aim for trials at this point. Volumetric assessment of articular cartilage has been shown to correlate with x-ray grade of disease(28). Cartilage volume at thickness measurement needs improved CV for widespread use. Assessment of cartilage composition parameters such as T1 rho and T2 relaxation times have been studies in preliminary small cohorts, but limited information on the relationship to OA progression in the hip exists (41, 44). dGEMRIC is the best-studied approach to cartilage composition analysis in the hip to date(32, 88, 94, 95). BMLs can be measured for size and T2 relaxation time, but limited data also exists here (85). Assessment of hip joint synovitis has been done with contrast-enhanced MRI but not in the setting of OA (115).
Proven Reliability in OA Clinical Trials
Unfortunately limited data exists on reliability of imaging in OA trials particularly on MRI. Unlike the knee joint, where there are multiple large studies that have relied on MRI, the hip has not been well studied. Certainly radiography is recommended, as would be MRI with semi-quantitative scoring. Assessment with quantitative MRI has been limited and for some methodologies requires more research into the sensitivity and specificity of these methods, as well as improved reproducibility.
RECOMMENDATIONS FOR RESEARCH – HIP
Recommendations for research (Table 3) are included in detail below. These have been divided into acquisition, processing, and the need for more studies in hip osteoarthritis with imaging.
Image acquisition - MRI
Imaging of hip OA is an active area of research. In particular, MRI will benefit from more work in improved technical factors. Dedicated, multi-channel hip coils will improve SNR from the hip joint and improve assessment of cartilage. Higher field MRI systems can also improve SNR. Application of more novel imaging methods to the hip, such as UTE imaging, has the potential to provide more information on early disease progression. The potential value of additional compositional techniques for hip joint cartilage assessment such as T2*, diffusion, sodium or GAG-CEST at different field strengths and role in prediction of later outcomes needs to be explored further.
Post processing software development
Software that allows calculation of thickness maps in the hip, bone marrow lesion volume, measurement of relaxation parameters such as T2, T1rho, etc. will be helpful to further enhance quantitative measurements. Many packages exist for this type of analysis for knee MRI but have not been validated or explored in the hip. Development of software for analysis needs to be done in tissues other than cartilage: bone deformation, BMLs, synovitis, labral deformation and relaxation properties, etc. Fully automated software development will also help in increasing sample size; the more automated these approaches can be the better for large trials.
More studies of hip OA with imaging are needed
In general, more studies of hip OA using imaging are needed. Radiography is fairly well studied, with the known limitations of lack of soft tissue discrimination and low sensitivity to disease progression. Limited studies of CT and US have been performed, and assessment of potential of these to contribute to trials is lacking. Ultrasound, for example, may contribute to inflammation assessment in the future, and requires further study. Standardization and validation of MRI acquisition methods would be helpful. To date, limited information is available on the MRI reproducibility and sensitivity to change, both in semi-quantitative and quantitative assessments. Studies of early disease with an increased sample size are badly needed.
For imaging in clinical trials, validation of reliability and precision are needed. Development of predictive models would be helpful. Comparison of OA data with age-matched normal and radiographic data are critical steps to determine the sensitivity of the measures. Evaluation of the predictive power of imaging methods such as MRI in hip OA needs to be done, particularly with respect of the ability to assess risk of THR and other proven clinical outcome measures. Correlation of hip imaging results, particularly MRI, with patient symptoms such as pain, is lacking. Statistical shape modeling has shown a predictive ability to predict OA deterioration, but further evaluation of the applicability to clinical trials is required.
SUMMARY AND CONCLUSION
Radiographic measurement of JSW and semi-quantitative radiographic measures in hip OA have been widely studied and validated. CT and ultrasound have potential applications in bony anatomy and inflammation, respectively. MRI has been less studied in the hip than the knee, and need further longitudinal assessment with respect to acquisition techniques validation, features to assess, and scores to be used. Clinical trials of the hip joint can certainly benefit from the addition of imaging such as radiography for semi-quantitative scoring and assessment of JSW. Other than radiography, MRI has the most potential for clinical trials.
MRI has been shown to be potentially useful, and two semi-quantitative scoring systems are available. Assessment of synovitis and inflammation can be performed with MRI. Quantitative assessment of joint tissues with MRI such as cartilage thickness or cartilage composition needs further study and validation, but may be useful for secondary endpoints. Because of the location and anatomy of the hip joint, MRI requires more attention to technical factors for adequate image quality. Imaging should be performed at 3T with dedicated coils when possible. More studies on MRI are needed to validate quantitative techniques and advance the state-of-the-art imaging hip OA.
Acknowledgments
Dr. Gold is supported by an NIH K24 Grant (AR062068) and RO1 (EB002524).
We acknowledge the support and contribution of the entire OARSI Imaging Clinical Trials Recommendations working group which includes: Ali Guermazi, Bernard Dardzinski, Charles Peterfy, Colin Miller, Diann Stern, Emmanuel Maheu, Felix Eckstein, Flavia Cicuttini, Frank Roemer, Garry Gold, Hollis Potter, Ida Haugen, Jean-Pierre Pelletier, Jean-Pierre Raynauld, Jeffrey Duryea, Joanne Jordan, Johanne Martel-Pelletier, Kim Bennell, Lee Simon, Marc Hochberg, Margreet Kloppenburg, Michael Nevitt, Michel Crema, Mike Bowes, Nancy Lane, Philip Conaghan, Richard Kijowski, Roy Altman, Saara Totterman, Siegfried Trattnig, Souhil Zaim, Thomas Link, Thomas Schnitzer, Tim McAlindon, Tim Mosher, Yves Henrotin, Frank Roemer, Goetz Welsch, Graeme Jones, Jordan Renner, Marie-Pierre Hellio Le Graverand and Nigel Arden. We also acknowledge the administrative support of Diann Stern.
Footnotes
Publisher's Disclaimer: This is a PDF file of an unedited manuscript that has been accepted for publication. As a service to our customers we are providing this early version of the manuscript. The manuscript will undergo copyediting, typesetting, and review of the resulting proof before it is published in its final citable form. Please note that during the production process errors may be discovered which could affect the content, and all legal disclaimers that apply to the journal pertain.
Disclosure
The comments and editorial expressed herein represent those of the author/s and do not reflect those of any official scientific role or institution that the author/s may be hold or be affiliated with. The corresponding author had full access to all the data in the study and had final responsibility for the decision to submit for publication.
- Garry E. Gold receives honoraria as a consultant from Boston Scientific Inc. Has a grant from GE Healthcare for improved MR Systems and two from the NIH for advanced MRI of Osteoarthritis.
- Flavia Cicuttini - Receives honoraria from Jansen. Has grants from the NHMRC for Statin RCT, Zolendronic Acid RCT and ACL study. Holds a volunteered paid position in Repatriation Medical Authority as a Medical Officer and as an Associate Editor in the BMC Musculoskeletal Journal, ART Journal.
- Michel D. Crema – has shares in Boston Imaging Core Lab, LLC a company providing image assessment services to academia and the pharmaceutical and medical device industry.
- Jeffrey Duryea - has a grant from NIH/NIAMS for a Quantitative MRI analysis method for longitudinal assessment of knee OA.
- Felix Eckstein receives honoraria from Mariel Therpeutics, MerckSerono, and Medtronic. Is CEO and co-owner of Chondrometrics Gmbh, a quantitative image analysis company and is involved in, clinical trials including FGF 18 from MerckSerono. Holds a voluntary unpaid position in Annals of Anatomy, Cell Tissue Organs as an associate editor and in Osteoarthritis & Cartilage as part of the editorial board.
- Ali Guermazi receives honoraria from Genzyme, TissueGene, OrthoTrophix and Merck Serono. He has shares in Boston Imaging Core Lab, LLC. Deputy Editor of Radiology.
- Richard Kijowski has grants from the National Institute of Health for NIAMS/Rapid MRI for Assessing Joint Degeneration, for the NAIMS/Cartilage Contact and for Early degeneration after ACL Injury.
- Thomas M. Link receives honoraria from Springer. He has grants from the National Institutes of Health (NIAMS and NIBIB) and General Electric for the MAVRIC protocol and Insightec Exablate protocols. Holds a paid position in Current Radiology Reports as Editor-in-Chief. He is on the editorial boards of Osteoarthritis and Cartilage, Radiology, AJR and Skeletal Radiology. He is also section editor for European Radiology.
- Emanuelle Maheu - On the Board of Bioventus. Consultant for Rottapharm s.a., Pierre Fabre Labs – France, and Expanscience Labs – France. Grants from the Institut de Recherche International Servier
- Colin G. Miller- Senior vice president at Bioclinica.
- Johanne Martel-Pelletier & Jean-Pierre Pelletier – receive honoraria from ArthroLab/ArthroVision, Bioiberica, Elanco, Ferring, Merck, Pfizer, Servier, TRB Chemedica. Have grants from The Arthritis Society, Canadian Institutes of Health Research (CIHR). Has investment in non-medical industry at ArthroLab/ArthroVision and is a Shareholder. Holds a volunteered paid position at the ESCEO13-IOF European Congress on Osteoporosis and Osteoarthritis.
- Charles Peterfy – has shares in Spire Sciences, inc., which provides Image analysis for clinical trials to multiple pharmaceutical and medical device companies. He holds a volunteered paid position in The International Society for Musculoskeletal Imaging in Rheumatology as treasurer.
- Hollis Potter – receives grant support from NIH and institutional research support from GE Healthcare.
- Frank Roemer – has shares in Boston Imaging Core Lab, LLC, a company providing image assessment services to academia and the pharmaceutical and medical device industry. Associate Editor for Osteoarthritis and Cartilage.
- David Hunter has royalties from DJO for a patent granted for a patellofemoral buttress. Has grants from the NIH, Australian Research Council and NHMRC. Associate Editor for Osteoarthritis and Cartilage.
Author contributions
All authors were involved in collecting data, reviewing the literature and drafting the article or revising it critically for important intellectual content, and all authors approved the final version to be published.
BIBLIOGRAPHY
- 1.Dieppe PA. Recommended methodology for assessing the progression of osteoarthritis of the hip and knee joints. Osteoarthritis and cartilage / OARS, Osteoarthritis Research Society. 1995;3(2):73–77. doi: 10.1016/s1063-4584(05)80040-8. [DOI] [PubMed] [Google Scholar]
- 2.Witte H, Eckstein F, Recknagel S. A calculation of the forces acting on the human acetabulum during walking. Based On in vivo force measurements, kinematic analysis and morphometry. Acta anatomica. 1997;160(4):269–280. doi: 10.1159/000148021. [DOI] [PubMed] [Google Scholar]
- 3.von Eisenhart R, Adam C, Steinlechner M, Muller-Gerbl M, Eckstein F. Quantitative determination of joint incongruity and pressure distribution during simulated gait and cartilage thickness in the human hip joint. Journal of orthopaedic research : official publication of the Orthopaedic Research Society. 1999;17(4):532–539. doi: 10.1002/jor.1100170411. [DOI] [PubMed] [Google Scholar]
- 4.Lohe F, Eckstein F, Sauer T, Putz R. Structure, strain and function of the transverse acetabular ligament. Acta anatomica. 1996;157(4):315–323. doi: 10.1159/000147894. [DOI] [PubMed] [Google Scholar]
- 5.Lequesne M, Djian A. [The false profile of the hip. Technic and value in coxopathy] Journal de radiologie, d'electrologie, et de medecine nucleaire. 1968;49(10):776–778. [PubMed] [Google Scholar]
- 6.Marsh M, Souza RB, Wyman BT, Hellio Le Graverand MP, Subburaj K, Link TM, et al. Differences between X-ray and MRI-determined knee cartilage thickness in weight-bearing and non-weight-bearing conditions. Osteoarthritis and cartilage / OARS, Osteoarthritis Research Society. 2013;21(12):1876–1885. doi: 10.1016/j.joca.2013.09.006. [DOI] [PubMed] [Google Scholar]
- 7.Auleley GR, Duche A, Drape JL, Dougados M, Ravaud P. Measurement of joint space width in hip osteoarthritis: influence of joint positioning and radiographic procedure. Rheumatology. 2001;40(4):414–419. doi: 10.1093/rheumatology/40.4.414. [DOI] [PubMed] [Google Scholar]
- 8.Conrozier T, Lequesne MG, Tron AM, Mathieu P, Berdah L, Vignon E. The effects of position on the radiographic joint space in osteoarthritis of the hip. Osteoarthritis and cartilage / OARS, Osteoarthritis Research Society. 1997;5(1):17–22. doi: 10.1016/s1063-4584(97)80028-3. [DOI] [PubMed] [Google Scholar]
- 9.Conrozier T, Brandt K, Piperno M, Mathieu P, Merle-Vincent F, Vignon E. Reproducibility and sensitivity to change of a new method of computer measurement of joint space width in hip osteoarthritis. Performance of three radiographic views obtained at a 3-year interval. Osteoarthritis and cartilage / OARS, Osteoarthritis Research Society. 2009;17(7):864–870. doi: 10.1016/j.joca.2008.12.003. [DOI] [PubMed] [Google Scholar]
- 10.Okano K, Kawahara N, Chiba K, Shindo H. Radiographic joint space width in patients with Crowe Type-I dysplastic hips. Clinical orthopaedics and related research. 2008;466(9):2209–2216. doi: 10.1007/s11999-008-0372-7. [DOI] [PMC free article] [PubMed] [Google Scholar]
- 11.Reijman M, Hazes JM, Pols HA, Bernsen RM, Koes BW, Bierma-Zeinstra SM. Role of radiography in predicting progression of osteoarthritis of the hip: prospective cohort study. Bmj. 2005;330(7501):1183. doi: 10.1136/bmj.38442.457488.8F. [DOI] [PMC free article] [PubMed] [Google Scholar]
- 12.Altman RD, Bloch DA, Dougados M, Hochberg M, Lohmander S, Pavelka K, et al. Measurement of structural progression in osteoarthritis of the hip: the Barcelona consensus group. Osteoarthritis and cartilage / OARS, Osteoarthritis Research Society. 2004;12(7):515–524. doi: 10.1016/j.joca.2004.04.004. [DOI] [PubMed] [Google Scholar]
- 13.Chu Miow Lin D, Reichmann WM, Gossec L, Losina E, Conaghan PG, Maillefert JF. Validity and responsiveness of radiographic joint space width metric measurement in hip osteoarthritis: a systematic review. Osteoarthritis and cartilage / OARS, Osteoarthritis Research Society. 2011;19(5):543–549. doi: 10.1016/j.joca.2010.12.014. [DOI] [PMC free article] [PubMed] [Google Scholar]
- 14.Goker B, Sancak A, Haznedaroglu S, Arac M, Block JA. The effects of minor hip flexion, abduction or adduction and x-ray beam angle on the radiographic joint space width of the hip. Osteoarthritis and cartilage / OARS, Osteoarthritis Research Society. 2005;13(5):379–386. doi: 10.1016/j.joca.2005.01.004. [DOI] [PubMed] [Google Scholar]
- 15.Nishii T, Shiomi T, Sakai T, Takao M, Yoshikawa H, Sugano N. Computational measurement of joint space width and structural parameters in normal hips. Archives of orthopaedic and trauma surgery. 2012;132(5):591–598. doi: 10.1007/s00402-012-1463-1. [DOI] [PubMed] [Google Scholar]
- 16.Maheu E, Cadet C, Marty M, Dougados M, Ghabri S, Kerloch I, et al. Reproducibility and sensitivity to change of various methods to measure joint space width in osteoarthritis of the hip: a double reading of three different radiographic views taken with a three-year interval. Arthritis research & therapy. 2005;7(6):R1375–R1385. doi: 10.1186/ar1831. [DOI] [PMC free article] [PubMed] [Google Scholar]
- 17.Chang CY, Huang AJ. MR imaging of normal hip anatomy. Magnetic resonance imaging clinics of North America. 2013;21(1):1–19. doi: 10.1016/j.mric.2012.08.006. [DOI] [PubMed] [Google Scholar]
- 18.Link TM. MR imaging in osteoarthritis: hardware, coils, and sequences. Magnetic resonance imaging clinics of North America. 2010;18(1):95–110. doi: 10.1016/j.mric.2009.09.007. [DOI] [PubMed] [Google Scholar]
- 19.Sutter R, Dietrich TJ, Zingg PO, Pfirrmann CW. How useful is the alpha angle for discriminating between symptomatic patients with cam-type femoroacetabular impingement and asymptomatic volunteers? Radiology. 2012;264(2):514–521. doi: 10.1148/radiol.12112479. [DOI] [PubMed] [Google Scholar]
- 20.Subburaj K, Valentinitsch A, Dillon AB, Joseph GB, Li X, Link TM, et al. Regional variations in MR relaxation of hip joint cartilage in subjects with and without femoralacetabular impingement. Magnetic resonance imaging. 2013;31(7):1129–1136. doi: 10.1016/j.mri.2013.01.009. [DOI] [PMC free article] [PubMed] [Google Scholar]
- 21.Li W, Abram F, Beaudoin G, Berthiaume MJ, Pelletier JP, Martel-Pelletier J. Human hip joint cartilage: MRI quantitative thickness and volume measurements discriminating acetabulum and femoral head. IEEE transactions on bio-medical engineering. 2008;55(12):2731–2740. doi: 10.1109/TBME.2008.925679. [DOI] [PubMed] [Google Scholar]
- 22.Kijowski R, Gold GE. Routine 3D magnetic resonance imaging of joints. Journal of magnetic resonance imaging : JMRI. 2011;33(4):758–771. doi: 10.1002/jmri.22342. [DOI] [PMC free article] [PubMed] [Google Scholar]
- 23.Mintz DN, Hooper T, Connell D, Buly R, Padgett DE, Potter HG. Magnetic resonance imaging of the hip: detection of labral and chondral abnormalities using noncontrast imaging. Arthroscopy : the journal of arthroscopic & related surgery : official publication of the Arthroscopy Association of North America and the International Arthroscopy Association. 2005;21(4):385–393. doi: 10.1016/j.arthro.2004.12.011. [DOI] [PubMed] [Google Scholar]
- 24.Mamisch TC, Bittersohl B, Hughes T, Kim YJ, Welsch GH, Dudda M, et al. Magnetic resonance imaging of the hip at 3 Tesla: clinical value in femoroacetabular impingement of the hip and current concepts. Seminars in musculoskeletal radiology. 2008;12(3):212–222. doi: 10.1055/s-0028-1083105. [DOI] [PubMed] [Google Scholar]
- 25.Guenther KP, Tomczak R, Kessler S, Pfeiffer T, Puhl W. Measurement of femoral anteversion by magnetic resonance imaging--evaluation of a new technique in children and adolescents. European journal of radiology. 1995;21(1):47–52. doi: 10.1016/0720-048x(95)00684-i. [DOI] [PubMed] [Google Scholar]
- 26.Potter HG, Schachar J. High resolution noncontrast MRI of the hip. Journal of magnetic resonance imaging : JMRI. 2010;31(2):268–278. doi: 10.1002/jmri.22025. [DOI] [PubMed] [Google Scholar]
- 27.Del Grande F, Santini F, Herzka DA, Aro MR, Dean CW, Gold GE, et al. Fat-suppression techniques for 3-T MR imaging of the musculoskeletal system. Radiographics : a review publication of the Radiological Society of North America, Inc. 2014;34(1):217–233. doi: 10.1148/rg.341135130. [DOI] [PMC free article] [PubMed] [Google Scholar]
- 28.Zhai G, Cicuttini F, Srikanth V, Cooley H, Ding C, Jones G. Factors associated with hip cartilage volume measured by magnetic resonance imaging: the Tasmanian Older Adult Cohort Study. Arthritis & Rheumatism. 2005;52(4):1069–1076. doi: 10.1002/art.20964. [DOI] [PubMed] [Google Scholar]
- 29.Carballido-Gamio J, Link TM, Li X, Han ET, Krug R, Ries MD, et al. Feasibility and reproducibility of relaxometry, morphometric, and geometrical measurements of the hip joint with magnetic resonance imaging at 3T. Journal of magnetic resonance imaging : JMRI. 2008;28(1):227–235. doi: 10.1002/jmri.21411. [DOI] [PubMed] [Google Scholar]
- 30.Pfirrmann CW, Duc SR, Zanetti M, Dora C, Hodler J. MR arthrography of acetabular cartilage delamination in femoroacetabular cam impingement. Radiology. 2008;249(1):236–241. doi: 10.1148/radiol.2491080093. [DOI] [PubMed] [Google Scholar]
- 31.Lattanzi R, Petchprapa C, Ascani D, Babb JS, Chu D, Davidovitch RI, et al. Detection of cartilage damage in femoroacetabular impingement with standardized dGEMRIC at 3 T. Osteoarthritis and cartilage / OARS, Osteoarthritis Research Society. 2014 doi: 10.1016/j.joca.2013.12.022. [DOI] [PubMed] [Google Scholar]
- 32.Mamisch TC, Kain MS, Bittersohl B, Apprich S, Werlen S, Beck M, et al. Delayed gadolinium-enhanced magnetic resonance imaging of cartilage (dGEMRIC) in Femoacetabular impingement. Journal of orthopaedic research : official publication of the Orthopaedic Research Society. 2011;29(9):1305–1311. doi: 10.1002/jor.21371. [DOI] [PubMed] [Google Scholar]
- 33.Nishii T, Tanaka H, Sugano N, Sakai T, Hananouchi T, Yoshikawa H. Evaluation of cartilage matrix disorders by T2 relaxation time in patients with hip dysplasia. Osteoarthritis and cartilage / OARS, Osteoarthritis Research Society. 2008;16(2):227–233. doi: 10.1016/j.joca.2007.06.003. [DOI] [PubMed] [Google Scholar]
- 34.Welsch GH, Mamisch TC, Hughes T, Zilkens C, Quirbach S, Scheffler K, et al. In vivo biochemical 7.0 Tesla magnetic resonance: preliminary results of dGEMRIC, zonal T2, and T2* mapping of articular cartilage. Investigative radiology. 2008;43(9):619–626. doi: 10.1097/RLI.0b013e31817e9122. [DOI] [PubMed] [Google Scholar]
- 35.Rakhra KS, Lattanzio PJ, Cardenas-Blanco A, Cameron IG, Beaule PE. Can T1-rho MRI detect acetabular cartilage degeneration in femoroacetabular impingement?: a pilot study. The Journal of bone and joint surgery British volume. 2012;94(9):1187–1192. doi: 10.1302/0301-620X.94B9.29981. [DOI] [PubMed] [Google Scholar]
- 36.Kurkijarvi JE, Nissi MJ, Kiviranta I, Jurvelin JS, Nieminen MT. Delayed gadolinium-enhanced MRI of cartilage (dGEMRIC) and T2 characteristics of human knee articular cartilage: topographical variation and relationships to mechanical properties. Magn Reson Med. 2004;52(1):41–46. doi: 10.1002/mrm.20104. [DOI] [PubMed] [Google Scholar]
- 37.Nissi MJ, Rieppo J, Toyras J, Laasanen MS, Kiviranta I, Nieminen MT, et al. Estimation of mechanical properties of articular cartilage with MRI - dGEMRIC, T2 and T1 imaging in different species with variable stages of maturation. Osteoarthritis and cartilage / OARS, Osteoarthritis Research Society. 2007;15(10):1141–1148. doi: 10.1016/j.joca.2007.03.018. [DOI] [PubMed] [Google Scholar]
- 38.Samosky JT, Burstein D, Eric Grimson W, Howe R, Martin S, Gray ML. Spatially-localized correlation of dGEMRIC-measured GAG distribution and mechanical stiffness in the human tibial plateau. Journal of orthopaedic research : official publication of the Orthopaedic Research Society. 2005;23(1):93–101. doi: 10.1016/j.orthres.2004.05.008. [DOI] [PubMed] [Google Scholar]
- 39.Nieminen MT, Rieppo J, Toyras J, Hakumaki JM, Silvennoinen J, Hyttinen MM, et al. T2 relaxation reveals spatial collagen architecture in articular cartilage: a comparative quantitative MRI and polarized light microscopic study. Magn Reson Med. 2001;46(3):487–493. doi: 10.1002/mrm.1218. [DOI] [PubMed] [Google Scholar]
- 40.Wheaton AJ, Dodge GR, Elliott DM, Nicoll SB, Reddy R. Quantification of cartilage biomechanical and biochemical properties via T1rho magnetic resonance imaging. Magn Reson Med. 2005;54(5):1087–1093. doi: 10.1002/mrm.20678. [DOI] [PubMed] [Google Scholar]
- 41.Regatte RR, Akella SV, Borthakur A, Kneeland JB, Reddy R. Proteoglycan depletion-induced changes in transverse relaxation maps of cartilage: comparison of T2 and T1rho. Academic radiology. 2002;9(12):1388–1394. doi: 10.1016/s1076-6332(03)80666-9. [DOI] [PubMed] [Google Scholar]
- 42.Wheaton AJ, Dodge GR, Borthakur A, Kneeland JB, Schumacher HR, Reddy R. Detection of changes in articular cartilage proteoglycan by T(1rho) magnetic resonance imaging. Journal of orthopaedic research : official publication of the Orthopaedic Research Society. 2005;23(1):102–108. doi: 10.1016/j.orthres.2004.06.015. [DOI] [PMC free article] [PubMed] [Google Scholar]
- 43.Duvvuri U, Reddy R, Patel SD, Kaufman JH, Kneeland JB, Leigh JS. T1rho-relaxation in articular cartilage: effects of enzymatic degradation. Magn Reson Med. 1997;38(6):863–867. doi: 10.1002/mrm.1910380602. [DOI] [PubMed] [Google Scholar]
- 44.Menezes NM, Gray ML, Hartke JR, Burstein D. T2 and T1rho MRI in articular cartilage systems. Magn Reson Med. 2004;51(3):503–509. doi: 10.1002/mrm.10710. [DOI] [PubMed] [Google Scholar]
- 45.Keenan KE, Besier TF, Pauly JM, Han E, Rosenberg J, Smith RL, et al. Prediction of glycosaminoglycan content in human cartilage by age, T1rho and T2 MRI. Osteoarthritis and cartilage / OARS, Osteoarthritis Research Society. 2011;19(2):171–179. doi: 10.1016/j.joca.2010.11.009. [DOI] [PMC free article] [PubMed] [Google Scholar]
- 46.Souza RB, Baum T, Wu S, Feeley BT, Kadel N, Li X, et al. Effects of unloading on knee articular cartilage T1rho and T2 magnetic resonance imaging relaxation times: a case series. The Journal of orthopaedic and sports physical therapy. 2012;42(6):511–520. doi: 10.2519/jospt.2012.3975. [DOI] [PMC free article] [PubMed] [Google Scholar]
- 47.Li X, Cheng J, Lin K, Saadat E, Bolbos RI, Jobke B, et al. Quantitative MRI using T1rho and T2 in human osteoarthritic cartilage specimens: correlation with biochemical measurements and histology. Magnetic resonance imaging. 2011;29(3):324–334. doi: 10.1016/j.mri.2010.09.004. [DOI] [PMC free article] [PubMed] [Google Scholar]
- 48.Xia Y. Magic-angle effect in magnetic resonance imaging of articular cartilage: a review. Investigative radiology. 2000;35(10):602–621. doi: 10.1097/00004424-200010000-00007. [DOI] [PubMed] [Google Scholar]
- 49.Balamoody S, Williams TG, Waterton JC, Bowes M, Hodgson R, Taylor CJ, et al. Comparison of 3T MR scanners in regional cartilage-thickness analysis in osteoarthritis: a cross-sectional multicenter, multivendor study. Arthritis research & therapy. 2010;12(5):R202. doi: 10.1186/ar3174. [DOI] [PMC free article] [PubMed] [Google Scholar]
- 50.Chen CA, Kijowski R, Shapiro LM, Tuite MJ, Davis KW, Klaers JL, et al. Cartilage morphology at 3.0T: assessment of three-dimensional magnetic resonance imaging techniques. Journal of magnetic resonance imaging : JMRI. 2010;32(1):173–183. doi: 10.1002/jmri.22213. [DOI] [PMC free article] [PubMed] [Google Scholar]
- 51.Jaremko JL, Cheng RW, Lambert RG, Habib AF, Ronsky JL. Reliability of an efficient MRI-based method for estimation of knee cartilage volume using surface registration. Osteoarthritis and cartilage / OARS, Osteoarthritis Research Society. 2006;14(9):914–922. doi: 10.1016/j.joca.2006.03.004. [DOI] [PubMed] [Google Scholar]
- 52.McMahon CJ, Madhuranthakam AJ, Wu JS, Yablon CM, Wei JL, Rofsky NM, et al. High-resolution proton density weighted three-dimensional fast spin echo (3D–FSE) of the knee with IDEAL at 1.5 Tesla: comparison with 3D–FSE and 2D–FSE--initial experience. Journal of magnetic resonance imaging : JMRI. 2012;35(2):361–369. doi: 10.1002/jmri.22829. [DOI] [PubMed] [Google Scholar]
- 53.Anderson SW, Sakai O, Soto JA, Jara H. Improved T2 mapping accuracy with dual-echo turbo spin echo: effect of phase encoding profile orders. Magn Reson Med. 2013;69(1):137–143. doi: 10.1002/mrm.24213. [DOI] [PubMed] [Google Scholar]
- 54.Mosher TJ, Zhang Z, Reddy R, Boudhar S, Milestone BN, Morrison WB, et al. Knee articular cartilage damage in osteoarthritis: analysis of MR image biomarker reproducibility in ACRIN-PA 4001 multicenter trial. Radiology. 2011;258(3):832–842. doi: 10.1148/radiol.10101174. [DOI] [PMC free article] [PubMed] [Google Scholar]
- 55.Maier CF, Tan SG, Hariharan H, Potter HG. T2 quantitation of articular cartilage at 1.5 T. Journal of magnetic resonance imaging : JMRI. 2003;17(3):358–364. doi: 10.1002/jmri.10263. [DOI] [PubMed] [Google Scholar]
- 56.Balamoody S, Williams TG, Wolstenholme C, Waterton JC, Bowes M, Hodgson R, et al. Magnetic resonance transverse relaxation time T2 of knee cartilage in osteoarthritis at 3-T: a cross-sectional multicentre, multivendor reproducibility study. Skeletal radiology. 2013;42(4):511–520. doi: 10.1007/s00256-012-1511-5. [DOI] [PubMed] [Google Scholar]
- 57.Ellermann J, Ziegler C, Nissi MJ, Goebel R, Hughes J, Benson M, et al. Acetabular cartilage assessment in patients with femoroacetabular impingement by using T2* mapping with arthroscopic verification. Radiology. 2014;271(2):512–523. doi: 10.1148/radiol.13131837. [DOI] [PubMed] [Google Scholar]
- 58.Deoni SC. Correction of main and transmit magnetic field (B0 and B1) inhomogeneity effects in multicomponent-driven equilibrium single-pulse observation of T1 and T2. Magn Reson Med. 2011;65(4):1021–1035. doi: 10.1002/mrm.22685. [DOI] [PMC free article] [PubMed] [Google Scholar]
- 59.Li X, Benjamin Ma C, Link TM, Castillo DD, Blumenkrantz G, Lozano J, et al. In vivo T(1rho) and T(2) mapping of articular cartilage in osteoarthritis of the knee using 3 T MRI. Osteoarthritis and cartilage / OARS, Osteoarthritis Research Society. 2007;15(7):789–797. doi: 10.1016/j.joca.2007.01.011. [DOI] [PMC free article] [PubMed] [Google Scholar]
- 60.Food and Drug Administration. Draft Guidance for Industry on Standards for Clinical Trial Imaging Endpoints. Services DoHaH, editor. 2011 [Google Scholar]
- 61.Eckstein F, Kunz M, Hudelmaier M, Jackson R, Yu J, Eaton CB, et al. Impact of coil design on the contrast-to-noise ratio, precision, and consistency of quantitative cartilage morphometry at 3 Tesla: a pilot study for the osteoarthritis initiative. Magn Reson Med. 2007;57(2):448–454. doi: 10.1002/mrm.21146. [DOI] [PubMed] [Google Scholar]
- 62.Ganz R, Parvizi J, Beck M, Leunig M, Notzli H, Siebenrock KA. Femoroacetabular impingement: a cause for osteoarthritis of the hip. Clinical orthopaedics and related research. 2003;(417):112–120. doi: 10.1097/01.blo.0000096804.78689.c2. [DOI] [PubMed] [Google Scholar]
- 63.Kassarjian A, Yoon LS, Belzile E, Connolly SA, Millis MB, Palmer WE. Triad of MR arthrographic findings in patients with cam-type femoroacetabular impingement. Radiology. 2005;236(2):588–592. doi: 10.1148/radiol.2362041987. [DOI] [PubMed] [Google Scholar]
- 64.Pfirrmann CW, Mengiardi B, Dora C, Kalberer F, Zanetti M, Hodler J. Cam and pincer femoroacetabular impingement: characteristic MR arthrographic findings in 50 patients. Radiology. 2006;240(3):778–785. doi: 10.1148/radiol.2403050767. [DOI] [PubMed] [Google Scholar]
- 65.Bittersohl B, Hosalkar HS, Hughes T, Kim YJ, Werlen S, Siebenrock KA, et al. Feasibility of T2* mapping for the evaluation of hip joint cartilage at 1.5T using a three-dimensional (3D), gradient-echo (GRE) sequence: a prospective study. Magn Reson Med. 2009;62(4):896–901. doi: 10.1002/mrm.22096. [DOI] [PubMed] [Google Scholar]
- 66.Kim YJ, Jaramillo D, Millis MB, Gray ML, Burstein D. Assessment of early osteoarthritis in hip dysplasia with delayed gadolinium-enhanced magnetic resonance imaging of cartilage. J Bone Joint Surg Am. 2003;85-A(10):1987–1992. doi: 10.2106/00004623-200310000-00019. [DOI] [PubMed] [Google Scholar]
- 67.Yoon LS, Palmer WE, Kassarjian A. Evaluation of radial-sequence imaging in detecting acetabular labral tears at hip MR arthrography. Skeletal radiology. 2007;36(11):1029–1033. doi: 10.1007/s00256-007-0363-x. [DOI] [PubMed] [Google Scholar]
- 68.Mamisch TC, Zilkens C, Siebenrock KA, Bittersohl B, Kim YJ, Werlen S. MRI of hip osteoarthritis and implications for surgery. Magnetic resonance imaging clinics of North America. 2010;18(1):111–120. doi: 10.1016/j.mric.2009.09.008. [DOI] [PubMed] [Google Scholar]
- 69.Roemer FW, Hunter DJ, Winterstein A, Li L, Kim YJ, Cibere J, et al. Hip Osteoarthritis MRI Scoring System (HOAMS): reliability and associations with radiographic and clinical findings. Osteoarthritis and cartilage / OARS, Osteoarthritis Research Society. 2011;19(8):946–962. doi: 10.1016/j.joca.2011.04.003. [DOI] [PubMed] [Google Scholar]
- 70.Kellgren J, Jeffrey M, Ball J. The epidemiology of chronic rheumatism. Atlas of standard radiographs of arthritis. Oxford, UK: Blackwell Scientific Publications; 1963. [Google Scholar]
- 71.Kellgren JH, Lawrence JS. Radiological assessment of osteo-arthrosis. Ann Rheum Dis. 1957;16(4):494–502. doi: 10.1136/ard.16.4.494. [DOI] [PMC free article] [PubMed] [Google Scholar]
- 72.Croft P, Cooper C, Wickham C, Coggon D. Defining osteoarthritis of the hip for epidemiologic studies. American journal of epidemiology. 1990;132(3):514–522. doi: 10.1093/oxfordjournals.aje.a115687. [DOI] [PubMed] [Google Scholar]
- 73.Altman RD, Gold GE. Atlas of individual radiographic features in osteoarthritis, revised. Osteoarthritis and cartilage / OARS, Osteoarthritis Research Society. 2007;15(Suppl A):A1–A56. doi: 10.1016/j.joca.2006.11.009. [DOI] [PubMed] [Google Scholar]
- 74.Damen J, Schiphof D, Wolde ST, Cats HA, Bierma-Zeinstra SM, Oei EH. Inter-observer reliability for radiographic assessment of early osteoarthritis features: the CHECK (cohort hip and cohort knee) study. Osteoarthritis and cartilage / OARS, Osteoarthritis Research Society. 2014;22(7):969–974. doi: 10.1016/j.joca.2014.05.007. [DOI] [PubMed] [Google Scholar]
- 75.Terjesen T, Gunderson RB. Radiographic evaluation of osteoarthritis of the hip: an inter-observer study of 61 hips treated for late-detected developmental hip dislocation. Acta orthopaedica. 2012;83(2):185–189. doi: 10.3109/17453674.2012.665331. [DOI] [PMC free article] [PubMed] [Google Scholar]
- 76.Conrozier T, Tron AM, Mathieu P, Vignon E. Quantitative assessment of radiographic normal and osteoarthritic hip joint space. Osteoarthritis and cartilage / OARS, Osteoarthritis Research Society. 1995;3(Suppl A):81–87. [PubMed] [Google Scholar]
- 77.Jacobsen S, Sonne-Holm S, Soballe K, Gebuhr P, Lund B. Hip dysplasia and osteoarthrosis: a survey of 4151 subjects from the Osteoarthrosis Substudy of the Copenhagen City Heart Study. Acta orthopaedica. 2005;76(2):149–158. doi: 10.1080/00016470510030517. [DOI] [PubMed] [Google Scholar]
- 78.Lequesne M. Quantitative measurements of joint space during progression of osteoarthritis: Chondrometry. In: Kuettner KE, Goldberg VM, editors. Osteoarthritic disorders. Rosemont, IL: American Academy of Orthopedic Surgery; 1995. pp. 427–444. In: Kuettner KE, Goldberg V, eds.. Illinois:, 1995:427–44. [Google Scholar]
- 79.Jacobsen S, Romer L, Soballe K. Degeneration in dysplastic hips. A computer tomography study. Skeletal radiology. 2005;34(12):778–784. doi: 10.1007/s00256-005-0019-7. [DOI] [PubMed] [Google Scholar]
- 80.Gregory JS, Waarsing JH, Day J, Pols HA, Reijman M, Weinans H, et al. Early identification of radiographic osteoarthritis of the hip using an active shape model to quantify changes in bone morphometric features: can hip shape tell us anything about the progression of osteoarthritis? Arthritis and rheumatism. 2007;56(11):3634–3643. doi: 10.1002/art.22982. [DOI] [PubMed] [Google Scholar]
- 81.Waarsing JH, Rozendaal RM, Verhaar JA, Bierma-Zeinstra SM, Weinans H. A statistical model of shape and density of the proximal femur in relation to radiological and clinical OA of the hip. Osteoarthritis and cartilage / OARS, Osteoarthritis Research Society. 2010;18(6):787–794. doi: 10.1016/j.joca.2010.02.003. [DOI] [PubMed] [Google Scholar]
- 82.Lee S, Nardo L, Kumar D, Wyatt CR, Souza RB, Lynch J, et al. Scoring Hip Osteoarthritis with MRI (SHOMRI): a Novel Whole Joint Osteoarthritis Evaluation System. Journal of magnetic resonance imaging : JMRI. 2014 doi: 10.1002/jmri.24722. in press. [DOI] [PMC free article] [PubMed] [Google Scholar]
- 83.Lee S, Nardo L, Lai A, Kumar D, Wyatt CR, Souza RB, et al., editors. Scoring hip abnormalities using MR images (SHAMRI): a novel hip whole joint osteoarthritis evaluation system. Vienna, Austria: ECR, Vienna, Austria; 2013. [Google Scholar]
- 84.Jaremko JL, Lambert RG, Zubler V, Weber U, Loeuille D, Roemer FW, et al. Methodologies for Semiquantitative Evaluation of Hip Osteoarthritis by Magnetic Resonance Imaging: Approaches Based on the Whole Organ and Focused on Active Lesions. The Journal of rheumatology. 2013 doi: 10.3899/jrheum.131082. [DOI] [PubMed] [Google Scholar]
- 85.Lambert RG, Maksymowych WP, Gracey D. Evaluation of bone marrow edema with the hip inflammation MRI scoring system (HIMRISS): is it reliable and do scores correlate with clinical status or response to therapy? Ann Rheum Dis. 2011;70(Suppl3):550. [Google Scholar]
- 86.Yamamoto S, Watanabe A, Nakamura J, Ohtori S, Harada Y, Kishida S, et al. Quantitative T2 mapping of femoral head cartilage in systemic lupus erythematosus patients with noncollapsed osteonecrosis of the femoral head associated with corticosteroid therapy. Journal of magnetic resonance imaging : JMRI. 2011;34(5):1151–1158. doi: 10.1002/jmri.22685. [DOI] [PubMed] [Google Scholar]
- 87.Apprich S, Mamisch TC, Welsch GH, Bonel H, Siebenrock KA, Kim YJ, et al. Evaluation of articular cartilage in patients with femoroacetabular impingement (FAI) using T2* mapping at different time points at 3.0 Tesla MRI: a feasibility study. Skeletal radiology. 2012;41(8):987–995. doi: 10.1007/s00256-011-1313-1. [DOI] [PubMed] [Google Scholar]
- 88.Hingsammer A, Chan J, Kalish LA, Mamisch TC, Kim YJ. Is the damage of cartilage a global or localized phenomenon in hip dysplasia, measured by dGEMRIC? Clinical orthopaedics and related research. 2013;471(1):301–307. doi: 10.1007/s11999-012-2633-8. [DOI] [PMC free article] [PubMed] [Google Scholar]
- 89.Zilkens C, Miese F, Bittersohl B, Jager M, Schultz J, Holstein A, et al. Delayed gadolinium-enhanced magnetic resonance imaging of cartilage (dGEMRIC), after slipped capital femoral epiphysis. European journal of radiology. 2011;79(3):400–406. doi: 10.1016/j.ejrad.2010.04.022. [DOI] [PubMed] [Google Scholar]
- 90.Zilkens C, Miese F, Kim YJ, Hosalkar H, Antoch G, Krauspe R, et al. Three-dimensional delayed gadolinium-enhanced magnetic resonance imaging of hip joint cartilage at 3T: a prospective controlled study. European journal of radiology. 2012;81(11):3420–3425. doi: 10.1016/j.ejrad.2012.04.008. [DOI] [PubMed] [Google Scholar]
- 91.Zilkens C, Miese F, Kim YJ, Jager M, Mamisch TC, Hosalkar H, et al. Direct comparison of intra-articular versus intravenous delayed gadolinium-enhanced MRI of hip joint cartilage. Journal of magnetic resonance imaging : JMRI. 2014;39(1):94–102. doi: 10.1002/jmri.24096. [DOI] [PubMed] [Google Scholar]
- 92.Zilkens C, Miese F, Krauspe R, Bittersohl B. Symptomatic femoroacetabular impingement: does the offset decrease correlate with cartilage damage? A pilot study. Clinical orthopaedics and related research. 2013;471(7):2173–2182. doi: 10.1007/s11999-013-2812-2. [DOI] [PMC free article] [PubMed] [Google Scholar]
- 93.Stubendorff JJ, Lammentausta E, Struglics A, Lindberg L, Heinegard D, Dahlberg LE. Is cartilage sGAG content related to early changes in cartilage disease? Implications for interpretation of dGEMRIC. Osteoarthritis and cartilage / OARS, Osteoarthritis Research Society. 2012;20(5):396–404. doi: 10.1016/j.joca.2012.01.015. [DOI] [PubMed] [Google Scholar]
- 94.Bittersohl B, Hosalkar HS, Apprich S, Werlen SA, Siebenrock KA, Mamisch TC. Comparison of pre-operative dGEMRIC imaging with intra-operative findings in femoroacetabular impingement: preliminary findings. Skeletal radiology. 2011;40(5):553–561. doi: 10.1007/s00256-010-1038-6. [DOI] [PubMed] [Google Scholar]
- 95.Bittersohl B, Hosalkar HS, Haamberg T, Kim YJ, Werlen S, Siebenrock KA, et al. Reproducibility of dGEMRIC in assessment of hip joint cartilage: a prospective study. Journal of magnetic resonance imaging : JMRI. 2009;30(1):224–228. doi: 10.1002/jmri.21822. [DOI] [PubMed] [Google Scholar]
- 96.Jessel RH, Zilkens C, Tiderius C, Dudda M, Mamisch TC, Kim YJ. Assessment of osteoarthritis in hips with femoroacetabular impingement using delayed gadolinium enhanced MRI of cartilage. Journal of magnetic resonance imaging : JMRI. 2009;30(5):1110–1115. doi: 10.1002/jmri.21830. [DOI] [PubMed] [Google Scholar]
- 97.Bittersohl B, Hosalkar HS, Kim YJ, Werlen S, Siebenrock KA, Mamisch TC. Delayed gadolinium-enhanced magnetic resonance imaging (dGEMRIC) of hip joint cartilage in femoroacetabular impingement (FAI): Are pre- and postcontrast imaging both necessary? Magn Reson Med. 2009;62(6):1362–1367. doi: 10.1002/mrm.22166. [DOI] [PubMed] [Google Scholar]
- 98.Domayer S, Mamisch T, Kress I, Chan J, Kim Y. Radial dGEMRIC in Developmental Dysplasia of the Hip and in Femoroacetabular Impingement: Preliminary Results. Osteoarthritis and cartilage / OARS, Osteoarthritis Research Society. 2010 doi: 10.1016/j.joca.2010.08.010. [DOI] [PubMed] [Google Scholar]
- 99.Nakamura N, Sugano N, Nishii T, Miki H, Haraguchi K, Hagio K, et al. Scintigraphic image patterns in dysplastic coxarthrosis: evaluation with reference to radiographic findings in 210 hips. Acta orthopaedica Scandinavica. 2003;74(2):159–164. doi: 10.1080/00016470310013888. [DOI] [PubMed] [Google Scholar]
- 100.Kobayashi N, Inaba Y, Tateishi U, Yukizawa Y, Ike H, Inoue T, et al. New application of 18F–fluoride PET for the detection of bone remodeling in early-stage osteoarthritis of the hip. Clinical nuclear medicine. 2013;38(10):e379–e383. doi: 10.1097/RLU.0b013e31828d30c0. [DOI] [PubMed] [Google Scholar]
- 101.Reijman M, Hazes JM, Pols HA, Bernsen RM, Koes BW, Bierma-Zeinstra SM. Validity and reliability of three definitions of hip osteoarthritis: cross sectional and longitudinal approach. Ann Rheum Dis. 2004;63(11):1427–1433. doi: 10.1136/ard.2003.016477. [DOI] [PMC free article] [PubMed] [Google Scholar]
- 102.Jacobsen S, Sonne-Holm S, Soballe K, Gebuhr P, Lund B. The relationship of hip joint space to self reported hip pain. A survey of 4.151 subjects of the Copenhagen City Heart Study: the Osteoarthritis Substudy. Osteoarthritis and cartilage / OARS, Osteoarthritis Research Society. 2004;12(9):692–697. doi: 10.1016/j.joca.2004.05.010. [DOI] [PubMed] [Google Scholar]
- 103.Gossec L, Jordan JM, Lam MA, Fang F, Renner JB, Davis A, et al. Comparative evaluation of three semi-quantitative radiographic grading techniques for hip osteoarthritis in terms of validity and reproducibility in 1404 radiographs: report of the OARSI-OMERACT Task Force. Osteoarthritis and cartilage / OARS, Osteoarthritis Research Society. 2009;17(2):182–187. doi: 10.1016/j.joca.2008.06.009. [DOI] [PubMed] [Google Scholar]
- 104.Dougados M, Gueguen A, Nguyen M, Berdah L, Lequesne M, Mazieres B, et al. Radiological progression of hip osteoarthritis: definition, risk factors and correlations with clinical status. Ann Rheum Dis. 1996;55(6):356–362. doi: 10.1136/ard.55.6.356. [DOI] [PMC free article] [PubMed] [Google Scholar]
- 105.Lane NE, Nevitt MC, Hochberg MC, Hung YY, Palermo L. Progression of radiographic hip osteoarthritis over eight years in a community sample of elderly white women. Arthritis and rheumatism. 2004;50(5):1477–1486. doi: 10.1002/art.20213. [DOI] [PubMed] [Google Scholar]
- 106.Goker B, Doughan AM, Schnitzer TJ, Block JA. Quantification of progressive joint space narrowing in osteoarthritis of the hip: longitudinal analysis of the contralateral hip after total hip arthroplasty. Arthritis and rheumatism. 2000;43(5):988–994. doi: 10.1002/1529-0131(200005)43:5<988::AID-ANR5>3.0.CO;2-X. [DOI] [PubMed] [Google Scholar]
- 107.Maheu E, Cadet C, Marty M, Moyse D, Kerloch I, Coste P, et al. Randomised, controlled trial of avocado-soybean unsaponifiable (Piascledine) effect on structure modification in hip osteoarthritis: the ERADIAS study. Ann Rheum Dis. 2014;73(2):376–384. doi: 10.1136/annrheumdis-2012-202485. [DOI] [PMC free article] [PubMed] [Google Scholar]
- 108.Dougados M, Gueguen A, Nguyen M, Berdah L, Lequesne M, Mazieres B, et al. Requirement for total hip arthroplasty: an outcome measure of hip osteoarthritis? The Journal of rheumatology. 1999;26(4):855–861. [PubMed] [Google Scholar]
- 109.Maillefert JF, Gueguen A, Nguyen M, Berdah L, Lequesne M, Mazieres B, et al. Relevant change in radiological progression in patients with hip osteoarthritis. I. Determination using predictive validity for total hip arthroplasty. Rheumatology. 2002;41(2):142–147. doi: 10.1093/rheumatology/41.2.142. [DOI] [PubMed] [Google Scholar]
- 110.Maksymowych WP, Cibere J, Loeuille D, Weber U, Zubler V, Roemer FW, et al. Preliminary validation of 2 magnetic resonance image scoring systems for osteoarthritis of the hip according to the OMERACT filter. The Journal of rheumatology. 2014;41(2):370–378. doi: 10.3899/jrheum.131083. [DOI] [PubMed] [Google Scholar]
- 111.Mechlenburg I, Nyengaard JR, Gelineck J, Soballe K. Cartilage thickness in the hip joint measured by MRI and stereology--a methodological study. Osteoarthritis and cartilage / OARS, Osteoarthritis Research Society. 2007;15(4):366–371. doi: 10.1016/j.joca.2006.10.005. [DOI] [PubMed] [Google Scholar]
- 112.Kim SD, Jessel R, Zurakowski D, Millis MB, Kim Y-J. Anterior delayed gadolinium-enhanced MRI of cartilage values predict joint failure after periacetabular osteotomy. Clinical Orthopaedics & Related Research. 2012;470(12):3332–3341. doi: 10.1007/s11999-012-2519-9. [DOI] [PMC free article] [PubMed] [Google Scholar]
- 113.Zilkens C, Miese F, Kim Y-J, Hosalkar H, Antoch G, Krauspe R, et al. Three-dimensional delayed gadolinium-enhanced magnetic resonance imaging of hip joint cartilage at 3T: a prospective controlled study. European journal of radiology. 2012;81(11):3420–3425. doi: 10.1016/j.ejrad.2012.04.008. [DOI] [PubMed] [Google Scholar]
- 114.Bittersohl B, Steppacher S, Haamberg T, Kim YJ, Werlen S, Beck M, et al. Cartilage damage in femoroacetabular impingement (FAI): preliminary results on comparison of standard diagnostic vs delayed gadolinium-enhanced magnetic resonance imaging of cartilage (dGEMRIC) Osteoarthritis and cartilage / OARS, Osteoarthritis Research Society. 2009;17(10):1297–1306. doi: 10.1016/j.joca.2009.04.016. [DOI] [PubMed] [Google Scholar]
- 115.Kim EY, Kwack KS, Cho JH, Lee DH, Yoon SH. Usefulness of dynamic contrast-enhanced MRI in differentiating between septic arthritis and transient synovitis in the hip joint. AJR American journal of roentgenology. 2012;198(2):428–433. doi: 10.2214/AJR.11.6937. [DOI] [PubMed] [Google Scholar]


