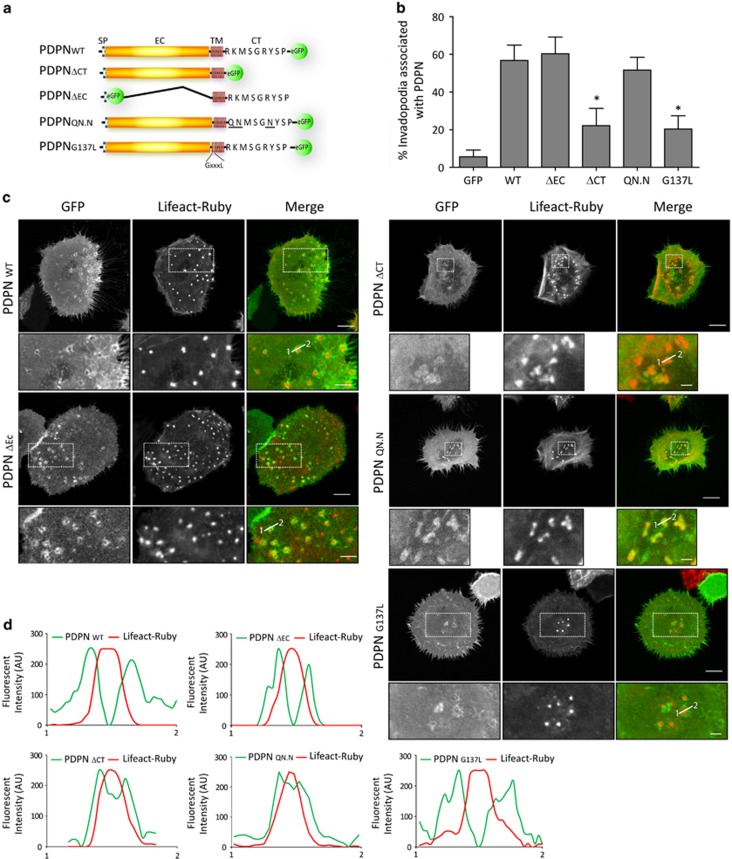
Figure 6.
Localisation of wild-type and mutant podoplanin proteins at invadopodia of HN5 cells. (a) Schematic representation of podoplanin fusion constructs used for rescue experiments. SP, signal peptide; EC, ectodomain; TM, transmembrane domain; CT, cytoplasmic tail. Basic amino acids (bold) within the CT tail (RK…R) were substituted by uncharged polar residues (QN…N; bold and underlined) disrupting the binding site for ERM proteins. The GXXXL motif within the TM domain was disrupted by substitution of the G in the position 137 by L. (b) Graph represents the percentage of invadopodia showing recruitment of the indicated podoplanin constructs. The results shown are the means±s.e.m. of n⩾250 invadopodia from two independent experiments. *P<0.05. (c) Confocal images of HN5 cells expressing the indicated podoplanin proteins. Bars=16 μm (upper panels) and 8 μm (lower panels). (d) Graphs indicate fluorescent intensity (in arbitrary units) of each podoplanin mutant construct with respect to F-actin over the indicated line scan. Data shown are representative from 5–8 invadopodia analysed per condition from three independent experiments.

