Abstract
Purpose
Parameters of the 2-pool model describing magnetization transfer (MT) in macromolecule-rich tissues may be significantly biased in partial volume (PV) voxels containing cerebrospinal fluid (CSF). The purpose of this paper is to develop a quantitative MT (qMT) method, which provides indices in sensitive to CSFPV averaging.
Theory and Methods
We propose a 3-pool MT model, in which PV macro-compartment is modeled as an additional non-exchanging water pool. We demonstrate the feasibility of model parameter estimation from several MT-weighted spoiled gradient echo (SPGR) datasets. We validated the 3-pool model in numerical, phantom and in-vivo studies.
Results
PV averaging with the free water compartment reduces all qMT parameters, most significantly affecting macromolecular proton fraction (MPF) and cross-relaxation rate. Monte-Carlo simulations confirmed stability of the 3-pool model fit. Unlike the standard 2-pool model, the 3-pool model qMT parameters were not affected by PV averaging in simulations and phantom studies. The 3-pool model fit allowed CSF PV correction in brain PV voxels and resulted in good correlation with standard 2-pool model parameters in non-PV voxels.
Conclusion
Quantitative MT imaging based on a three-pool model with a non-exchanging water component yields a set of CSF-insensitive qMT parameters, which may improve MPF-based assessment of myelination in structures strongly affected by CSF PV averaging such as brain gray matter.
Keywords: three-pool model, cross-relaxation imaging, quantitative magnetization transfer, MRI, gray matter, CSF
INTRODUCTION
Magnetization transfer (MT) effects enable inference of important information about tissue composition by providing sensitivity to macromolecule-bound protons typically not assessable by conventional MRI (1,2). The MT ratio (MTR), an empirical index of the MT effect, was found sensitive to different pathological changes in neural tissues including changes in myelination (3), inflammation (4), and axonal loss (5). More specific and scanner-independent assessment of the amount of macromolecular protons and their micro-environment may be achieved using quantitative treatment of the MT effect within the two-pool MT model formalism (2,6–12). The 2-pool quantitative MT (qMT) parameters include macromolecular proton fraction (MPF, f), the forward rate constant describing cross-relaxation with water protons (k), and the transverse relaxation time of bound protons T2b. Particularly promising results were reported for a key parameter, MPF, which strongly correlated with myelin content in neural tissues (13–16) and was shown to be capable of tracking age-related changes of white matter (WM) myelination (17,18). MPF in gray matter (GM) was found to be the strongest independent predictor of disability in multiple sclerosis (MS) patients (19).
Imaging anatomical structures with sizes on the order of clinical MRI resolution often has to contend with partial volume (PV) averaging with surrounding tissues. The PV effects may be especially pronounced in quantitative techniques if the relevant MR characteristics of the tissues differ significantly. A well-known source of such errors is a bias induced by PV averaging with cerebrospinal fluid (CSF). For example, even a small amount of CSF in a brain -containing voxel may strongly affect quantitative indices of diffusion-weighted imaging (DWI) (20,21) and multi-component T1/T2 relaxometry (22) owing to its distinct diffusion and relaxation properties, respectively. PV effects were also recognized as a source of artificial MTR reduction in cortical GM, which is most affected by CSF due to its complex morphology, small thickness, and large interface area. The increase of CSF PV effects due to atrophic changes in cortical GM leads to artificial alteration of quantitative metrics derived from the whole brain MTR histograms of MS patients (23). Such CSF-induced correlation of MTR values with atrophy further reduces the specificity of this parameter to pathology within such voxels.
As we demonstrate in this paper, PV averaging with CSF may also cause significant bias in the qMT parameters due to insufficiency of the two-pool MT model to describe signal from voxels containing both brain and non-brain tissues. In particular, this effect causes underestimation of MPF, which may mimic tissue demyelination. A standard method to eliminate CSF contamination in such voxels is to null CSF signal through inversion-recovery (IR) magnetization preparation. However, the long waiting time after IR preparation makes this approach not compatible with steady-state imaging sequences most widely used for qMT, which require uninterrupted sequences of excitations to maintain the steady-state conditions (6,10,24). For alternative qMT imaging strategies (9,12), IR-based CSF nulling would require further theoretical investigations to model the effect of the additional inversion pulse on the two-pool system.
In this work, we propose a model-based approach to minimize the effect of CSF on qMT measures. Similarly to assumptions used in (22), we assume that PV with non-brain tissues such as CSF may be modeled as a nonexchanging water pool. Therefore, we augment the standard two pools representing exchanging macromolecular and water protons with a third, non-exchanging water component. After analysis of the effect of CSF on qMT parameters within such a 3-pool model, we identify an experimental design suitable for the 3-pool model fit and establish the feasibility of unbiased estimation of the 3-pool qMT parameters from several MT-weighted measurements. We provide results of numerical, phantom and in-vivo validations supporting the new approach to minimize underestimation of qMT measures due to the PV effects.
THEORY
Quantifying 2-pool Model Parameters Using Cross -Relaxation Imaging
Our approach is based on the modified cross-relaxation imaging (mCRI) method for 2-pool qMT imaging. The full analytical mCRI expression may be found in (24). In this paper, we express mCRI model in an abridged form:
| [1] |
Here, M0 =Mb +Mw, Mb, and Mw are the total magnetization and magnetizations of macromolecular (B) and free water (W) pools, respectively, and R1w is the longitudinal relaxation rate of the water pool. The factor β absorbs instrumental scaling, effects of spin-spin relaxation (T2) and intra-voxel ( ) dephasing effects. Model Sξ depends explicitly on the 2-pool model parameters (Fig. 1) and several operator-controlled variables ξ. The subset of the 2-pool model parameters of interest determined in mCRI includes f, k, and T2b. The fit of the other parameters is often avoided by minimizing the sensitivity of the measurements to them and/or approximating them with relevant constraining values (10,25). For example, sensitivity of measurements to T2w is minimized by sampling Z-spectra at the offset frequencies much larger than the spectral line width of the free pool to minimize the direct saturation effects. The residual direct saturation effects are corrected using semi-empirical relations between the model parameters in healthy and pathological conditions and fixing a product
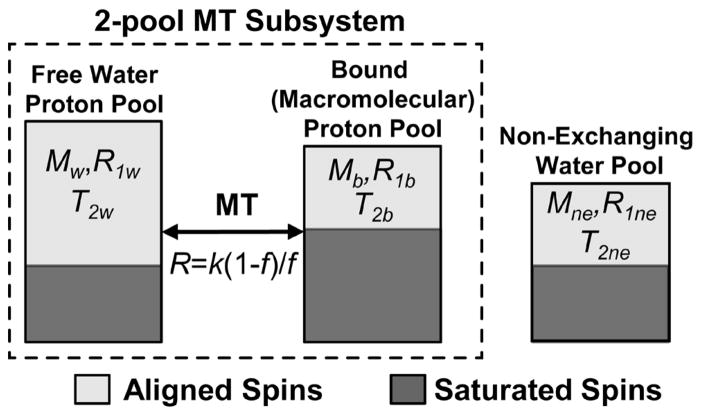
Figure 1.
Proposed 3-pool model consisting of a standard 2-pool MT subsystem and a third non-exchanging water pool.
| [2] |
as justified in Ref. (10). The operator-controlled variables relevant to the experiment design include the excitation flip angle (αex), off-resonance frequency (Δ) and effectual flip angle (αMT) of the MT saturation pulse, respectively (ξ =[αex, Δ, αMT]). Macromolecular pool fraction (MPF) is defined as a molar fraction of macromolecular spins, or, equivalently, as
| [3] |
In mCRI, the model is fit to the two sets of spoiled gradient echo (SPGR) measurements acquired both with and without MT saturation (7,10,24). MT SPGR data are obtained with variable Δ and αMT, and fixed αex, and SPGR data without MT saturation are obtained with variable αex (VFA SPGR). We will refer to this combination as “standard CRI design”. No-saturation conditions are typically achieved either by eliminating the MT pulse or by setting its off-resonance frequency to very large values (>100 kHz).
3-pool mCRI Model
We propose a 3-pool mCRI model which consists of a 2-pool MT subsystem (B+W) augmented with the third (NE) water compartment representing the contribution of PV tissue to the voxel (Fig. 1). We assume that this third compartment is non-exchanging with the MT subsystem, which is typically considered a safe assumption for CSF water that cannot mix with tissue water without crossing barriers (pia mater, ependyma) (22). Additionally, we assume that the effect of T2 differences between W and NE compartments on SPGR signal is minimal, which may be achieved in the short echo-time regime (TE ≪T2w, T2ne). In the absence of MT saturation, Eq. [1] may be used to describe the signal from a single water pool such as the NE compartment by zeroing parameters associated with the macromolecular pool. It may be shown that in this case Eq. [1] simplifies to the standard SPGR equation:
| [4] |
Here, Mne and R1ne are magnetization and longitudinal relaxation rate associated with this water compartment, respectively. Equation [4] is also applicable to describe the NE compartment signal in the presence of a MT pulse, if direct saturation of the water pool is negligible. This is a safe assumption in the regime of higher off-resonance frequencies (26) for the narrowly shaped saturation line of long-T2 CSF. To be consistent with the 2-pool model conventions, we keep f defined within the MT subsystem of the 3-pool model (Eq. [3]), and define the fraction of the non-exchanging component relative to the cumulative magnetization from the voxel:
| [5] |
Under such assumptions, the analytical expression describing signal from the 3-pool model system is given by:
| [6] |
MATERIALS AND METHODS
Experimental Design
As mentioned in the previous section, the standard experimental design for 2-pool cross-relaxation imaging includes VFA SPGR (varying αex, no MT saturation) and MT SPGR (fixing αex and varying Δ, αMT) datasets. We found the standard 2-pool experiment design to provide unsatisfactory parameter mapping efficiency for a 3-pool mCRI fit (see Results section). Hence, we performed Monte-Carlo simulations to identify the prototype acquisition schemes providing improved parameter-to-noise ratios for the 3-pool mCRI model fit. The successful acquisition schemes consisted of several MT SPGR measurements in which all control parameters ξ =[αex, Δ, αMT] were allowed to vary simultaneously (VFA-MT-SPGR design). The improved experimental design was compared with a standard CRI acquisition design (Table 1).
Table 1.
Parameters of acquisition protocols used in the paper. The measurements are performed with all combinations of excitation flip angle α, offset frequencies Δ and effective MT flip angles αMT shown in a particular row.
| Protocol | α, ° | Δ, kHz | αMT, ° | TR, ms |
|---|---|---|---|---|
| Standard CRI | 10 | 2.5,5,9,13 | 500,1100 | 40 |
| 5,10,20,30 | 250 | 500 | 40 | |
| Phantom | 19 | 2.5, 5, 9, 13 | 800, 1300 | 37 |
| 3, 7, 40 | 2.5, 13 | 800, 1300 | ||
| 3, 7, 19, 40 | 250 | 500 | ||
| In Vivo #1 | 10 | 2.5, 5, 9, 13 | 500, 1100 | 40 |
| 5, 10, 20, 30 | 2.5 | 785 | ||
| 5, 10, 20, 30 | 250 | 500 | ||
| In Vivo #2 | 4,14,26 | 2 | 1170 | 40 |
| 14 | 2 | 600 | 40 | |
| 14 | 8 | 1170 | 40 | |
| 4,14,26 | 250 | 150 | 23 |
Simulations
To estimate the relative errors in the 2-pool model parameters caused by unaccounted PV with CSF, synthetic signal intensities were generated using the 3-pool model (Eq. [6]). Specific parameters used in the simulation were taken from the region-of-interest (ROI) measurements in the thalamus (GM) from (24) and from published CSF relaxometry data (27) (R1w = 0.71 s−1; f = 8.8%; T2b= 10.21 μs, R1ne = 0.26 s−1, R=19 s−1). The forward exchange rate was calculated as k = R×f /(1−f), which equals to 1.57 s−1 for f=8.8%.
The accuracy and stability of model fitting was also studied in Monte-Carlo simulations over the range of f (0–20%) and fne (0–50%) values. In these simulations, 10,000 signal instances with different realizations of Gaussian noise were generated, fitted by both 2-pool and 3-pool models, and averaged to evaluate the estimation bias for each combination of f and fne. The input noise standard deviation corresponded to SNR=100 relative to the maximum signal value observed in the signals generated for the used ranges of f and fne. Noise performance of different experiment designs was assessed by calculating standard deviation of evaluated parameters across the Monte-Carlo samples and dividing the result by square root of total imaging time t to account for differences in the acquisition time.
Data Acquisition and Processing
All data were collected on a 3.0T GE Discovery MR 750 (GE Healthcare; Waukesha, WI) using an eight-channel transmit/receive knee coil (phantom scans) and eight-channel phased array head coil (volunteer scans). All qMT data were acquired with the 3D MT-weighted SPGR sequence with large spoiling gradients and optimized RF phase increments to achieve near-complete destruction of transverse magnetization at the end of each TR (described as a strong spoiling regime in (28)). A Fermi saturation pulse of duration 18 ms was used for MT preparation in all experiments. B0 and B1 maps were used to correct flip angle and local off-resonance frequency values in both phantom and volunteer studies. B1 maps were acquired using the optimized actual flip angle imaging (AFI) method (TR,1/TR,2/TE = 37/185/2.3 ms and αex= 55°, strong spoiling regime) (29). B0 maps were calculated from the 3D spoiled multi-gradient echo (SPGR) sequence and calculated using IDEAL technique (30). All datasets were co-registered using FLIRT software before model fitting. All parametric maps were generated by fitting the VFA and MT data simultaneously to the 2- (Eq. [1]) and 3-pool (Eq. [6]) model signal equations using C and MATLAB (MathWorks, Natick, MA) software written in -house.
Phantom Experiment
A phantom object was created by dissolving 25% (by weight) gelatin in heated water and pouring it into a plastic tube. After cooling, the tube was cut along the principal axis, and a half of the gelatin cylinder was extracted, covered by plastic wrap and placed into water. The imaging plane was tilted with respect to the phantom axis to introduce PVE from surrounding water varying along the phantom axis. A total of 24 VFA-MT-SPGR datasets were acquired (phantom protocol in Table 1). All datasets were acquired with TE=2.3 ms, FOV =140×140×60 mm and matrix = 128×128×20.
In-Vivo Experiments
Informed consent was obtained from a volunteer according to our institution policy. In the first experiment, sixteen measurements were acquired (In Vivo #1 in Table 1). The data were acquired axially with partial brain coverage with TE=2.0 ms, FOV =240×180×80 mm and matrix = 128×96×40 (total acquisition time including calibration scans was 45 min). The data were used to evaluate quality of fit using 2- and 3-pool models and to study correlations between 2-pool and 3-pool model parameters in both homogeneous areas of the brain and areas affected by PV averaging with CSF.
In the second study, we acquired whole brain data in the sagittal direction using optimized 3-pool mCRI acquisition (eight measurements, In Vivo #1 in Table 1). All data were acquired with whole brain coverage with TE=2.0 ms FOV =220×220×176 mm and matrix = 150×150×44 (total acquisition time including calibration scans was 30 min).
Statistical Analysis
Pearson’s correlation coefficient was used to determine associations between parameters of the 2-pool and 3-pool models. For this analysis, ROIs were manually drawn in several GM and WM structures, including those both affected and unaffected by PV with CSF, from the first dataset based on their anatomical location (31) and tissue contrast properties of qMT parametric maps as described in the literature (10,32). The non-PV ROIs included compact ROIs in white matter (anterior commissure, cerebral peduncle, cingulum, corona radiata, genu and splenium of corpus callosum, corpus medullare, external capsule, frontal white matter, gyrus rectus, anterior and posterior limbs of internal capsule, occipital white matter) and gray matter (head of caudate, globus pallidus, putamen, red nucleus, substantia nigra, thalamus). The partial volume ROIs were placed in both WM and GM structures interfacing with CSF (caudate nucleus, corpus callosum (body), insular cortex (left/right), precuneus, thalamus) based on their anatomical location and non-exchanging fraction (CSF) map. Model preference was quantified using the Bayesian information criterion (BIC, (33)). This criterion allows identification of the optimal fitted model with consideration of a potential overfit effect due to the increased number of free parameters in the model.
RESULTS
Numerical Simulations
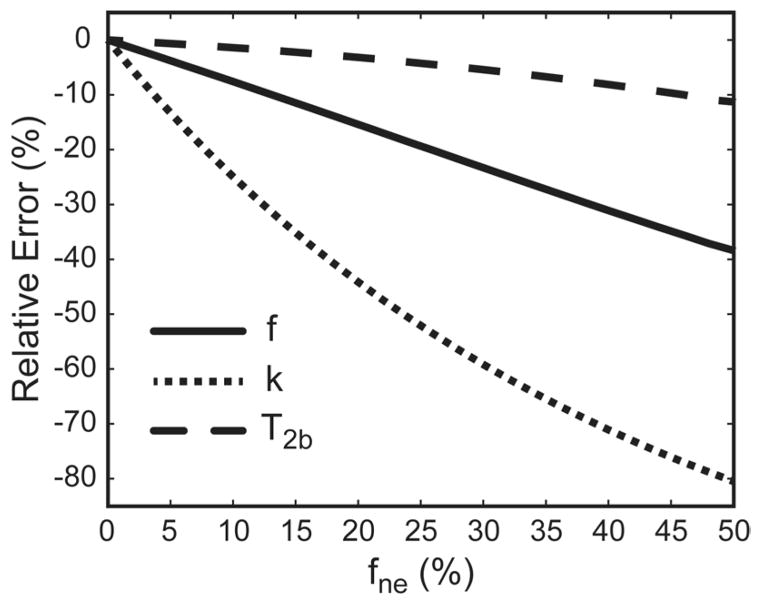
Figure 2 shows dependence of relative errors in qMT parameters estimated using the 2-pool model on the level of PV averaging with the third, non-exchanging water pool. The averaging with the non-exchanging water compartment progressively decreases apparent estimates of all 2-pool model parameters, with k and T2b being most and least affected, respectively. The exchange rate is markedly affected, with 10% partial-volume averaging (as measured by fne) causing approximately 25% reduction of this qMT parameter.
Figure 2.
Relative error of estimation of qMT parameters for different levels of partial voluming (fne) with the non-exchanging water pool (numerical simulations).
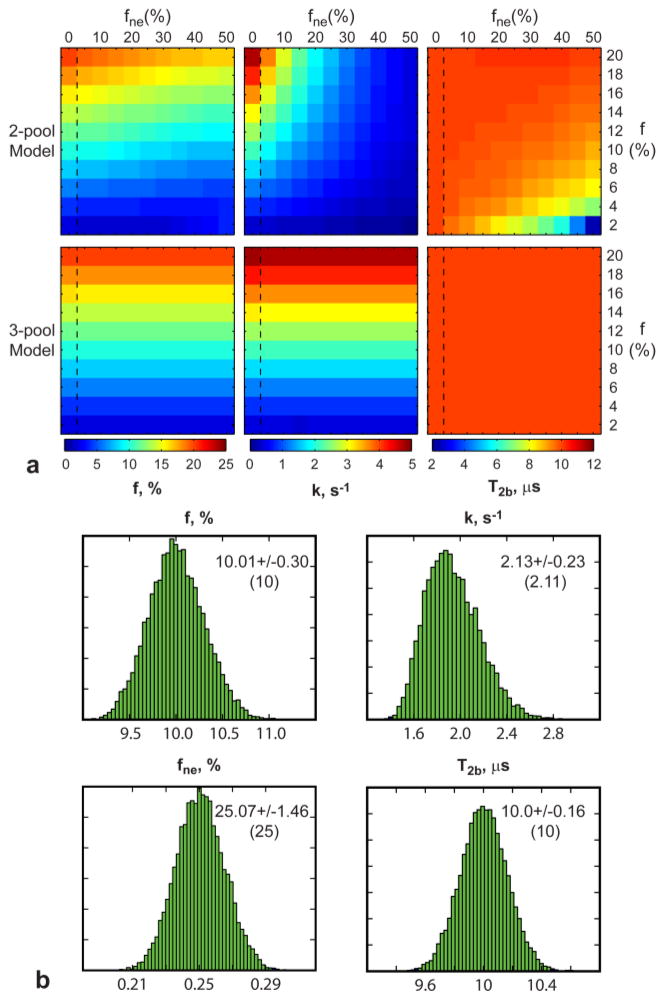
Figure 3a compares performance of the standard 2-pool and proposed 3-pool models for fitting MT data in the presence of the third water compartment. The two-pool model increasingly underestimates the MPF as the fne grows, while the 3-pool model makes MPF estimates independent of the third compartment size. Similar trends are observed for k and T2b. Figure 3b shows example distributions of qMT parameters and fne obtained with the 3-pool model fit from Monte-Carlo simulations. The distributions have unimodal Gaussian shapes suggesting that the algorithm is consistently converging to the same solution. Note consistency between estimated and true values for each parameter.
Figure 3.
Results of numerical simulations. a: Color-coded results of estimation of qMT parameters using 2-pool and 3-pool mCRI models. Vertical dashed rectangles delineate true parameter values (fne = 0%, no PV averaging) for each row. b: Histograms of parameter estimates from Monte-Carlo simulations with mean and standard deviation of the estimated parameters. The parameter values used in the simulations are shown in the parenthesis.
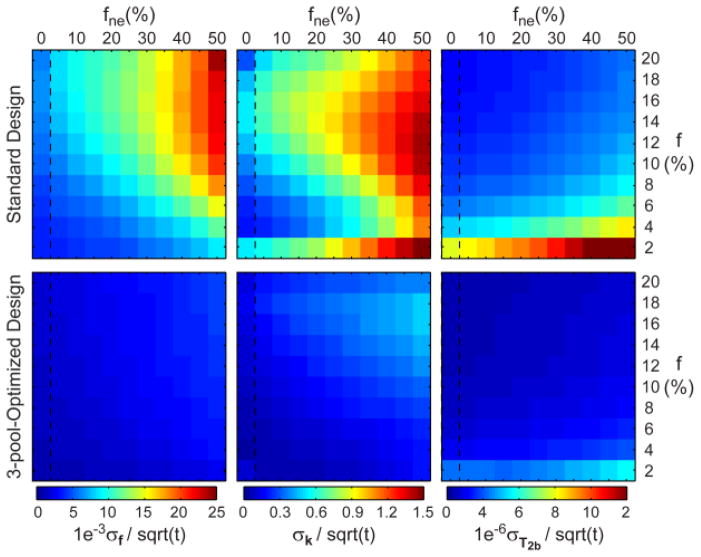
Figure 4 compares noise performance of standard and optimized experiment designs for the 3-pool model parameter estimation. The standard 2-pool mCRI design (VFA SGPR+MT SPGR) underperforms compared to the VFA-MT-SPGR (optimized) design. We calculated minimum/maximum/mean values of a ratio of normalized noise standard deviation attained with optimized and standard designs. The improved efficiency (ratio > 1) is observed for all qMT parameters for all values of f and fne (f: 2.29 / 3.98 / 2.98; k: 1.48 / 9.93 / 3.23; T2b: 1.89 / 2.38 / 2.26). Both designs demonstrate non-uniform performance over the ranges of parameter values. The noise performance decreases for higher fne indicating increased uncertainty of estimation of qMT parameters with growing levels of PV averaging for these experiment designs.
Figure 4.
Efficiency of 3-pool mCRI parameter mapping using standard and 3-pool-optimized experimental designs.
Phantom Study
Figure 5 shows results of validation of MPF correction using the 3-pool model in the MRI phantom. The ratio of MPF calculated by 2-pool and 3-pool models (Fig. 5a) reveals the underestimation of this parameter towards the phantom edges, where partial voluming with surrounding water exists (Fig. 5b). These changes are accompanied by decreased MPF f estimated by the standard 2-pool model (Fig. 5c). Simultaneously, the water fraction estimated by the 3-pool model increases along the axis of the tilted phantom (Fig. 5d). The 3-pool model estimate of MPF shows much less variability along the phantom reflecting the microstructural composition of the macromolecule-rich substance rather than macroscopic partial volume effects (Fig. 5c).
Figure 5.
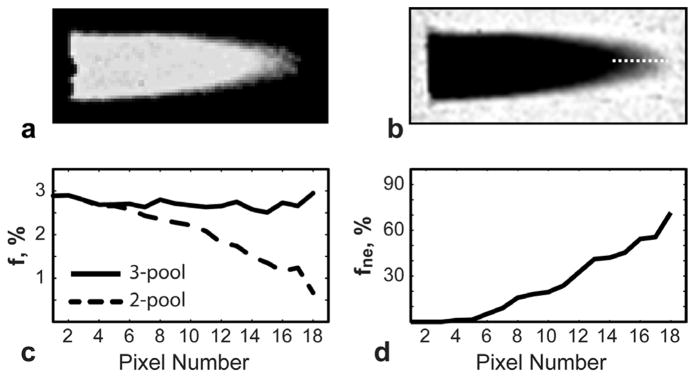
Correction of MPF values in phantom dataset. a: Ratio of 2 -pool and 3-pool MPF (f) maps shows reduction of 2-pool f in the peripheral regions compared to 3-pool f. b: Estimated fne component with the line profile. c,d : Plots of quantitative parameters (f, fne) along the line profile. Note decreased 2-poolf values (c) as partial volume averaging (fne) increases (d). The 3-pool model removes the effect of the third compartment yielding more uniform MPF (c).
In Vivo Experiments
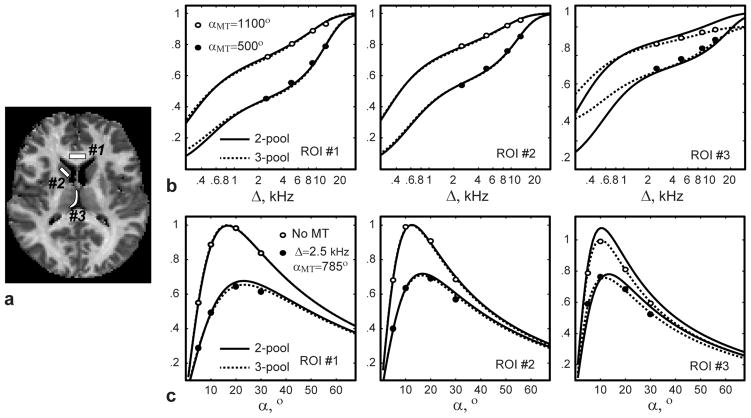
Figure 6 illustrates quality of fit of the 2- and 3-pool models to the averaged signal values in the regions with and without PV averaging with CSF in the first volunteer dataset (Fig. 6a). Both models fit the data well for compact WM and GM ROIs (norms of residuals for 2-/3-pool models are 3.4e-3/3.2e-3 (WM), and 3.5e-3/3.0e-3 (GM), respectively). At the same time, the three-pool model improves the data fit in PV ROI compared to the 2-pool model, which is not adequate to estimate qMT parameters in the presence of the non-exchanging compartment (norms of residuals are 15.1e-3 and 4.1e-3 for 2- and 3-pool models, respectively). The correlations between qMT measures calculated with 2-pool and 3-pool models in non-PV and PV ROIs are illustrated in Fig. 7 and Table 2. Across all non-PV structures, there was a strong correlation between two-pool and three-pool models in estimation of f, k, and T2b for separate and combined WM and GM ROI analysis. In PV ROIs, the significant correlation was only observed for T2b (Table 2), which is least affected by PV averaging (Fig. 2). At the same time, the correlations between the 2-pool and 3-pool model estimates were insignificant for f and k in PV ROIs due to CSF -induced biases in 2-pool model estimates.
Figure 6.
Quality of fit for different signal models in several brain ROIs. a: MPF image with ROI placements. b, c: Reconstructed signal curves for white matter (ROI #1), gray matter (ROI #2), and partial volume voxels (ROI #3) shown for subsets of data. Note improvements of fit in PV ROI #3 with the 3-pool model.
Figure 7.

Scatter plots of 2-pool vs. 3-pool qMT parameters in WM and GM ROIs without and with PV. The dashed line corresponds to the linear regression for either of the ROI subsets. The solid line represents the linear regression through the combined GM and WM ROIs.
Table 2.
Association (Pearson’s r) between qMT parameters of the 2-pool and 3-pool models in brain tissues of a healthy volunteer.
| f | k | T2b | |
|---|---|---|---|
| All brain tissues | 0.99 (p <10−4) | 0.98 (p <10−4) | 0.99 (p <10−4) |
| Whitematter | 0.96 (p <10−4) | 0.95 (p <10−4) | 0.99 (p <10−4) |
| Gray matter | 0.99 (p <10−4) | 0.94 (p = 0.005) | 0.99 (p <10−4) |
| Partial volume ROIs | 0.18 (p = 0.731) | 0.23 (p = 0.667) | 0.92 (p =0.009) |
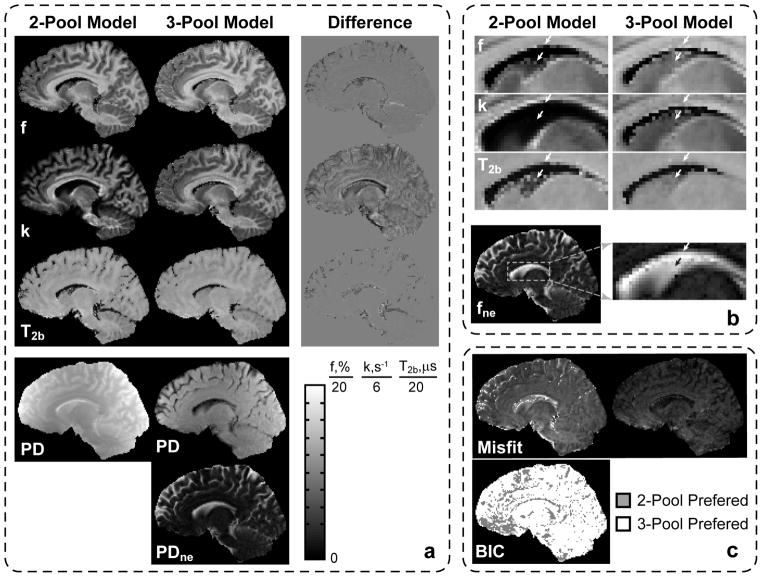
Figure 8 shows the results of mid-brain sagittal image reconstruction in the second volunteer dataset acquired with the optimized protocol. The difference maps between 2-pool and 3-pool qMT parameters reveal that most errors occur in PV voxels (Fig. 8a). These errors are most prominent for cortical GM areas, and periventricular GM/WM structures such as caudate nucleus and corpus callosum (white arrows in Fig. 8b), and they most affect the k map as predicted in the simulation studies (Fig. 2). Figure 8a also shows decomposition of the proton density term (PD = βM0) from the 2-pool model into the PD term corresponding to the 2-pool MT-subsystem (Fig. 1), and the term associated with the non-exchanging water compartment (PDne =βM0 fne /(1−fne)). The latter shows the expected anatomical distribution for CSF. Magnified ROIs in Fig. 8b show that removal of the CSF component markedly increases the apparent size of GM (caudate nucleus) and WM (corpus callosum) structures on all maps in the areas with partial volume averaging with CSF (white arrows). The level of underestimation across the imaging plane is consistent with the distribution of the non-exchanging component in fne. The correction of CSF PV averaging is more appreciated in the k map and less in T2b, which is in agreement with simulations (Fig. 2). The images of misfit (norm of residuals) in Fig. 8c show that the 3-pool model provides improved data fit (smaller norm of residuals). The effect is most evident in PV voxels with CSF (cortical GM and periventricular GM/WM structures) indicating that these voxels are inadequately described by the 2-pool model. The BIC binary map in Fig. 8c indicates a model for which BIC attained the lower value (preferred model). Therefore, the binary map shows that the 3-pool model is preferred to the 2-pool model in the majority of brain voxels.
Figure 8.
Comparison of fit results for 2-pool and 3-pool models in a healthy volunteer in the whole sagittal slice (a) and magnified ROI (b). Corresponding misfit and BIC maps for 2-and 3 -pool models are shown in (c).
DISCUSSION
Parameters of the 2-pool model describing magnetization transfer in macromolecule-rich tissues may be significantly underestimated in voxels containing CSF. To avoid this bias, we proposed a 3-pool MT model, in which the partial volume macro-compartment is modeled as an additional non-exchanging water pool. We demonstrated the feasibility of estimation of the 3-pool qMT parameters from MT-weighted SPGR datasets, in which sensitivity of measurements to the properties of individual pools is generated by varying parameters of MT saturation and excitation RF pulses. Our results demonstrate that the 3-pool model parameters strongly correlate with standard 2-pool model parameters in non-PV voxels, but not in PV voxels.
PV averaging with CSF is especially pronounced in cortical GM (20,22). Hence, given the sensitivity of MPF to these PV effects (Fig. 1), CSF may be a serious confounder for GM myelination assessment using MPF. As the degree of CSF contamination depends on the highly complex and variable morphology of cortical brain, the interpretation of MT measures may be complicated by regional and/or inter-subject variations in cortical GM organization as well as changes related to aging (i.e. atrophy) or disease. Hence, removing the confounding effects of CSF using the proposed technique may improve the ability of qMT-derived parameters to characterize the macromolecular content of cortical tissue independent of morphological/volumetric changes. However, as with any quantitative MRI technique, to establish its clinical usefulness, a separate clinical study has to be performed on a sizeable cohort of patients to evaluate its reproducibility and test-retest repeatability on clinical scanner hardware. This is critical to have sufficiently high sensitivity to detect meaningful changes without resorting to group comparisons. Longer scan times of the CSF-corrected qMT imaging may increase the chances of patient motion artifacts, which may necessitate prospective (34) or retrospective (35) motion -correction procedures.
One promising application of this technique is to study cortical GM pathology in multiple sclerosis (MS). GM involvement is increasingly recognized as critical to the morbidity and progression of the disease. Though histopathological studies and high-resolution imaging on experimental high-field MRI systems (7T and above) have confirmed significant GM involvement at all stages of the disease, the GM pathology remains seriously underestimated by conventional, anatomical MRI at common field strengths (1.5T and 3T) (36–38). The availability of an unbiased MPF-based myelin biomarker would greatly facilitate the study of GM involvement in MS; in particular, PV-corrected MPF measurements would likely improve myelin quantification in the outer, sub-pial layer of cortical GM where demyelination is most pronounced (as revealed by histopathology) but almost never detected by conventional MRI (39,40). Other potential applications of the proposed model are optic nerve and spinal cord imaging (41,42), where the relatively small size of these structures (compared to typical image resolutions of qMT techniques) may result in significant PV averaging with surrounding CSF.
Similar to other qMT techniques, our method relies on several assumptions to make parameter estimation feasible in a clinically acceptable time. One assumption is to constrain the longitudinal relaxation rate of bound protons R1b to 1 s−1. While this constraint is standard in a majority of qMT methods (2,6,7,10,24,25), recent work of Helms et al. (43) suggests that its value may be significantly underestimated for myelin, which may significantly affect absolute values of qMT parameters in brain tissues. Another simplification is to approximate direct saturation effects using Eq. [2], which allows to avoid fitting T2w in 2-pool MT models (10). For protocols In Vivo #1/In Vivo #2 in Table 1, this approximation affects least the key qMT parameter f (0.21%/0.22% mean relative error over the ranges of GM qMT parameter values given in Ref. (32)), and most k and T2b (0.94%/4.36% and 0.42%/1.30%, respectively). If higher accuracy and/or the low off-resonance frequency regime (Δ~1 kHz, (26)) is desired (e.g., to increase sensitivity to the exchange rate k (13)), the set of model parameters should be expanded by including the T2’s of the water compartments. The potential tradeoff here to reduce the number of measurements is to avoid estimating the T2 of the non-exchanging component as the direct saturation effects in long-T2 CSF are much smaller than in tissue water (signal attenuation is 1.0%/0.16% in CSF vs. 7.1%/1.29 % in GM tissue water for Δ=1 / 2.5 kHz (αMT=1100°), respectively). Another opportunity is to combine the proposed method with multi-component relaxometry in the steady state, which may improve separation of the exchanging and non-exchanging compartments by exploring differences not only in their MT properties but also in their T1/T2 values (22).
In theory, the three-pool model requires at least seven measurements to fit all parameters, compared to five measurements needed for the 2-pool model fit. In some scenarios, the extra time may allow decreasing the pixel dimension (by a factor ~1.2) in standard 2-pool qMT imaging thereby partially alleviating the PV effects. However, such optimization does not solve the problem of PV averaging, which exists at any qMT image resolution achievable in clinically acceptable scan times. One opportunity is to apply global search techniques to explore further optimization of the experiment design, which in the present paper was performed in a “brute-force” fashion. Such optimization should target parameter mapping efficiency over ranges of parameter values rather than for their single combination to ensure more uniform noise performance for a variety of tissues and degrees of PV averaging (Fig. 5) (44). Another potential opportunity to improve the time-efficiency of the proposed technique is to combine the 3-pool model with single point CRI techniques (25,45), which achieve mapping of the key qMT parameter, MPF, from a reduced set of measurement points and physiologically relevant constraints on the remaining qMT parameters. Because single-point CRI operates over a higher range of off-resonance frequencies (4kHz–6kHz), such combination would be appealing to further minimize the effects of direct saturation.
While the main motivation of this work was to improve estimation of myelin-sensitive MPF in regions of PV averaging with CSF, there may exist other useful applications of the proposed model. The 3-pool model enables direct estimation of proton density associated with CSF in a voxel, which may be useful to improve the accuracy of brain atrophy measurements in MS, Alzheimer’s and other neurodegenerative diseases, and in patients with enlarged perivascular spaces and/or chronic lacunar infarcts filled with CSF, which are very common. Another potential application of the 3-pool model is to characterize the macromolecular content of tissues in conditions featuring vasogenic edema as a potential confound (e.g. brain tumor, inflammation), where water in an expanded extracellular space may be approximated as a slowly exchanging compartment. While the utility of qMT measures other than MPF for GM characterization have not yet been studied, their correction for PV effects may be important in other applications; for example, both k and T2b were found to be associated with osteoarthritis at joint surfaces (46) where both parameters are likely to be affected by partial voluming with synovial fluid.
Acknowledgments
This work was supported by NIH NINDS (R01NS065034).
Footnotes
Part of this work was presented at ISMRM 2014 (Abstract #207).
References
- 1.Wolff SD, Balaban RS. Magnetization transfer contrast (MTC) and tissue water proton relaxation in vivo. Magn Reson Med. 1989;10(1):135–144. doi: 10.1002/mrm.1910100113. [DOI] [PubMed] [Google Scholar]
- 2.Henkelman RM, Huang X, Xiang QS, Stanisz GJ, Swanson SD, Bronskill MJ. Quantitative interpretation of magnetization transfer. Magn Reson Med. 1993;29(6):759–766. doi: 10.1002/mrm.1910290607. [DOI] [PubMed] [Google Scholar]
- 3.Deloire-Grassin MS, Brochet B, Quesson B, Delalande C, Dousset V, Canioni P, Petry KG. In vivo evaluation of remyelination in rat brain by magnetization transfer imaging. J Neurol Sci. 2000;178(1):10–16. doi: 10.1016/s0022-510x(00)00331-2. [DOI] [PubMed] [Google Scholar]
- 4.Vavasour IM, Laule C, Li DK, Traboulsee AL, MacKay AL. Is the magnetization transfer ratio a marker for myelin in multiple sclerosis? J Magn Reson Imaging. 2011;33(3):713–718. doi: 10.1002/jmri.22441. [DOI] [PubMed] [Google Scholar]
- 5.van Waesberghe JH, Kamphorst W, De Groot CJ, van Walderveen MA, Castelijns JA, Ravid R, Lycklama a Nijeholt GJ, van der Valk P, Polman CH, Thompson AJ, Barkhof F. Axonal loss in multiple sclerosis lesions: magnetic resonance imaging insights into substrates of disability. Ann Neurol. 1999;46(5):747–754. doi: 10.1002/1531-8249(199911)46:5<747::aid-ana10>3.3.co;2-w. [DOI] [PubMed] [Google Scholar]
- 6.Sled JG, Pike GB. Quantitative imaging of magnetization transfer exchange and relaxation properties in vivo using MRI. Magn Reson Med. 2001;46(5):923–931. doi: 10.1002/mrm.1278. [DOI] [PubMed] [Google Scholar]
- 7.Yarnykh VL. Pulsed Z-spectroscopic imaging of cross-relaxation parameters in tissues for human MRI: theory and clinical applications. Magn Reson Med. 2002;47(5):929–939. doi: 10.1002/mrm.10120. [DOI] [PubMed] [Google Scholar]
- 8.Ramani A, Dalton C, Miller DH, Tofts PS, Barker GJ. Precise estimate of fundamental in-vivo MT parameters in human brain in clinically feasible times. Magn Reson Imaging. 2002;20(10):721–731. doi: 10.1016/s0730-725x(02)00598-2. [DOI] [PubMed] [Google Scholar]
- 9.Gochberg DF, Gore JC. Quantitative imaging of magnetization transfer using an inversion recovery sequence. Magn Reson Med. 2003;49(3):501–505. doi: 10.1002/mrm.10386. [DOI] [PubMed] [Google Scholar]
- 10.Yarnykh VL, Yuan C. Cross-relaxation imaging reveals detailed anatomy of white matter fiber tracts in the human brain. Neuroimage. 2004;23(1):409–424. doi: 10.1016/j.neuroimage.2004.04.029. [DOI] [PubMed] [Google Scholar]
- 11.Gloor M, Scheffler K, Bieri O. Quantitative magnetization transfer imaging using balanced SSFP. Magn Reson Med. 2008;60(3):691–700. doi: 10.1002/mrm.21705. [DOI] [PubMed] [Google Scholar]
- 12.Ropele S, Seifert T, Enzinger C, Fazekas F. Method for quantitative imaging of the macromolecular 1H fraction in tissues. Magn Reson Med. 2003;49(5):864–871. doi: 10.1002/mrm.10427. [DOI] [PubMed] [Google Scholar]
- 13.Underhill HR, Rostomily RC, Mikheev AM, Yuan C, Yarnykh VL. Fast bound pool fraction imaging of the in vivo rat brain: association with myelin content and validation in the C6 glioma model. Neuroimage. 2011;54(3):2052–2065. doi: 10.1016/j.neuroimage.2010.10.065. [DOI] [PMC free article] [PubMed] [Google Scholar]
- 14.Schmierer K, Tozer DJ, Scaravilli F, Altmann DR, Barker GJ, Tofts PS, Miller DH. Quantitative magnetization transfer imaging in postmortem multiple sclerosis brain. J Magn Reson Imaging. 2007;26(1):41–51. doi: 10.1002/jmri.20984. [DOI] [PMC free article] [PubMed] [Google Scholar]
- 15.Ou X, Sun SW, Liang HF, Song SK, Gochberg DF. Quantitative magnetization transfer measured pool-size ratio reflects optic nerve myelin content in ex vivo mice. Magn Reson Med. 2009;61(2):364–371. doi: 10.1002/mrm.21850. [DOI] [PMC free article] [PubMed] [Google Scholar]
- 16.Dula AN, Gochberg DF, Valentine HL, Valentine WM, Does MD. Multiexponential T2, magnetization transfer, and quantitative histology in white matter tracts of rat spinal cord. Magn Reson Med. 2010;63(4):902–909. doi: 10.1002/mrm.22267. [DOI] [PMC free article] [PubMed] [Google Scholar]
- 17.Samsonov A, Alexander AL, Mossahebi P, Wu YC, Duncan ID, Field AS. Quantitative MR imaging of two-pool magnetization transfer model parameters in myelin mutant shaking pup. Neuroimage. 2012;62(3):1390–1398. doi: 10.1016/j.neuroimage.2012.05.077. [DOI] [PMC free article] [PubMed] [Google Scholar]
- 18.Pirpamer L, Borsodi FFE, Reishofer G, Langkammer C, Schmidt R, Ropele S. Age-related changes of the bound pool fraction in white matter. Proc of ISMRM; 2014; Milan, Italy. p. 206. [Google Scholar]
- 19.Yarnykh VL, Bowen JD, Samsonov A, Repovic P, Mayadev A, Qian P, Gangadharan B, Keogh BP, Maravilla KR, Henson LK. Fast Whole-Brain Three-dimensional Macromolecular Proton Fraction Mapping in Multiple Sclerosis. Radiology. 2014:140528. doi: 10.1148/radiol.14140528. [DOI] [PMC free article] [PubMed] [Google Scholar]
- 20.Yang AW, Jensen JH, Hu CC, Tabesh A, Falangola MF, Helpern JA. Effect of cerebral spinal fluid suppression for diffusional kurtosis imaging. J Magn Reson Imaging. 2013;37(2):365–371. doi: 10.1002/jmri.23840. [DOI] [PMC free article] [PubMed] [Google Scholar]
- 21.Falconer JC, Narayana PA. Cerebrospinal fluid-suppressed high-resolution diffusion imaging of human brain. Magn Reson Med. 1997;37(1):119–123. doi: 10.1002/mrm.1910370117. [DOI] [PubMed] [Google Scholar]
- 22.Deoni SC, Matthews L, Kolind SH. One component? Two components? Three? The effect of including a nonexchanging “free” water component in multicomponent driven equilibrium single pulse observation of T1 and T2. Magn Reson Med. 2013;70(1):147–154. doi: 10.1002/mrm.24429. [DOI] [PMC free article] [PubMed] [Google Scholar]
- 23.Kalkers NF, Hintzen RQ, van Waesberghe JH, Lazeron RH, van Schijndel RA, Ader HJ, Polman CH, Barkhof F. Magnetization transfer histogram parameters reflect all dimensions of MS pathology, including atrophy. J Neurol Sci. 2001;184(2):155–162. doi: 10.1016/s0022-510x(01)00431-2. [DOI] [PubMed] [Google Scholar]
- 24.Mossahebi P, Yarnykh VL, Samsonov A. Analysis and correction of biases in cross-relaxation MRI due to biexponential longitudinal relaxation. Magn Reson Med. 2013 doi: 10.1002/mrm.24677. [DOI] [PMC free article] [PubMed] [Google Scholar]
- 25.Yarnykh VL. Fast macromolecular proton fraction mapping from a single off-resonance magnetization transfer measurement. Magn Reson Med. 2012;68(1):166–178. doi: 10.1002/mrm.23224. [DOI] [PMC free article] [PubMed] [Google Scholar]
- 26.Portnoy S, Stanisz GJ. Modeling pulsed magnetization transfer. Magn Reson Med. 2007;58(1):144–155. doi: 10.1002/mrm.21244. [DOI] [PubMed] [Google Scholar]
- 27.Lu H, Nagae-Poetscher LM, Golay X, Lin D, Pomper M, van Zijl PC. Routine clinical brain MRI sequences for use at 3. 0 Tesla. J Magn Reson Imaging. 2005;22(1):13–22. doi: 10.1002/jmri.20356. [DOI] [PubMed] [Google Scholar]
- 28.Yarnykh VL. Optimal radiofrequency and gradient spoiling for improved accuracy of T1 and B1 measurements using fast steady-state techniques. Magn Reson Med. 2010;63(6):1610–1626. doi: 10.1002/mrm.22394. [DOI] [PubMed] [Google Scholar]
- 29.Yarnykh VL. Actual flip-angle imaging in the pulsed steady state: a method for rapid three-dimensional mapping of the transmitted radiofrequency field. Magn Reson Med. 2007;57(1):192–200. doi: 10.1002/mrm.21120. [DOI] [PubMed] [Google Scholar]
- 30.Reeder SB, Pineda AR, Wen Z, Shimakawa A, Yu H, Brittain JH, Gold GE, Beaulieu CH, Pelc NJ. Iterative decomposition of water and fat with echo asymmetry and least-squares estimation (IDEAL): application with fast spin-echo imaging. Magn Reson Med. 2005;54(3):636–644. doi: 10.1002/mrm.20624. [DOI] [PubMed] [Google Scholar]
- 31.Duvernoy HM. The Human Brain: Surface, Three-Dimensional Sectional Anatomy with MRI, and Blood Supply. New York: Springer-Verlag; 1999. [Google Scholar]
- 32.Underhill HR, Yuan C, Yarnykh VL. Direct quantitative comparison between cross-relaxation imaging and diffusion tensor imaging of the human brain at 3. 0 T. Neuroimage. 2009;47(4):1568–1578. doi: 10.1016/j.neuroimage.2009.05.075. [DOI] [PubMed] [Google Scholar]
- 33.McQuarrie ADR, Tsai C-L. Regression and time series model selection. Singapore ; River Edge, N.J: World Scientific; 1998. p. xxi.p. 455. [Google Scholar]
- 34.Maclaren J, Herbst M, Speck O, Zaitsev M. Prospective motion correction in brain imaging: a review. Magn Reson Med. 2013;69(3):621–636. doi: 10.1002/mrm.24314. [DOI] [PubMed] [Google Scholar]
- 35.Anderson AG, 3rd, Velikina J, Block W, Wieben O, Samsonov A. Adaptive retrospective correction of motion artifacts in cranial MRI with multicoil three-dimensional radial acquisitions. Magn Reson Med. 2013;69(4):1094–1103. doi: 10.1002/mrm.24348. [DOI] [PMC free article] [PubMed] [Google Scholar]
- 36.Kidd D, Barkhof F, McConnell R, Algra PR, Allen IV, Revesz T. Cortical lesions in multiple sclerosis. Brain. 1999;122 (Pt 1):17–26. doi: 10.1093/brain/122.1.17. [DOI] [PubMed] [Google Scholar]
- 37.Geurts JJ, Pouwels PJ, Uitdehaag BM, Polman CH, Barkhof F, Castelijns JA. Intracortical lesions in multiple sclerosis: improved detection with 3D double inversion-recovery MR imaging. Radiology. 2005;236(1):254–260. doi: 10.1148/radiol.2361040450. [DOI] [PubMed] [Google Scholar]
- 38.Geurts JJ, Barkhof F. Grey matter pathology in multiple sclerosis. Lancet Neurol. 2008;7(9):841–851. doi: 10.1016/S1474-4422(08)70191-1. [DOI] [PubMed] [Google Scholar]
- 39.Geurts JJ, Blezer EL, Vrenken H, van der Toorn A, Castelijns JA, Polman CH, Pouwels PJ, Bo L, Barkhof F. Does high-field MR imaging improve cortical lesion detection in multiple sclerosis? J Neurol. 2008;255(2):183–191. doi: 10.1007/s00415-008-0620-5. [DOI] [PubMed] [Google Scholar]
- 40.Simon B, Schmidt S, Lukas C, Gieseke J, Traber F, Knol DL, Willinek WA, Geurts JJ, Schild HH, Barkhof F, Wattjes MP. Improved in vivo detection of cortical lesions in multiple sclerosis using double inversion recovery MR imaging at 3 Tesla. Eur Radiol. 2010;20(7):1675–1683. doi: 10.1007/s00330-009-1705-y. [DOI] [PMC free article] [PubMed] [Google Scholar]
- 41.Smith SA, Golay X, Fatemi A, Jones CK, Raymond GV, Moser HW, van Zijl PC. Magnetization transfer weighted imaging in the upper cervical spinal cord using cerebrospinal fluid as intersubject normalization reference (MTCSF imaging) Magn Reson Med. 2005;54(1):201–206. doi: 10.1002/mrm.20553. [DOI] [PubMed] [Google Scholar]
- 42.Smith AK, Dortch RD, Dethrage LM, Smith SA. Rapid, high-resolution quantitative magnetization transfer MRI of the human spinal cord. Neuroimage. 2014;95:106–116. doi: 10.1016/j.neuroimage.2014.03.005. [DOI] [PMC free article] [PubMed] [Google Scholar]
- 43.Helms G, Hagberg GE. In vivo quantification of the bound pool T1 in human white matter using the binary spin-bath model of progressive magnetization transfer saturation. Phys Med Biol. 2009;54(23):N529–540. doi: 10.1088/0031-9155/54/23/N01. [DOI] [PubMed] [Google Scholar]
- 44.Samsonov AA, Alexander AL, Jung Y, Field AS. Practical optimum experimental designs for fast T1 relaxometry with SPGR sequences. ISMRM; 2008; Toronto. p. 3081. [Google Scholar]
- 45.Samsonov AA, Mossahebi P, Anderson A, Velikina JV, Johnson KM, Johnson SC, Fleming JO, Field AS. High Resolution, Motion Corrected Mapping of Macromolecular Proton Fraction (MPF). Clinically Acceptable Time Using 3D Undersampled Radials; Proc of ISMRM; 2014; Milan, Italy. p. 3337. [Google Scholar]
- 46.Sritanyaratana N, Samsonov AA, Saleh HA, Johnson KM, Block WF, Kijowski R. High Resolution, Motion Corrected Mapping of Macromolecular Proton Fraction (MPF). Clinically Acceptable Time Using 3D Undersampled Radials; Proc of ISMRM; 2012; Melbourne, Australia. p. 1382. [Google Scholar]


