

Abstract
This study investigates the in vitro cytocompatibility of one- and two-dimensional (1-D and 2-D) carbon and inorganic nanomaterial reinforced polymeric nanocomposites fabricated using biodegradable polymer poly (propylene fumarate), crosslinking agent N-vinyl pyrrolidone (NVP) and following nanomaterials: single- and multi- walled carbon nanotubes, single- and multi- walled graphene oxide nanoribbons, graphene oxide nanoplatelets, molybdenum disulfide nanoplatelets, or tungsten disulfide nanotubes dispersed between 0.02–0.2 wt% concentrations in the polymer. The extraction media of unreacted components, crosslinked nanocomposites and their degradation products between 1X-100X dilutions were examined for effects on viability and attachment employing two cell lines: NIH3T3 fibroblasts and MC3T3 pre-osteoblasts. The extraction media of unreacted PPF/NVP elicited acute dose-dependent cytotoxicity attributed to leaching of unreacted components into cell culture media. However, extraction media of crosslinked nanocomposites showed no dose dependent adverse effects. Further, all crosslinked nanocomposites showed high viability (78–100%), high cellular attachment (40–55%), and spreading that was confirmed by confocal and scanning electron microscopy. Degradation products of nanocomposites showed a mild dose-dependent cytotoxicity possibly due to acidic degradation components of PPF. In general, compared to PPF control, none of the nanocomposites showed significant differences in cellular response to the unreacted components, crosslinked nanocomposites and their degradation products. The initial minor cytotoxic response and lower cell attachment numbers were observed only for a few nanocomposite groups; these effects were absent at later time points for all PPF nanocomposites. The favorable cytocompatibility results for all the nanocomposites opens avenues for in vivo safety and efficacy studies for bone tissue engineering applications.
Keywords: Graphene, inorganic nanomaterials, cytotoxicity, nanocomposites, tissue engineering, biodegradable polymers
1. Introduction
Biodegradable polymers such as poly(lactic-co-glycolic acid) (PLGA) [1], poly(polypropylene fumarate) (PPF) [2], and non-biodegradable polymers such as polyurethane (PU) [3] have been employed to develop coatings for metallic implants [1] and non-porous prosthetic polymeric components such as compact rods [4] and interference screws [5]. The biodegradable polymers have also been broadly used to fabricate porous scaffolds to treat bone loss due to fractures, traumatic musculoskeletal injuries, congenital abnormalities, or other bone defects [6–10]. For applications involving load bearing implants, these polymers lack adequate mechanical properties [11]. Studies show that incorporation of carbon and inorganic nanomaterials such as fullerenes [12], carbon nanotubes (CNTs) [13] and alumoxane nanomaterials [14] as reinforcing agents into these polymers significantly improves their mechanical properties [15].
Recently, we systematically investigated the efficacy of one- and two-dimensional (1-D and 2-D) organic and inorganic nanomaterials as reinforcing agents to improve the mechanical properties (compressive and flexural modulus, and yield strength) of the polymer PPF. Single- and multi- walled carbon nanotubes (SWCNTs, MWCNTs), single- and multi- walled graphene oxide nanoribbons (SWGONRs, MWGONRs), graphene oxide nanoplatelets (GONPs), molybdenum disulfide nanoplatelets (MSNPs), or tungsten disulfide nanotubes (WSNTs) were dispersed into PPF at various loading concentrations (0.01–0.2 wt %). These nanomaterial-reinforced PPF nanocomposites exhibited mechanical properties (e.g. 1–1.6 GPa compressive modulus) that was similar to cancellous bone (0.3–10 GPa compressive modulus) [16, 17].
Along with the efficacy studies, in vitro cytotoxicity and in vivo biocompatibility of nanomaterials-incorporated polymers also needs to be thoroughly investigated. In vitro studies are typically the first step to screen various nanomaterials and nanocomposites formulations before more elaborate and costly in vivo animal experiments [12]. Various in vitro studies have investigated the cytotoxicity of SWCNTs [18], MWCNTs [19], GONPs [20, 21], GONRs [22, 23], MSNPs [24] and WSNTs [25]. A few studies have investigated the in vitro cytotoxicity and in vivo biocompatibility of nonporous PPF nanocomposites [26, 27] and porous PPF scaffolds containing SWCNTs [28, 29] and alumoxane nanomaterials [14, 30, 31]. The in vitro cytotoxicity of other carbon nanomaterials-reinforced PPF nanocomposites (MWCNTs, SWGONRs, MWGONRs and GONPs) and inorganic nanomaterials-reinforced PPF nanocomposites (WSNTs and MSNPs) has not been reported. Cytocompatibility of some of these nanomaterials incorporated into other polymer nanocomposites such as PLGA (nonporous CNT/PLGA [32] and porous GONP/PLGA [33]), and PU (porous GONP/PU scaffolds [34]) has been investigated.
In this study, we have systematically examined the cytocompatibility of various 1-D and 2-D carbon (SWCNTs, MWCNTs, SWGONRs, MWGONRs and GONPs) and inorganic (WSNTs and MSNPs) nanomaterials-reinforced PPF nanocomposites using NIH3T3 fibroblasts and MC3T3 pre-osteoblasts. The comprehensive cytocompatibility assessment included assays to characterize the cytotoxicity of unreacted components, crosslinked nanocomposites, and their degradation products. Additionally, cell attachment and proliferation studies were performed on the crosslinked nanocomposites.
2. Materials and methods
2.1 Synthesis of nanomaterials and nanocomposites
2.1.1 Materials
Diethyl fumarate, hydroquinone, N-vinyl pyrrolidone (NVP), potassium permanganate, zinc chloride, benzoyl peroxide (BP), graphite, molybdenum trioxide, sulfur and MWCNTs were purchased from Sigma Aldrich (St. Louis, MO, USA). Other analytical grade materials: hydrogen peroxide, ethyl ether, sodium sulfate, methylene chloride, isopropanol, ethanol, chloroform, hydrochloric acid, phosphoric acid, sulfuric acid and calcium hydroxide were purchased from Fisher Scientific (Pittsburgh, PA, USA). Propylene glycol was obtained from Acros Organics (Pittsburgh, PA, USA). SWCNTs were purchased from CheapTubes Incorporated (Battleboro, VT, USA), and WSNTs were donated by Nanomaterials Limited (Yavne, Israel).
2.1.2 Polymer synthesis
PPF was synthesized using a well-established two-step reaction of propylene glycol and diethyl fumarate [35]. It was characterized using proton nuclear magnetic resonance spectroscopy (H1-NMR, 300Hz, Oxford instruments, Oxford, UK) and high performance liquid chromatography (Accela 600 HPLC, Thermo Scientific, Waltham, MA, USA) as described previously [16, 17].
2.1.3 Nanomaterial synthesis
SWGONRs and MWGONRs were synthesized by an oxidative unzipping method developed by Kosynkin, Tour and co-workers using SWCNTs and MWCNTs as starting material [36]. GONPs were synthesized utilizing the modified Hummer’s method (the modified technique allows synthesis of macroscopic quantities of graphene oxide nanoplatelets through additional dispersing and filtration steps compared to the conventional Hummer’s method [37]). MSNPs were synthesized using well established chemical method using molybdenum trioxide and sulfur as starting materials [38].
2.2 Nanocomposite fabrication
PPF nanocomposites were fabricated as reported previously [16, 17]. The loading concentration of each nanomaterial was the concentration that yielded the maximum compressive modulus in our previous study [16, 17]. Briefly, PPF and NVP were mixed in chloroform followed by addition of 0.02 wt. % SWCNTs, 0.1 wt. % of MWCNTs, SWGONRs, MWGONRs, GONPs and 0.2 wt. % of WSNTs and MSNPs. The PPF, NVP, and nanomaterial blends were subjected to bath sonication for 30 minutes (FS30H bath sonicator, Fisher Scientific, Madison, CT, USA) followed by probe sonication for 2 minutes (2 sec ‘on’ and 1 sec ‘off’ cycle; LPX-750 sonicator, Cole Parmer, Vernon Hills, IL, USA). Chloroform was removed using a rotavapor (R-215, Büchi, New Castle, DE, USA), and thermal cross-linking of nanocomposite was initiated by addition of 1 wt. % benzoyl peroxide (BP) radical initiator. The crosslinking of nanocomposites was completed overnight at 60°C inside a custom made Teflon® mold (Mcmaster-carr, Princeton, NJ, USA). Cylindrical crosslinked specimens with diameter of 6.5 mm and height of 14 mm were cut into disks of 1 mm thickness by a low-speed diamond saw (Model 650, South Bay Technology, Redondo Beach, CA, USA) and used for in vitro studies.
2.3 Characterization of nanomaterials and nanocomposites
2.3.1 Raman spectroscopy
A WITec spectrometer (α-300R, Chicago, IL, USA) recorded the Raman spectra in the wavenumber range of 100–2900 cm−1 using an excitation wavelength of 532 nm. For sample preparation, 1 mg of nanomaterials was dispersed in a (50:50) mixture of ethanol-distilled water inside a 1.5 mL microcentrifuge tube (Eppendorf AG, Hauppauge, NY, USA) and subjected to bath sonication for 30 minutes and then probe sonication for 2 minutes (2 sec ‘on’ and 1 sec ‘off’ cycle). Next, the microcentrifuge tube underwent 5 minutes of centrifugation at 5000 rpm. 20 μl of its content was drop casted on freshly cleaved silicon wafers (Ted Pella, Redding, CA, USA), air-dried, and used for Raman spectroscopy.
2.3.2 Transmission electron microscopy (TEM)
TEM samples were prepared using 10 μl of nanomaterial dispersions prepared for Raman analysis. The dispersions were drop casted on TEM grids (300 mesh sizes, lacey carbon grids, Ted Pella, Redding, CA, USA) and air dried overnight. TEM was performed using a TECNAI BioTwin G2 transmission electron microscope (FEI Technologies, Hillsboro, OR, USA) at an 80 kV accelerating voltage.
2.3.3 Scanning electron microscopy (SEM)
SEM imaging was performed using a JEOL 7600F high resolution SEM microscope (JEOL Inc., Peabody, MA, USA) at the Center for Functional Nanomaterials, Brookhaven National Laboratory, NY, USA. A double-sided carbon adhesive tape (Pelco®, Ted Pella, Redding, CA, USA) was used to fix nanocomposite discs onto the SEM sample holders. These specimens were sputter-coated with 3 nm of gold to prevent charge accumulation. Secondary electron imaging (SEI) detector was used to image samples at a 5 kV accelerating voltage.
2.4 In Vitro studies
2.4.1 Cell culture
NIH3T3 fibroblasts (passages 24–27) and MC3T3 pre-osteoblasts (passages 10–14) were used for cytocompatibility studies. Dulbecco’s modified eagle medium (DMEM, Gibco Life Technologies, Grand Island, NY, USA) and minimum essential medium alpha (MEM-α, Gibco Life Technologies) media, supplemented with 10 vol. % fetal bovine serum (FBS, Gibco Life Technologies) and 1 vol. % antibiotics (penicillin- streptomycin, Gibco Life Technologies, Grand Island, NY, USA) were used to culture NIH3T3 and MC3T3 cells, respectively. Blank media refers to unaltered DMEM and MEM- α media containing supplements. Cells were lifted using trypsin-EDTA (1X, Gibco Life Technologies, Grand Island, NY, USA) and seeded in a 96-well plate (BD Falcon, Franklin Lakes, NJ, USA) at cell density of 5,000 cells/well (15,625 cells/cm2). After incubation for 24 hours, wells were washed with Dulbecco’s phosphate buffered saline solution (DPBS, Gibco Life Technologies, Grand Island, NY, USA) and incubated with cell culture media called experimental media. This media was prepared by a direct extraction method according to ISO 10993-5 [43]. Treatment duration was 24 hours and the treated cells were kept in humidified (95% air and 5% carbon dioxide) incubator operating at 37°C temperature.
2.4.2 Presto blue assay
Cell viability was assessed using presto blue assay according to manufacturer’s protocol. NIH3T3 and MC3T3 cells in densities of 5,000 cells/well (15,625 cells/cm2) were seeded in a 96-well plate. After 24 hours treatment, 10 μl presto blue was added to each well. After 2 hours of incubation, fluorescence readings were obtained using a Cytoflour4000 plate reader (McKinley Scientific, Sparta Township, NJ, USA) at excitation and emission wavelengths of 530 nm and 590 nm, respectively. Wells with 5,000 viable cells (no treatment) served as a positive (live) control. Wells containing cells treated with PPF experimental media served as a baseline control and wells with blank media (without cells) served as a negative control. Sample size was n=6 for this assay. Fraction of viable cells was determined using equation:
where, FS is the fluorescence of each well after background subtraction, and FL is the average fluorescence of positive (live) control after background subtraction.
2.4.3 Lactate dehydrogenase (LDH) assay
Membrane integrity of cells was characterized using LDH Assay (TOX-7, Sigma Aldrich, St. Louis, MO, USA) according to manufacturer’s protocol. NIH3T3 and MC3T3 cells at densities of 5,000 cells/well (15,625 cells/cm2) were seeded in a 96-well plate and incubated for 24 hours. After incubation, the media was replaced with the experimental media. After 24 hours treatment, the culture plates were centrifuged at a speed of 1200 rpm to remove cellular debris. 50 μl of the supernatant media was transferred to a new 96-well plate followed by addition of 100 μl LDH assay reagent to each of the wells. After incubation for 40 minutes in the dark, the absorbance was recorded at wavelength of 490 nm using a Biotek EL800 plate reader (Winooski, VT, USA). To the wells with 5000 viable cells, 10 μl lysis solution was added for 15 min (TOX-7, Sigma Aldrich, St. Louis, MO, USA) to lyse the cells, and these wells served as positive (dead) controls. Wells treated with experimental media of PPF polymer served as a baseline control. Wells containing blank media (without cells) served as a negative control. Sample size was n=6 for this assay. Fraction of dead cells was calculated using following equation:
where, AS is the absorbance of each well after background subtraction, and AD is the average absorbance of positive (dead) control after background subtraction.
2.4.4 Calcein-AM (LIVE) assay
Calcein-AM (calcein acetoxymethyl ester) was used to stain the adherent viable cells on the surface of nanocomposites after 1 and 5 days of incubation. 5 μl of calcein-AM stock solution (40 mM concentration, Sigma Aldrich, St. Louis, MO, USA) was added to 10 ml DBPS and then added to the crosslinked nanocomposite disks (100,000 cells/specimen or 3 x 10⁵ cells/cm2). The disks were incubated at 37°C. After incubation for 30 minutes in dark, samples were washed with DPBS prior to confocal imaging. Fluorescence images were recorded under an excitation wavelength of 485 nm and an emission wavelength of 530 nm. Wells of a 96-well pate (TCPS control) containing initially 100,000 (3.12 x 10⁵ cells/cm2) seeded cells served as a positive control whereas blank wells containing media served as a negative control. Sample size was n=3 for calcein-AM staining.
2.4.5 In vitro studies to examine the effects of non-crosslinked macromers
A blend of PPF-NVP (50:50) was sterilized for 3 hours under ultraviolet light (UV). Next, cell culture media was added to the blend and incubated for 24 hours at 37°C (1 ml media per cm2 contact area). The supernatant of this media was then used for studies. As-prepared supernatant (labeled 1X experimental media) and its 10X and 100X dilutions (called 10X and 100X experimental media, respectively) were used to treat the cells. Viability of the cells was examined by presto blue and LDH assays after 24 hours incubation with 1X, 10X or 100X experimental media. Sample size was n=6 for each experimental group.
2.4.6 In vitro studies to examine the effects of crosslinked nanocomposites
Nanocomposite disks with 6.5 mm diameter and 1 mm thickness were sterilized under UV for 3 hours and incubated with cell culture media (1 ml media per cm2 contact area). The supernatant of this media was then used for studies. As-prepared supernatant (labeled 1X experimental media) and its 10X and 100X dilutions (called 10X and 100X experimental media, respectively) were used to treat the cells. Cell were first cultured inside a 96-well plate and incubated at 37°C temperature for 24 hours. Next, 1X, 10X or 100X experimental media were added to these cells. Viability of the cells was analyzed after 24 hours incubation with the experimental media using presto blue and LDH assays. Sample size was n=6 for each experimental group.
2.4.7 In vitro studies to examine the effects of degradation products from nanocomposites
Nanocomposite specimens underwent an expedited hydrolytic degradation process. First, 2.5 g of each nanocomposite was crushed. The crushed nanocomposites were degraded for 14 days inside a sealed 25 ml glass vial containing 0.25 N Ca(OH)2 solution, kept on a shaker table at 100 rpm. The solution containing degradation product was brought to pH=7.4 using H3PO4, and then vacuum filtered using Whatman® filter paper (No. 40, Fisher Scientific, Pittsburg, PA, USA). Degradation products does not contain ingredients and supplements found in regular cell culture media such as D-glucose, L-glutamine and FBS, therefore, filtered solution was diluted with cell culture media at 1:1 ratio to provide those necessary components. This 2X experimental media was further diluted to 10X and 100X folds using blank cell culture media to prepare 10X and 100X experimental media. Viability of the cells was assessed, after 24 hours of incubation with the 2X, 10X or 100X experimental media, by presto blue and LDH assays. PPF polymer served as a baseline control. Sample size was n=6 for each experimental group. Osmolarity of unaltered DMEM, MEM-α and DPBS media after degradation was measured (sample size n=3) using a 3D3 osmometer (Advanced Instruments, Norwood, MA, USA).
2.4.8 In vitro studies to characterize the cell attachment and spreading on crosslinked nanocomposites
Crosslinked nanocomposites disks (6.5 mm diameter, 1 mm thickness) were sterilized for 3 hours using UV light and placed inside a 6-well plate (BD Falcon, Franklin Lakes, NJ, USA). Autoclaved stainless steel hollow weights were placed on top of each disk prior to cell culture to prevent floating of nanocomposite specimens and ensure proper cell seeding. Next, NIH3T3 and MC3T3 cells were seeded inside the rings at density of ~400,000 cells/specimen (1.2 x 10⁶ cells/cm2). After incubation for 1 day, the nanocomposite specimens were washed and cells were detached and counted using a hemocytometer (Fisher Scientific, Pittsburg, PA, USA). PPF polymer served as a baseline control, and tissue culture polystyrene (TCPS) served as a positive control. To prepare positive control 400,000 cells were cultured inside a 96-well plate with 28.27 mm2 (same area with nanocomposite disks). Sample size was n=3 for each experimental group.
Confocal fluorescence microscopy was employed to visualize cell proliferation and spreading on the surface of nanocomposites. Cells were seeded at a density of 100,000 cells per specimen (3 x 10⁵ cells/cm2), and incubated for 1 and 5 days. Subsequently, calcein-AM dye (Gibco Life Technologies, Grand Island, NY, USA) was used to stain the attached cells. Disks were then placed inside a glass-bottom petridish (Mattek, Ashland, MA, USA) and imaged using an LSM 510 (Carl Zeiss, Oberkochen, Germany) laser scanning confocal microscope with an emission wavelength of 515 nm. PPF polymer served as a baseline control, and wells of a 96-well tissue culture polystyrene plate (TCPS) initially seeded with 100,000 cells (3.12 x 10⁵ cells/cm2) served as a positive control. Blank wells containing media served as a negative control. Sample size was n= 3 for each experimental group.
Scanning electron microscopy (SEM) was also used to investigate cellular attachment and spreading on the nanocomposite disks. The samples for SEM were prepared as follows. Nanocomposite discs used for confocal microscopy were fixed using 2.5% glutaraldehyde solution, washed with ethanol (using 70%, 80%, 90%, and 100% ethanol solutions) and dried in air and vacuum for 24 hours each. SEM was performed using a high-resolution JEOL 7600F HRSEM microscope (JEOL Inc., Peabody, MA, USA) the Center for Functional Nanomaterials, Brookhaven National Laboratory, NY, USA, at an accelerating voltage of 5 kV.
2.5 Statistical analysis
Statistical analysis was performed using a 95% confidence interval (p<0.05). Single factor analysis of variance (one way ANOVA) followed by Tukey’s post-hoc test was performed to investigate significant differences between experimental groups. The data is presented as mean ± standard deviation.
3. Results
The experimental and control groups used in this study are listed in Table 1.
Table 1.
The experimental and control groups used in this study.
| Name | Abbreviation |
|---|---|
| PPF | poly(propylene fumarate) |
| SWCNTs | single walled carbon nanotubes |
| MWCNTs | multi walled carbon nanotubes |
| SWGONRs | single walled graphene oxide nanoribbons |
| MWGONRs | multi walled graphene oxide nanoribbons |
| GONPs | graphene oxide nanoplatelets |
| WSNTs | tungsten disulfide nanotubes |
| MSNPs | molybdenum disulfide nanoplatelets |
3.1 Characterization of polymer and nanomaterials
The NMR spectra of PPF polymer is included in the supplementary information (Figure 1S), and is similar to published spectra [35]. Figure 1a–g display TEM of the various nanomaterials. SWCNTs (Figure 1a) and MWCNTs (Figure 1b) were present as individual and bundled nanotubes. The diameter and length of SWCNTs were ~1–2 nm and ~20–30 μm, respectively. The diameter and length for MWCNTs were ~20–30 nm and ~200 μm, respectively. TEM images of SWGONRs (Figure 1c) and MWGONRs (Figure 1d) showed a smooth planar structure with few edge defects, and indicated the complete unzipping of SWCNTs and MWCNTs into nanoribbons (width of nanoribbons ~ π x diameter). The width and length of SWGONRs were ~4 nm and ~20–30 μm, respectively. The width and length for MWGONRs were ~20–30 nm and ~200 μm, respectively. GONPs (Figure 1e) were disk shaped with ~200–1600 nm diameter and ~ 5 nm thickness. MSNPs (Figure 1f) were hexagonal nanoplatelets with ~100 nm diameter and ~8 nm thickness. WSNTs (Figure 1g) were tube-shaped with ~15–100 nm diameter and ~ 4 μm length.
Figure 1.

Representative transmission electron microscopy images of (a) single walled carbon nanotubes, (b) multiwalled carbon nanotubes, (c) single walled graphene oxide nanoribbons, (d) multi walled graphene oxide nanoribbons, (e) graphene oxide nanoplatelets, (f) molybdenum disulfide nanoplatelets, and (g) tungsten disulfide nanotubes.
Figure 2 shows Raman spectra of SWCNTs, MWCNTs, SWGONRs, MWGONRs, GONPs, WSNTs and MSNPs. Raman spectroscopy analysis (Figure 2) of SWCNTs, MWCNTs, SWGONRs, MWGONRs, and GONPs showed the characteristic D (1330–1340 cm−1), G (1573–1586 cm−1) and G′ (2650 cm−1) bands of graphene. Structural defects and functional groups are the cause of the first order D band (one phonon double resonance resulting from the disruption of C=C bonds [39]), the G band is a result of in-plane vibrations involving sp2 hybridized carbon atoms, and G′ band (also called 2D) is a second order resonance peak of the D band [40]. Raman peaks at 1330 cm−1 and 1584 cm−1 were observed for SWCNTs (Figure 2a). The peaks at 1340 cm−1 and 1573 cm−1 were observed for MWCNTs (Figure 2b). SWGONRs (Figure 2c) showed peaks at 1332 cm−1 and 1586 cm−1, MWGONRs (Figure 2d) showed peaks at 1336 cm−1 and 1584 cm−1. GONPs (Figure 2e) showed peaks at 1338 cm−1 and 1574 cm−1. MSNPs (Figure 2f) showed two peaks at 274 cm−1 and 400 cm−1 which can be ascribed to E1g vibration modes in the crystalline MoS2 and its nano-hexagonal structure, respectively [16]. The J2 peak at 230 cm−1 showed presence of 2a⼱ superlattice while the J3 peak at 330 cm−1 is due to structural distortion. The peaks observed at 816 cm−1 and 1000 cm−1 were due to oxysulfide functional groups [17, 41]. For WSNTs (Figure 2g), the peak at 350 cm−1 is due to E2g atomic vibrations for tungsten and sulfur atoms in x-y plane (in opposite directions parallel to x axis), whereas the peak at 420 cm−1 corresponded to A1g vibration mode of sulfur atoms in x-y plane (in opposite directions and parallel to y axis) [16, 42].
Figure 2.

Representative Raman spectra of (a) single walled carbon nanotubes, (b) multiwalled carbon nanotubes, (c) single walled graphene oxide nanoribbons, (d) multi walled graphene oxide nanoribbons, (e) graphene oxide nanoplatelets, (f) molybdenum disulfide nanoplatelets, and (g) tungsten disulfide nanotubes.
3.2 In vitro studies to examine the effects of unreacted macromers
Figure 3 shows the viability of the cells assessed using presto blue assay. This assay exploits the reductive environment of viable cells, and changes the blue-colored resazurin dye into pink-colored resorufin. This alteration indicates cell viability and proliferation [43, 44]. NIH3T3 cells (Figure 3a) showed 8±3%, 63±9% and 100±4% viability, after 24 hours treatment, using 1X, 10X and 100X experimental media, respectively. MC3T3 cells (Figure 3b), after 24 hours, showed 5±3%, 47±5% and 105±4% viability for 1X, 10X and 100X experimental media, respectively. The experimental media of unreacted components followed a dose dependent viability trend (1X<10X and 100X).
Figure 3.

Viability and fraction of dead cells of NIH3T3 (a and c) and MC3T3 cells (b and d), after 24 hour exposure to extracts of components of nanocomposites before crosslinking. Data has been normalized with respect to live and dead controls and error bars represent standard deviations for n=6.
The cytotoxicity results obtained from the LDH assay is shown in Figures 3c and 3d. LDH, a cytoplasmic marker for membrane integrity, provides an indirect means of assessing cytotoxicity. This assay specifically detects change in light absorbance due to the release of LDH enzyme that catalyzes interconversion of pyruvate (NADH) to lactate (NAD+), and vice versa [45]. NIH3T3 cells (Figure 3c) showed 90±5%, 31±8% and 2±5% dead cells for 1X, 10X and 100X experimental media, respectively. After 24 hours, MC3T3 cells (Figure 3d) treated with 1X, 10X and 100X experimental media showed 89±10%, 55±4% and 4±4 % dead cells, respectively. The dose dependent cytotoxicity followed the trend: 1X>10X>100X.
3.3 In vitro studies to examine the effects of crosslinked nanocomposites
Figure 4a and 4b show the results of the presto blue assay. NIH3T3 cells showed greater than 84% viability for all the 1X crosslinked nanocomposites. Cells treated with MWGONR nanocomposites exhibited 103±7% viability (maximum), GONP nanocomposites 84±3% viability (minimum), and PPF control 103±3% viability. Cells treated with 10X and 100X experimental solutions showed ~100% viability for all nanocomposites. MC3T3 cells (Figure 4b) showed more than 78% viability for 1X extracts of crosslinked nanocomposites. Cells treated with MSNP nanocomposites exhibited 89±2% viability (maximum), MWCNT nanocomposites showed 84±3% viability (minimum), and PPF control showed 78±2% viability. Cells treated with 10X and 100X experimental media showed ~100% viability for all nanocomposites. Presto blue results clearly indicated a dose-dependent (1X < 10 and 100 X) viability for crosslinked nanocomposites.
Figure 4.

Viability and fraction of dead cells of NIH3T3 (a and c) and MC3T3 cells (b and d), after 24 hour exposure to extracts of crosslinked nanocomposites. Data has been normalized with respect to live and dead controls and error bars represent standard deviations for n=6. The symbol “*” indicates statistical significant difference between PPF baseline and PPF nanocomposites (p < 0.05).
LDH cytotoxicity assay (Figure 4c) for NIH3T3 cells showed 33±7% cell death (maximum) for MWCNT nanocomposites, 20±5% cell death (minimum) for WSNT nanocomposites and 25±8% cell death for PPF control. 10X and 100X experimental media for all nanocomposites showed negligible (~0%) dead cells. MC3T3 cells (Figure 4d) showed 21±8% (maximum) cell death for MWGONR nanocomposites, 15±7% dead cells (minimum) for WSNT nanocomposites and 11±4% dead cells for PPF control. 10X and 100X experimental media of all nanocomposites showed ~0% dead cells. The LDH results of the crosslinked nanocomposites indicated a dose dependent (1X < 10 and 100 X) cytotoxicity.
3.4 In vitro studies to examine the effects of degradation products
Figure 5 shows the results of the presto blue and LDH assay. NIH3T3 cells in Figure 5a showed more than 23% viability upon treatment with 2X experimental media of degradation products. Cells treated with MSNP nanocomposites showed 48±3% viability (maximum), GONP nanocomposites showed 23±4% viability (minimum), and PPF control showed 38±2% viability. Cells treated with 10X and 100X experimental media showed 76–97% and 89–104% viability, respectively. In general, MC3T3 cells (Figure 5b) showed more than 25% viability after treatment with 2X experimental media. Cells treated with MSNP nanocomposites exhibited 37±6% viability (maximum), MWCNT nanocomposites showed 27±3% viability (minimum), and PPF control showed 37±5% viability. Cells treated with 10X and 100X experimental media showed ~100% viability.
Figure 5.

Viability and fraction of dead cells of NIH3T3 (a and c) and MC3T3 cells (b and d), after 24 hour exposure to extracts of degradation products. Data has been normalized with respect to live and dead controls and error bars represent standard deviations for n=6. The symbol “*” indicates statistical significant difference between PPF baseline and PPF nanocomposites (p < 0.05).
LDH assay results for NIH3T3 cells treated with 2X experimental media (Figure 5c) showed 65±8% dead cells (maximum) for MWCNT nanocomposites, 40±4% dead cells (minimum) for MSNP nanocomposites, and 34±10% dead cells for PPF control. Cells treated with 10X and 100X experimental media showed 4–23% and 3–8% dead cells, respectively. MC3T3 cells (Figure 5d), indicated 77±12% dead cells (maximum) for MWCNT nanocomposites, 62±7% dead cells (minimum) for MSNP nanocomposites, and 67±10% dead cells for PPF control. Cells treated with 10X and 100X experimental solutions showed 7–20% and 2–17% dead cells, respectively.
Osmolarity (Figure 6) of all 2X experimental media used for treating NIH3T3 cells were in range of 250–270 mOsm (significant differences marked with *); significantly lower compared to DMEM media (350 mOsm). Osmolarity of all 2X experimental media used for treating MC3T3 cells were in range of 235–250 mOsm; significantly lower osmolarity compared to MEM-α media (309 mOsm). At 10X and 100X dilutions, osmolarity approached the osmolarity of blank media (350 and 309 mOsm for DMEM and MEM-α, respectively) for both DMEM and MEM-α.
Figure 6.
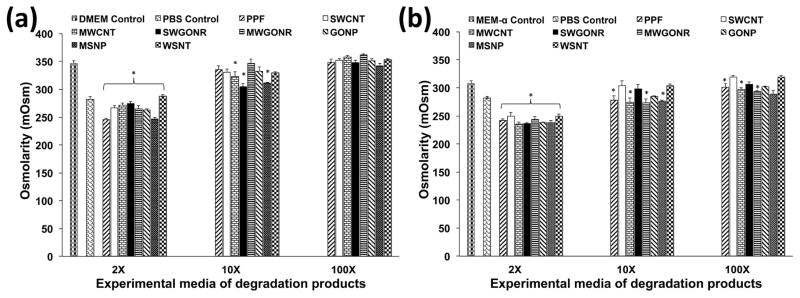
Osmolality of extracts of degradation products used for culture of (a) NIH3T3 and (b) MC3T3 cells. Error bars represent standard deviations for n=3. The symbol “*” indicates statistical significant difference between extracts of degradation products and unaltered cell culture media (p < 0.05).
3.5 In vitro studies to characterize the cell attachment and spreading on crosslinked nanocomposites
The cell attachment on crosslinked nanocomposites was characterized by counting the number of cells using a hemocytometer, after 24 hours of incubation. Figure 7 shows the comparison for the fraction (in percentage) of initial seeded cells that were attached to the nanocomposites. Fraction of adherent NIH3T3 cells (Figure 7a) was between 45–57% on the nanocomposites. The maximum attachment of 57±1% was determined for WSNT nanocomposites and minimum 45±1% for SWCNT nanocomposites. PPF control showed 57±4% cell attachment whereas TCPS positive control showed 90±9% cell attachment. Fraction of the adherent MC3T3 cells (Figure 7b) on the nanocomposites was 40–49% of the initial seeded cells. WSNT nanocomposites showed maximum attachment of 49±4% and SWCNT nanocomposites minimum attachment of 40±2%. MC3T3 cell attachment on PPF and TCPS controls was 46±4% and 93±3%, respectively. Number of attached cells on surface of nanocomposites was significantly lower than TCPS control (marked with ** in Figure 7). Only SWCNT and MWCNT nanocomposites showed a significantly lower cell attachment compared to PPF control (marked with *). Overall, presence of nanomaterials evaluated in this study did not have a significant effect on cell attachment compared to PPF control although a greater number of cells attached to inorganic nanocomposites compared to carbon nanocomposites.
Figure 7.
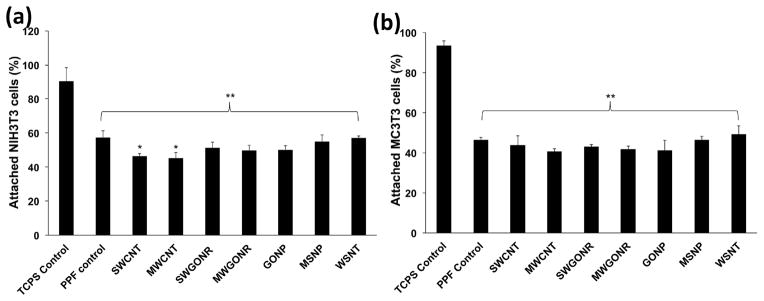
Fraction of attached cells to the tissue culture polystyrene, baseline PPF control and nanocomposites after 24 hour incubation. Initial seeding density was 400,000 cells/specimen (1.2 x 10⁶ cells/cm2). Error bars represent standard deviations for n=3. The symbol “*” indicates statistical significant difference between PPF baseline and PPF nanocomposites. The symbol “**” indicates significant difference between baseline control PPF, PPF nanocomposites and TCPS (p < 0.05).
Cell attachment and spreading on various nanocomposites was further characterized using confocal fluorescence imaging (Figure 8) and SEM (Figure 9). For the fluorescence characterization, calcein-AM dye was used to stain the cells. This dye is a marker for intracellular esterase activity of viable cells indicated by enhanced green fluorescence [45]. After 5 days of incubation, stained NIH3T3 and MC3T3 cells showed viability, attachment and spreading on the nanocomposite surfaces similar to TCPS control (Figure 8a). Attachment of cells was also observed after 1 day incubation (supplementary information, Figure 2S). Circular shape of the cells and incomplete spreading on the surface suggested that additional incubation time was needed to allow the cells to completely spread.
Figure 8.

Representative fluorescent microscopy images of attached cells on crosslinked nanocomposites after 5 days of cell culture for NIH3T3 (a–j) and MC3T3 (k–t) cells, respectively: (a, k) tissue culture polystyrene (positive) control, (b, l) negative control, (c, m) ly(propylene fumarate) control, (d, n) graphene oxide nanoplatelets (e, o) multi walled carbon nanotubes, (f, p) single walled carbon nanotubes, (g, q) multi walled graphene oxide nanoribbons, (h, r) single walled graphene oxide nanoribbons, (i, s) tungsten disulfide nanotubes and (j, t) molybdenum disulfide nanoplatelets nanocomposites.
Figure 9.
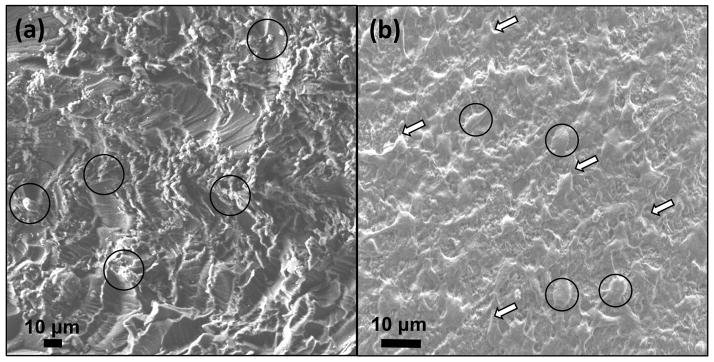
Representative SEM images of graphene oxide nanoplatelet nanocomposite after cell culture for (a) 1 and (b) 5 days (cell bodies are marked with black circles and their filopodia extensions are marked with black arrows. ECM is marked with white arrows).
SEM analysis in Figure 9 provided more details regarding the cell attachment and spreading on the surface of nanocomposites. As seen in Figure 9a, after 24 hours incubation, although the cells were attached to the surface of nanocomposite, the surface of nanocomposite was partially covered by round cells (marked with black circles in Figure 9a and b). Filopodia extensions (black arrows in Figure 9b) and extra cellular matrix (ECM) formation (white arrows in Figure 9b) was more clearly observed under SEM after incubations for 5 days.
4. Discussions
The objective of this study was to systematically evaluate the in vitro cytotoxicity of PPF nanocomposites incorporated with various 1-D and 2-D carbon (SWCNTs, MWCNTs. SWGONRs, MWGONRs and GONPs) and inorganic (WSNTs and MSNPs) nanomaterials. The loading concentration of each nanomaterial was the concentration that showed maximum reinforcement of PPF polymer in our previous studies [16, 17]. The adherent NIH3T3 fibroblast-like cells [46, 47] and MC3T3 osteoblast precursor cells [48, 49] used in this study are widely accepted for in vitro cytotoxicity testing of materials of orthopedic or bone tissue engineering applications. In vitro cytotoxicity studies were performed before crosslinking, after crosslinking, and after accelerated degradation of the nanocomposites. While cytotoxicity of crosslinked nanocomposites and their degradation products is necessary to obtain insights into the possible response of the nanocomposites post-implantation [50], assessment of cytotoxicity of nanocomposite components before crosslinking is necessary because these components would interact with tissues when injected into bone defect sites [26, 51].
Presto blue and LDH assays were performed using a cell density of 5000 cells per well. Since these are absorbance-based assays, we used 5000 cells per well to prevent the saturation of the detector of the plate reader and to maintain absorbance values in the linear detectable range. Presto blue and LDH assays are routinely performed using these cell densities for sensitivity purposes [23]. Previous studies suggest that PPF and PPF nanocomposites show ~50% initial cell attachment (after 24 hours) that increases at later time points [29]. Therefore, in this study, an initial seeding density of 400,000 cells per specimen was used to ensure good cell attachment for SEM imaging. Fluorescence imaging was performed after days 1 and 5 of initial cell seeding. Considering the proliferation of cells, a significantly higher cell number is expected on nanocomposite specimens after 5 days of incubation. Therefore, to ensure good fluorescence staining and to eliminate saturation effects a cell seeding density of 100000 cells per specimen was used for calcein-AM based fluorescence imaging.
4.1 Characterization of polymer and nanomaterials
Structural (TEM) and chemical (Raman spectroscopy) characterizations of the nanomaterials were performed prior to cell studies. TEM (Figure 1) confirmed the tubular morphology of SWCNTs, MWCNTs, and WSNTs; ribbon-shaped morphology of SWGONRs and MWGONRs; disc-shaped morphology of GONPs and hexagonal morphology of MSNPs [12, 16, 23, 52, 53]. Raman spectroscopy analysis (Figure 2) of SWCNT and MWCNTs showed low intensity ratio of D to G bands (ID/IG), which implies absence of defects or functional groups on the external carbon sheet. SWGONRs, MWGONRs, and GONPs showed an increase in the intensity ratio of D to G bands (ID/IG), which implies the presence of defects and functional groups that disrupt the sp2 π-bonds of carbon atoms [39, 40].
4.2 In vitro studies to examine the effects of unreacted macromers
As seen in Figure 3, the cytotoxic effects of unreacted components decreased in a dose-dependent manner after 24 hours of incubation. For applications that will employ in situ crosslinking of PPF nanocomposites, the crosslinking reaction time will be a few minutes. In such a scenario, the toxic, leachable components will be minimal. The three components in the uncrosslinked nanocomposites are PPF, nanomaterials and NVP crosslinker. Previous reports show that PPF complete coats the nanomaterials [16–18, 29]. Thus, small PPF oligomers and NVP crosslinker would be the only components that will directly interact with cells in the first 24 hours. Therefore, only PPF/NVP blends were used for preparation of the experimental media. Our results are similar to a previous study that attributed the dose dependent cytotoxicity mainly to the unreacted crosslinker [26].
4.3 In vitro studies to examine the effects of crosslinked nanocomposites
The high cell viability and low cell death (Figure 4) observed for 1X, 10X and 100X experimental media of all the crosslinked nanocomposites suggests that improved crosslinking prevented the leaching of potentially toxic components (such as unreacted NVP crosslinker [54] and BP radical initiator residue [55, 56]) during media extraction process. Indeed, all but SWGONR crosslinked nanocomposites, had previously exhibited increased crosslinking densities compared to PPF. SWCNT, MWCNT, SWGONR, MWGONR, GONP, MSNP and WSNT nanocomposites had shown 87±2%, 86±2%, 84±1%, 89±1%, 88±1%, 92±1% and 92%±2 crosslinking density compared to 84±2% crosslinking density for PPF polymer, respectively [16, 17].
4.4 In vitro studies to examine the effects of degradation products
The effects of the degradation components of the nanocomposites on cells during its gradual biodegradation is a necessary factor that needs to examined for the eventual use of the nanocomposites for in vivo applications. PPF [57] and the carbon nanomaterials have been shown to undergo biodegradation [58]. However, PPF undergoes hydrolytic degradation while carbon nanomaterials can be degraded by oxidative reactions in the presence or absence of enzymes [58, 59]. The degradation of the inorganic nanomaterials still needs to be examined. Crosslinked PPF degrades very slowly, thus an accelerated degradation method is typically employed that hydrolyses the PPF network in one week [18]. Earlier reports employed NaOH and HCl to accelerate the hydrolysis of ester bonds in PPF/propylene fumarate-diacrylate (PF-DA). This process caused substantial increase in the osmolarity [28]. It is well known that high osmolarity could be cytotoxic [60, 61], and thus, it would be difficult to differentiate if any observed toxicity is due the degraded components or high osmolarity. Thus, weaker degrading agents such as calcium hydroxide (Ca(OH)2) and phosphoric acid (H3PO4) that produce insoluble Ca3(PO4)2 salt crystals after neutralization were used to resolve this issue. Unlike NaCl that undergoes complete ionization and increases osmolarity to values higher than 1000 mOsm [27, 60] (compared to plasma osmolarity of 282–295 mOsm), Ca3(PO4)2 partially ionizes resulting in lower osmolality (235–270 mOsm) of the extracts of degradation products.
In this study, the nanomaterials were present at concentrations of ≤ 0.2 wt. %. Thus, given what is known about degradation mechanism of the nanomaterials, and their presence in the polymer matrix at low concentration, the major degradation product that would have an adverse effect on cells would be fumaric acid generated from PPF. The degradation products of PPF, have been previously shown to elicit dose dependent cytotoxicity [26, 27]. Since the dose dependent cell viability and cell death results in Figure 6 are similar to those studies, we hypothesize the degradation products of PPF are mainly responsible for the observed dose dependent cytotoxicity. This low osmolarity could also contribute partially to the cytotoxicity results since contact with solutions of lower osmolality brings about damages in cell membrane due to changes in cell volume.
4.5 In vitro studies to characterize the cell attachment and spreading on crosslinked nanocomposites
The cell attachment and spreading of the nanocomposites were similar to PPF and lower compared to TCPS control (Figure 7). The increased cell attachment on TCPS control is due to the negatively charged surface of the TCPS plate that results in better cell spreading and attachment. Variations in the numbers of cells attached to nanocomposites compared to PPF control (Figure 6) maybe due to different opposing factors that affect cell attachment: nanomaterials (such as MWCNTs [62]) result in better adsorption of cell attachment proteins [63, 64], but presence of attachment inhibitors such as insoluble poly (vinyl pyrrolidone) [26] and bundled nanomaterials [65] hinders cell attachment. In addition to the high density of cells on all nanocomposite surfaces (comparable to PPF control), significant cellular attachment and expansion observed after 5 days (Figures 8a and 8b) compared to day 1 (Figure S2) is the reason for the increased deposition of ECM components on the surface of nanocomposites. As SEM micrograph in Figure 9 showed, formation of ECM (marked with white arrows) provided a matrix for further cell spreading and proliferation [66].
To the best of our knowledge, this is the first report that investigates and compares the in vitro cytocompatibility of various 1-D and 2-D carbon and inorganic nanomaterial incorporated polymeric nanocomposites for bone tissue engineering. As mentioned above, the loading concentration of each nanomaterial was one that showed maximum reinforcement of PPF polymer in our previous studies [16, 17]. Thus, even though loading concentrations of all the nanomaterials were low (≤ 0.2 wt. %), they were not similar. An initial minor cytotoxicity response and lower cell attachment was observed only for a few nanocomposite groups, none of the nanocomposites showed significant differences in cellular response to the various forms (uncrosslinked, crosslinked and degraded) of the nanocomposites compared to PPF control at later time points. The above favorable in vitro results suggest that all these nanocomposites under these efficacious (enhanced mechanical properties compared to PPF) loading concentrations are suitable for in vivo bone replacement therapies.
5. Conclusions
Nanocomposites fabricated using biodegradable polymer poly (propylene fumarate), crosslinking agent N-vinyl pyrrolidone (NVP) and one- and two-dimensional (1-D and 2-D) nanomaterials: single- and multi- walled carbon nanotubes, single- and multi- walled graphene oxide nanoribbons, graphene oxide nanoplatelets, molybdenum disulfide nanoplatelets, or tungsten disulfide nanotubes at loading concentrations between 0.02–0.2 weight percent do not show significant differences in cellular response to their various forms (uncrosslinked, crosslinked and degraded) compared to PPF control. The extraction media of the uncrosslinked components elicit a significant dose-dependent cytotoxic effect. The extraction media of the crosslinked nanocomposite do not adversely affect viability of NIH3T3 and MC3T3 cells. Cells attached, proliferated and spread well on all the nanocomposite surfaces. The degradation products of nanocomposites induce a mild dose-dependent cytotoxic response. The results demonstrate that all the nanocomposites have favorable in vitro cytocompatibility and could be considered further as implants for bone tissue engineering applications.
Supplementary Material
Acknowledgments
This work was sponsored by National Institute of Health (Grant No. 1DP2OD007394-01). Research was carried out in part at the Center for Functional Nanomaterials, Brookhaven National Laboratory (Upton, New York, USA) supported by the U.S. Department of Energy (DOE), office of basic energy sciences, under Contract No. DE-AC02-98CH10886.
References
- 1.Sabir MI, Xu X, Li L. A review on biodegradable polymeric materials for bone tissue engineering applications. Journal of Materials Science. 2009;44:5713–24. [Google Scholar]
- 2.PETER SJ, MILLER MJ, YASZEMSKI MJ, MIKOS AG. 5. POLYPROPYLENE FUMARATE) Handbook of biodegradable polymers. 1998;7:87. [Google Scholar]
- 3.Santerre J, Woodhouse K, Laroche G, Labow R. Understanding the biodegradation of polyurethanes: from classical implants to tissue engineering materials. Biomaterials. 2005;26:7457–70. doi: 10.1016/j.biomaterials.2005.05.079. [DOI] [PubMed] [Google Scholar]
- 4.Hyon SH, Jin F, Jamshidi K, Tsutsumi S, Kanamoto T. Biodegradable ultra high strength poly (L-lactide) rods for bone fixation. Macromolecular Symposia: Wiley Online Library. 2003:355–68. [Google Scholar]
- 5.Middleton JC, Tipton AJ. Synthetic biodegradable polymers as orthopedic devices. Biomaterials. 2000;21:2335–46. doi: 10.1016/s0142-9612(00)00101-0. [DOI] [PubMed] [Google Scholar]
- 6.He S, Timmer M, Yaszemski M, Yasko A, Engel P, Mikos A. Synthesis of biodegradable poly (propylene fumarate) networks with poly (propylene fumarate)–diacrylate macromers as crosslinking agents and characterization of their degradation products. Polymer. 2001;42:1251–60. [Google Scholar]
- 7.Suggs LJ, Shive MS, Garcia CA, Anderson JM, Mikos AG. In vitro cytotoxicity and in vivo biocompatibility of poly (propylene fumarate-co-ethylene glycol) hydrogels. Journal of biomedical materials research. 1999;46:22–32. doi: 10.1002/(sici)1097-4636(199907)46:1<22::aid-jbm3>3.0.co;2-r. [DOI] [PubMed] [Google Scholar]
- 8.Shi X, Mikos AG. Poly (propylene fumarate) CRC Press; Boca Raton, FL: 2006. [Google Scholar]
- 9.He S, Yaszemski JM, Yasko AW, Engel PS, Mikos AG. Injectable biodegradable polymer composites based on poly (propylene fumarate) crosslinked with poly (ethylene glycol)-dimethacrylate. Biomaterials. 2000;21:2389–94. doi: 10.1016/s0142-9612(00)00106-x. [DOI] [PubMed] [Google Scholar]
- 10.Suggs LJ, West JL, Mikos AG. Platelet adhesion on a bioresorbable poly (propylene fumarate-co-ethylene glycol) copolymer. Biomaterials. 1999;20:683–90. doi: 10.1016/s0142-9612(98)00226-9. [DOI] [PubMed] [Google Scholar]
- 11.Engh C, Bobyn J, Glassman A. Porous-coated hip replacement. The factors governing bone ingrowth, stress shielding, and clinical results. Journal of Bone & Joint Surgery, British Volume. 1987;69:45–55. doi: 10.1302/0301-620X.69B1.3818732. [DOI] [PubMed] [Google Scholar]
- 12.Lalwani G, Sitharaman B. Multifunctional Fullerene-and Metallofullerene-Based Nanobiomaterials. Nano LIFE. 2013;3:1342003-1–22. [Google Scholar]
- 13.Coleman JN, Khan U, Gun’ko YK. Mechanical reinforcement of polymers using carbon nanotubes. Advanced Materials. 2006;18:689–706. [Google Scholar]
- 14.Mistry AS, Cheng SH, Yeh T, Christenson E, Jansen JA, Mikos AG. Fabrication and in vitro degradation of porous fumarate-based polymer/alumoxane nanocomposite scaffolds for bone tissue engineering. Journal of Biomedical Materials Research Part A. 2009;89:68–79. doi: 10.1002/jbm.a.32010. [DOI] [PubMed] [Google Scholar]
- 15.Balasundaram G, Webster TJ. An Overview of Nano-Polymers for Orthopedic Applications. Macromolecular bioscience. 2007;7:635–42. doi: 10.1002/mabi.200600270. [DOI] [PubMed] [Google Scholar]
- 16.Lalwani G, Henslee AM, Farshid B, Parmar P, Lin L, Qin Y-X, et al. Tungsten disulfide nanotubes reinforced biodegradable polymers for bone tissue engineering. Acta Biomaterialia. 2013;9:8365–73. doi: 10.1016/j.actbio.2013.05.018. [DOI] [PMC free article] [PubMed] [Google Scholar]
- 17.Lalwani G, Henslee AM, Farshid B, Lin L, Kasper FK, Qin Y-X, et al. Two-Dimensional Nanostructure-Reinforced Biodegradable Polymeric Nanocomposites for Bone Tissue Engineering. Biomacromolecules. 2013;14:900–9. doi: 10.1021/bm301995s. [DOI] [PMC free article] [PubMed] [Google Scholar]
- 18.Shi X, Sitharaman B, Pham QP, Spicer PP, Hudson JL, Wilson LJ, et al. In vitro cytotoxicity of single-walled carbon nanotube/biodegradable polymer nanocomposites. Journal of Biomedical Materials Research Part A. 2008;86A:813–23. doi: 10.1002/jbm.a.31671. [DOI] [PubMed] [Google Scholar]
- 19.Wang X, Jia G, Wang H, Nie H, Yan L, Deng X, et al. Diameter effects on cytotoxicity of multi-walled carbon nanotubes. Journal of nanoscience and nanotechnology. 2009;9:3025–33. doi: 10.1166/jnn.2009.025. [DOI] [PubMed] [Google Scholar]
- 20.Akhavan O, Ghaderi E, Akhavan A. Size-dependent genotoxicity of graphene nanoplatelets in human stem cells. Biomaterials. 2012;33:8017–25. doi: 10.1016/j.biomaterials.2012.07.040. [DOI] [PubMed] [Google Scholar]
- 21.Talukdar Y, Rashkow JT, Lalwani G, Kanakia S, Sitharaman B. The effects of graphene nanostructures on mesenchymal stem cells. Biomaterials. 2014;35:4863–77. doi: 10.1016/j.biomaterials.2014.02.054. [DOI] [PMC free article] [PubMed] [Google Scholar]
- 22.Chang Y, Yang S-T, Liu J-H, Dong E, Wang Y, Cao A, et al. In vitro toxicity evaluation of graphene oxide on A549 cells. Toxicology Letters. 2011;200:201–10. doi: 10.1016/j.toxlet.2010.11.016. [DOI] [PubMed] [Google Scholar]
- 23.Mullick Chowdhury S, Lalwani G, Zhang K, Yang JY, Neville K, Sitharaman B. Cell specific cytotoxicity and uptake of graphene nanoribbons. Biomaterials. 2013;34:283–93. doi: 10.1016/j.biomaterials.2012.09.057. [DOI] [PMC free article] [PubMed] [Google Scholar]
- 24.Wu H, Yang R, Song B, Han Q, Li J, Zhang Y, et al. Biocompatible inorganic fullerene-like molybdenum disulfide nanoparticles produced by pulsed laser ablation in water. ACS nano. 2011;5:1276–81. doi: 10.1021/nn102941b. [DOI] [PubMed] [Google Scholar]
- 25.Pardo M, Shuster-Meiseles T, Levin-Zaidman S, Rudich A, Rudich Y. Low Cytotoxicity of Inorganic Nanotubes and Fullerene-Like Nanostructures in Human Bronchial Epithelial Cells: Relation to Inflammatory Gene Induction and Antioxidant Response. Environmental science & technology. 2014;48:3457–66. doi: 10.1021/es500065z. [DOI] [PubMed] [Google Scholar]
- 26.Timmer MD, Shin H, Horch RA, Ambrose CG, Mikos AG. In vitro cytotoxicity of injectable and biodegradable poly (propylene fumarate)-based networks: unreacted macromers, cross-linked networks, and degradation products. Biomacromolecules. 2003;4:1026–33. doi: 10.1021/bm0300150. [DOI] [PubMed] [Google Scholar]
- 27.Shi X, Sitharaman B, Pham QP, Spicer PP, Hudson JL, Wilson LJ, et al. In vitro cytotoxicity of single-walled carbon nanotube/biodegradable polymer nanocomposites. Journal of Biomedical Materials Research Part A. 2008;86:813–23. doi: 10.1002/jbm.a.31671. [DOI] [PubMed] [Google Scholar]
- 28.Sitharaman B, Shi X, Walboomers XF, Liao H, Cuijpers V, Wilson LJ, et al. In vivo biocompatibility of ultra-short single-walled carbon nanotube/biodegradable polymer nanocomposites for bone tissue engineering. Bone. 2008;43:362–70. doi: 10.1016/j.bone.2008.04.013. [DOI] [PubMed] [Google Scholar]
- 29.Shi X, Sitharaman B, Pham QP, Liang F, Wu K, Edward Billups W, et al. Fabrication of porous ultra-short single-walled carbon nanotube nanocomposite scaffolds for bone tissue engineering. Biomaterials. 2007;28:4078–90. doi: 10.1016/j.biomaterials.2007.05.033. [DOI] [PMC free article] [PubMed] [Google Scholar]
- 30.Mistry AS, Pham QP, Schouten C, Yeh T, Christenson EM, Mikos AG, et al. In vivo bone biocompatibility and degradation of porous fumarate-based polymer/alumoxane nanocomposites for bone tissue engineering. Journal of Biomedical Materials Research Part A. 2010;92:451–62. doi: 10.1002/jbm.a.32371. [DOI] [PMC free article] [PubMed] [Google Scholar]
- 31.Mistry AS, Mikos AG, Jansen JA. Degradation and biocompatibility of a poly (propylene fumarate)-based/alumoxane nanocomposite for bone tissue engineering. Journal of Biomedical Materials Research Part A. 2007;83:940–53. doi: 10.1002/jbm.a.31280. [DOI] [PubMed] [Google Scholar]
- 32.Armentano I, Dottori M, Puglia D, Kenny JM. Effects of carbon nanotubes (CNTs) on the processing and in-vitro degradation of poly (DL-lactide-co-glycolide)/CNT films. Journal of Materials Science: Materials in Medicine. 2008;19:2377–87. doi: 10.1007/s10856-007-3276-2. [DOI] [PubMed] [Google Scholar]
- 33.Yoon OJ, Jung CY, Sohn IY, Kim HJ, Hong B, Jhon MS, et al. Nanocomposite nanofibers of poly (d, l-lactic-co-glycolic acid) and graphene oxide nanosheets. Composites Part A: Applied Science and Manufacturing. 2011;42:1978–84. [Google Scholar]
- 34.Jing X, Mi HY, Salick MR, Peng XF, Turng LS. Polymer Composites. 2013. Preparation of thermoplastic polyurethane/graphene oxide composite scaffolds by thermally induced phase separation. [Google Scholar]
- 35.Kasper FK, Tanahashi K, Fisher JP, Mikos AG. Synthesis of poly (propylene fumarate) Nature protocols. 2009;4:518–25. doi: 10.1038/nprot.2009.24. [DOI] [PMC free article] [PubMed] [Google Scholar]
- 36.Kosynkin DV, Higginbotham AL, Sinitskii A, Lomeda JR, Dimiev A, Price BK, et al. Longitudinal unzipping of carbon nanotubes to form graphene nanoribbons. Nature. 2009;458:872–6. doi: 10.1038/nature07872. [DOI] [PubMed] [Google Scholar]
- 37.Lalwani G, Sundararaj JL, Schaefer K, Button T, Sitharaman B. Synthesis, characterization, in vitro phantom imaging, and cytotoxicity of a novel graphene-based multimodal magnetic resonance imaging-X-ray computed tomography contrast agent. Journal of Materials Chemistry B. 2014;2:3519–30. doi: 10.1039/C4TB00326H. [DOI] [PMC free article] [PubMed] [Google Scholar]
- 38.Castro-Guerrero CF, Deepak FL, Ponce A, Cruz-Reyes J, Del Valle-Granados M, Fuentes-Moyado S, et al. Structure and catalytic properties of hexagonal molybdenum disulfide nanoplates. Catalysis Science & Technology. 2011;1:1024–31. [Google Scholar]
- 39.Malard L, Pimenta M, Dresselhaus G, Dresselhaus M. Raman spectroscopy in graphene. Physics Reports. 2009;473:51–87. [Google Scholar]
- 40.Iqbal M, Singh AK, Iqbal M, Eom J. Raman fingerprint of doping due to metal adsorbates on graphene. Journal of Physics: Condensed Matter. 2012;24:335301. doi: 10.1088/0953-8984/24/33/335301. [DOI] [PubMed] [Google Scholar]
- 41.Bar-Sadan M, Enyashin A, Gemming S, Popovitz-Biro R, Hong S, Prior Y, et al. Structure and stability of molybdenum sulfide fullerenes. The Journal of Physical Chemistry B. 2006;110:25399–410. doi: 10.1021/jp0644560. [DOI] [PubMed] [Google Scholar]
- 42.Rothschild A, Frey G, Homyonfer M, Tenne R, Rappaport M. Synthesis of bulk WS2 nanotube phases. Material Research Innovations. 1999;3:145–9. [Google Scholar]
- 43.Butterick TA, Nixon JP, Pérez-Leighton CE, Billington CJ, Kotz CM. Society for Neuroscience Abstracts 2011, Online. Washington, DC: 2011. Orexin A influences lipid peroxidation and neuronal metabolic status in a novel immortalized hypothalamic cell line; p. 88. [Google Scholar]
- 44.Bueno C, Villegas ML, Bertolotti SG, Previtali CM, Neumann MG, Encinas MV. The Excited-State Interaction of Resazurin and Resorufin with Aminesin Aqueous Solutions. Photophysics and Photochemical Reaction¶. Photochemistry and Photobiology. 2002;76:385–90. doi: 10.1562/0031-8655(2002)076<0385:tesior>2.0.co;2. [DOI] [PubMed] [Google Scholar]
- 45.Decker T, Lohmann-Matthes M-L. A quick and simple method for the quantitation of lactate dehydrogenase release in measurements of cellular cytotoxicity and tumor necrosis factor (TNF) activity. Journal of Immunological Methods. 1988;115:61–9. doi: 10.1016/0022-1759(88)90310-9. [DOI] [PubMed] [Google Scholar]
- 46.Lee Y, Geckeler KE. Cytotoxicity and cellular uptake of lysozyme-stabilized gold nanoparticles. Journal of Biomedical Materials Research Part A. 2012;100:848–55. doi: 10.1002/jbm.a.34020. [DOI] [PubMed] [Google Scholar]
- 47.Zhao H, Zhu B, Sekine J, Luo S-C, Yu H-h. Oligoethylene-Glycol-Functionalized Polyoxythiophenes for Cell Engineering: Syntheses, Characterizations, and Cell Compatibilities. ACS applied materials & interfaces. 2012;4:680–6. doi: 10.1021/am2012905. [DOI] [PubMed] [Google Scholar]
- 48.Wang K, Cai L, Jesse S, Wang S. Poly (ε-caprolactone)-Banded Spherulites and Interaction with MC3T3-E1 Cells. Langmuir. 2012;28:4382–95. doi: 10.1021/la205162d. [DOI] [PubMed] [Google Scholar]
- 49.Sahoo NG, Pan YZ, Li L, He CB. Nanocomposites for bone tissue regeneration. Nanomedicine. 2013;8:639–53. doi: 10.2217/nnm.13.44. [DOI] [PubMed] [Google Scholar]
- 50.Liu H, Webster TJ. Nanomedicine for implants: A review of studies and necessary experimental tools. Biomaterials. 2007;28:354–69. doi: 10.1016/j.biomaterials.2006.08.049. [DOI] [PubMed] [Google Scholar]
- 51.Sitharaman B, Shi X, Tran LA, Spicer PP, Rusakova I, Wilson LJ, et al. Injectable in situ cross-linkable nanocomposites of biodegradable polymers and carbon nanostructures for bone tissue engineering. Journal of Biomaterials Science, Polymer Edition. 2007;18:655–71. doi: 10.1163/156856207781034133. [DOI] [PubMed] [Google Scholar]
- 52.Sitharaman B, Shi X, Walboomers XF, Liao H, Cuijpers V, Wilson LJ, et al. In vivo biocompatibility of ultra-short single-walled carbon nanotube/biodegradable polymer nanocomposites for bone tissue engineering. Bone. 2008;43:362–70. doi: 10.1016/j.bone.2008.04.013. [DOI] [PubMed] [Google Scholar]
- 53.Lalwani G, Kwaczala AT, Kanakia S, Patel SC, Judex S, Sitharaman B. Fabrication and characterization of three-dimensional macroscopic all-carbon scaffolds. Carbon. 2013;53:90–100. doi: 10.1016/j.carbon.2012.10.035. [DOI] [PMC free article] [PubMed] [Google Scholar]
- 54.Timmer MD, Ambrose CG, Mikos AG. In vitro degradation of polymeric networks of poly (propylene fumarate) and the crosslinking macromer poly (propylene fumarate)-diacrylate. Biomaterials. 2003;24:571–7. doi: 10.1016/s0142-9612(02)00368-x. [DOI] [PubMed] [Google Scholar]
- 55.Swauger JE, Dolan PM, Zweier JL, Kuppusamy P, Kensler TW. Role of the benzoyloxyl radical in DNA damage mediated by benzoyl peroxide. Chemical research in toxicology. 1991;4:223–8. doi: 10.1021/tx00020a016. [DOI] [PubMed] [Google Scholar]
- 56.Cameron G, Bryce W, McWalter I. Thermal degradation of polystyrene—5. Effects of initiator residues. European polymer journal. 1984;20:563–9. [Google Scholar]
- 57.Timmer MD, Ambrose CG, Mikos AG. Evaluation of thermal-and photo-crosslinked biodegradable poly (propylene fumarate)-based networks. Journal of Biomedical Materials Research Part A. 2003;66:811–8. doi: 10.1002/jbm.a.10011. [DOI] [PubMed] [Google Scholar]
- 58.Kotchey GP, Hasan SA, Kapralov AA, Ha SH, Kim K, Shvedova AA, et al. A Natural Vanishing Act: The Enzyme-Catalyzed Degradation of Carbon Nanomaterials. Accounts of Chemical Research. 2012;45:1770–81. doi: 10.1021/ar300106h. [DOI] [PMC free article] [PubMed] [Google Scholar]
- 59.Xing W, Lalwani G, Rusakova I, Sitharaman B. Degradation of Graphene by Hydrogen Peroxide. Particle & Particle Systems Characterization. 2014;31:745–50. [Google Scholar]
- 60.Waymouth C. Osmolality of mammalian blood and of media for culture of mammalian cells. In vitro. 1970;6:109–27. doi: 10.1007/BF02616113. [DOI] [PubMed] [Google Scholar]
- 61.Higgins CB, Sovak M, Schmidt WS, Kelley MJ, Newell JD. Direct myocardial effects of intracoronary administration of new contrast materials with low osmolality. Investigative radiology. 1980;15:39–46. doi: 10.1097/00004424-198001000-00007. [DOI] [PubMed] [Google Scholar]
- 62.Ge C, Du J, Zhao L, Wang L, Liu Y, Li D, et al. Binding of blood proteins to carbon nanotubes reduces cytotoxicity. Proceedings of the National Academy of Sciences. 2011;108:16968–73. doi: 10.1073/pnas.1105270108. [DOI] [PMC free article] [PubMed] [Google Scholar]
- 63.Khang D, Kim SY, Liu-Snyder P, Palmore GTR, Durbin SM, Webster TJ. Enhanced fibronectin adsorption on carbon nanotube/poly (carbonate) urethane: independent role of surface nano-roughness and associated surface energy. Biomaterials. 2007;28:4756–68. doi: 10.1016/j.biomaterials.2007.07.018. [DOI] [PubMed] [Google Scholar]
- 64.Kane RS, Stroock AD. Nanobiotechnology: Protein-Nanomaterial Interactions. Biotechnology progress. 2007;23:316–9. doi: 10.1021/bp060388n. [DOI] [PubMed] [Google Scholar]
- 65.Cui D, Tian F, Ozkan CS, Wang M, Gao H. Effect of single wall carbon nanotubes on human HEK293 cells. Toxicology letters. 2005;155:73–85. doi: 10.1016/j.toxlet.2004.08.015. [DOI] [PubMed] [Google Scholar]
- 66.Bryant SJ, Anseth KS. Controlling the spatial distribution of ECM components in degradable PEG hydrogels for tissue engineering cartilage. Journal of Biomedical Materials Research Part A. 2003;64:70–9. doi: 10.1002/jbm.a.10319. [DOI] [PubMed] [Google Scholar]
Associated Data
This section collects any data citations, data availability statements, or supplementary materials included in this article.