Abstract
An interstitial diffuse optical tomography (iDOT) system with multiple light diffusers and isotropic detectors has been developed to characterize the optical properties of prostate gland during photodynamic therapy (PDT). During the data acquisition, linear or point sources and detectors are inserted into the prostate gland, sequentially, and controlled by a motorized system. For our continuous-wave (CW) iDOT system, CW measurements of optical signal are made, and the spatial distributions of light fluence rate can be described by the CW diffusion equation. Optical properties (absorption and reduced scattering coefficients) of the prostate gland are reconstructed by solving the inverse problem with the use of an adjoint model based on the CW diffusion equation. To exam our methodology, two and three dimensional mathematical prostate phantoms including anomalies with known optical properties is prepared and we compare the absorption and reduced scattering images reconstructed for the phantom with the known results. In the end, we discuss the issue of reconstruction of optical properties using human patient data.
Keywords: Photodynamic therapy, reconstruction, optical properties, diffusion therapy, DOT
1. INTRODUCTION
Light, photosensitizer and oxygen are the major elements of Photodynamic therapy (PDT) [1], and the therapeutic efficacy of PDT significantly depends on the understanding of light diffusion, sensitizer concentration and distribution, and oxygen transport and consumption mechanism during treatment. With the implementation of interstitial diffuse optical tomography, the optical properties of tumor tissue can be reconstructed spatially using inverse algorithm. Accurately characterizing the abnormal optical properties of tumor in both spatial distribution and absolute value is an important subject to improve in vivo light dosimetry. Further, the spatially-resolved hemoglobin oxygen saturation and sensitizer distribution are expected to be established with the reconstructed optical properties [2].
Prostate cancer is the most common cancer expected to occur in men and is also the second leading cause of cancer death in year 2007 among American male population [3]. In addition, there is a need for fast and cheap diagnostic tool. An interstitial diffuse optical tomography (iDOT) system with multiple light diffusers and isotropic detectors has been developed to characterize the optical properties of prostate gland during photodynamic therapy (PDT). Several catheters paralleled with each other are inserted into prostate. Inside the catheters, there are light sources and detectors. For each source position, the isotropic detectors scan and record the light fluence rate distribution in the direction along with the catheter axis. The movement of the sources and detectors are driven by a motorized system and controlled by a in-home control program written in Visual Basic. For our continuous-wave (CW) iDOT system, the spatial distributions of light fluence rate can be described by the steady state diffusion equation. Optical properties (absorption and reduced scattering coefficients), of the prostate gland are reconstructed by solving the inverse problem with the use of an adjoint model based on the CW diffusion equation. Unlike our prior studies [4–7], we concentrate on the use of NIRFAST [2] for solving the inverse problem for the data obtained using linear and point sources. To exam our methodology, two dimensional mathematical phantom with linear source and three dimensional phantom with point sources with known optical properties are prepared and we compare the absorption and reduced scattering images reconstructed for the phantom with the known results.
2. METHODS
2.1 Reconstruction procedures for CW iDOT
Fig. 1 shows a standard procedure we used for the reconstruction of optical properties for the CW iDOT system. In the first step, prostate contour is obtained from computer tomography or ultrasound image modality. We then input the contour, and the inserting locations of sources and detectors into COMSOL 3.4 (COMSOL AB, SE-111 40, Stockholm, Sweden) to generate mesh (Fig. 5) for the subsequent finite element method (FEM) calculation for 2D or 3D cases. In next step, the measured fluence rate data (ϕm) at each location is analyzed by the program coded in MATLAB (MathWorks, Inc., Natick, MA, United States), and used for the following reconstruction algorithm.
Fig. 1.
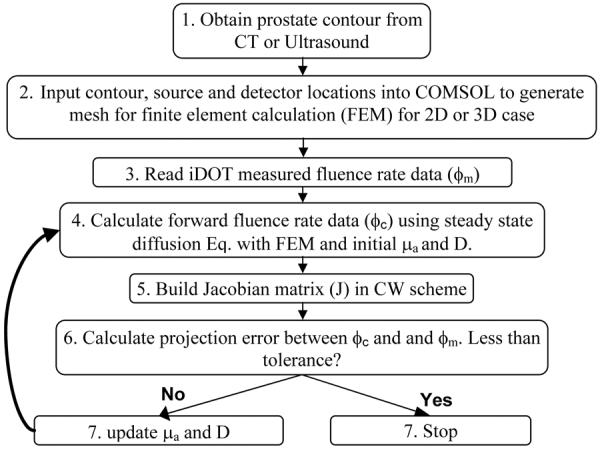
Flowchart of reconstruction procedures for CW iDOT.
Fig. 5.
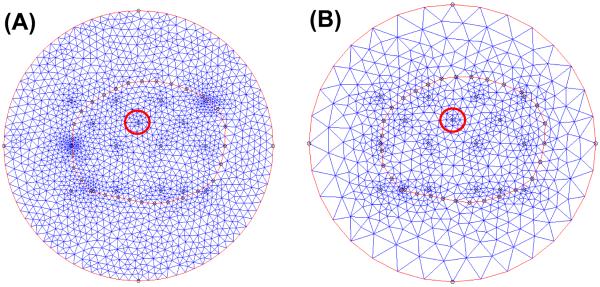
(A) COMSOL-generated mesh used for simulated data. (B) COMSOL-generated mesh used in the forward calculation in reconstruction procedures (Fig. 1 Step 4).
The goal of the steps 4 to 7 (Fig. 1) is to recover the optical properties at each finite element mesh node using the fluence rate data ϕm measured interstitially. The NIRFAST provided by Dr. Hamid Dehghani and Dr. Brian Pogue et al. [2] has been chosen as the software package and modified for our CW reconstruction purpose. In step 4, the fluence rate data in forward calculation (ϕc) is generated using finite element method and based on the steady state light diffusion equation,
| (1) |
with a set of initial values of optical properties, absorption coefficient μa and diffusion coefficient D. In Eq. (1), S is the source term. In step 5, the Jacobian matrix in CW scheme is established, which has the form
| (2) |
The Jacobian or sensitivity matrix represents the change of the calculated fluence rate data ϕc at each detector or measured position to a small change of optical properties (μa, D) at each mesh node points, where M and N are the number of measured data and total mesh nodes, respectively. The Jacobian matrix is established using an adjoint model, which is highly efficient in computational speed [8].
In next step, we calculate the projection error between ϕm and ϕc. The projection error is defined as the summation of the absolute difference between ϕm and ϕc. If the set tolerance is achieved, we record the reconstructed optical properties and terminate the program. Otherwise, the optical properties will be updated and used for step 4 (Fig. 1). The inverse calculation will repeat until the stopping criteria reached. The optical properties was updated using Jacobian matrix and the Levenberg-Marquardt (LM) procedures, and in which case
| (3) |
where I is an identity matrix, δϕ is the data misfit between ϕm and ϕc at each iteration, δμ is the update for the optical properties, , and λ is monotonically decreased over the iteration procedure [2]. In this study, if the projection error between two iterations does not improve by more than a predetermined limit, e.g. 2 %, the program will terminate and record the data.
2.2 Validation of forward calculation
The forward calculation is an essential part of reconstruction procedures, and the accuracy of forward calculation significantly affects the reconstruction results in a quantitative way. In this section, we compare the forward calculation results of point source generated by the modified NIRFAST in 3D sphere geometry with analytical solution and COMSOL computed results. For 2D case, the point source results computed by NIRFAST are compared with the analytical formula of linear source and the results generated by COMSOL for both 3D linear source and 2D point source.
An analytical point source solution of the diffusion equation (Eq. (1)) can be expressed as
| (4) |
where r is the radial distance relative to the source location, s is source strength, ϕ is fluence rate, μs' and μeff are the reduced scattering and effective attenuation coefficient, respectively. The linear source solution can be easily obtained by using the point source formula (Eq. (4)) and integrating the length of linear source.
Fig. 2 (A) shows the COMSOL-generated mesh used for 3D point source calculation for COMSOL and NIRFAST. A point source is placed in the center of the sphere, and the radius of the sphere is 5 cm. The number of nodes is 2514 and number of tetrahedral elements is 13000. Fig. 2 (B) shows the mesh used for 3D linear source calculation in a cylindrical geometry. The radius and height of the cylinder is 5 and 20 cm, respectively. Nodes number is 18832, and the tetrahedral element number is 109676.
Fig. 2.
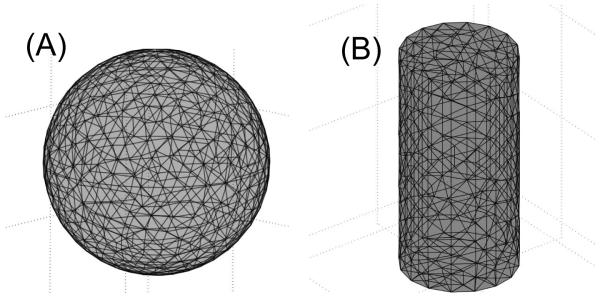
(A) COMSOL-generated mesh used for 3D point source calculation. (B) mesh used for 3D linear source calculation in a cylindrical geometry.
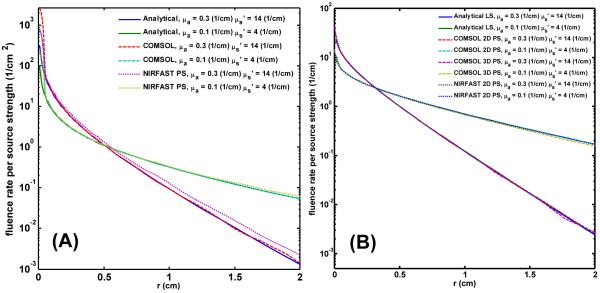
Fig. 3 shows the comparison result for the case of (A) 3D point source and (B) 2D point source of modified NIRFAST for two sets of optical properties, (μs' = 14 (cm−1) and μa' = 0.3 (cm−1)) and (μs' = 4 (cm−1) and μa' = 0.1 (cm−1)). r is the radial distance to the source location. Except for the 3D point source and large optical properties case, the NIRFAST result has approximate 14 % higher than the analytical and COMSOL generated result at r = 1 cm location, for all the other cases, the NIRFAST results are consistent with the other two results (Fig. 3 (A) and (B)). Results of Fig. 3 demonstrate the accuracy of our forward calculation.
Fig. 3.
(A) 3D point source results generated by modified NIRFAST compared with analytical solution and COMSOL 3D point source results for two set of optical properties (μs' = 14 (cm−1) and μa' = 0.3 (cm−1)) and (μs' = 4 (cm−1) and μa' = 0.1 (cm−1)) (B) 2D point source results generated by NIRFAST compared with analytical solution and COMSOL 3D linear and 2D point source results for two set of optical properties (μs' = 14 (cm−1) and μa' = 0.3 (cm−1)) and (μs' = 4 (cm−1) and μa' = 0.1 (cm−1))
3. RESULTS AND DISCUSSION
In this section, we demonstrate the reconstructed results for a 2D mathematical phantom using linear sources and for a 3D mathematical phantom using point sources.
3.1 Reconstruction for 2D mathematical phantom
Fig. 4 (A) shows the contour of prostate, urethra, and rectum in a 2D plan, and circle and cross are the locations of isotropic detectors and linear sources. There are 12 detectors, 5 linear sources, and total 60 measurement data. The closest source and detector separation is 5 mm. Fig. 4. (B) shows a layout of two anomalies inserted into the prostate. We include an extra outer medium surrounding the prostate. This boundary is used to avoid an artificial effect, a sudden drop of fluence rate on the prostate boundary if there is no outer medium existed. The boundary condition applied on the outer medium is Type III condition, in which the fluence at the edge of the outer medium exists and does not return [9], and the boundary condition used in the internal boundary is Dirichlet boundary. The optical properties of the background are set as μs' = 14 (cm−1) and μa = 0.3 (cm−1) [10]. For the left anomaly (purple), the optical properties are μs' = 14 (cm−1) and μa = 0.6 (cm−1), and for the right anomaly (red), the optical properties are μs' = 28 (cm−1) and μa = 0.3 (cm−1).
Fig. 4.
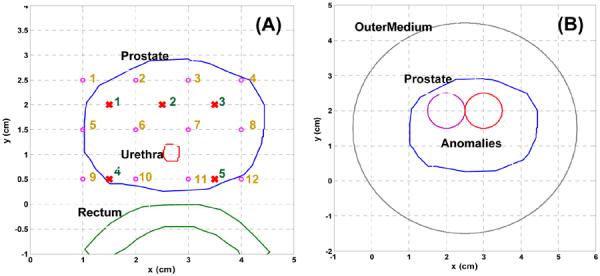
(A) Layout of prostate, urethea, and rectum contour, and source and detector locations. Circle and cross symbol represent the locations of isotropic detector and linear source, respectively. (B) shows a layout of two anomalies inserted into the prostate, and an extra outer medium is applied to surround the prostate.
The COMSOL-generated mesh used for 2D mathematical phantom is shown in Fig. 5. To optimize the simulated data for the subsequent reconstruction purpose, we use a finer mesh (Fig. 5(A)). The number of nodes and elements are 1819 and 3548, respectively. To reduce the reconstructed unknowns and improve the computational speed, we use a coarse mesh for the forward calculation in reconstruction procedures (Fig. 5 (B), and Fig. 1 Step 4). The number of nodes and elements are 779 and 1524, respectively. We also set the locations of source and detector at mesh nodes. In this case, COMSOL automatically generates finer mesh in the region close to the source and detector positions (ex: red circle in Fig. 5 (A) and (B)), and therefore, the accuracy of forward calculation in these points can be improved. To further reduce the reconstructed unknowns in the optical properties updated procedure (Fig. 1 Step 7), NIRFAST has an option to choose a separated second reconstruction basis, pixel basis [2]. The Jacobian matrix can be integrated onto this second basis, and the ill-conditioned of the inverse algorithm is further reduced. In this study, we use 12 × 12 uniform cells as our second pixel basis mesh.
The reconstructed results are shown in Fig. 6. The left and right figures represent the spatial distribution of μa and μs', respectively. The images show that the locations of anomalies are correctly reconstructed. However, for the image of μa, there is a cross talk between the two anomalies. The maximum values of reconstructed μa and μs' are 0.58 and 24 (1/cm) vs. the true optical properties 0.6 and 28 (1/cm). The reconstructed μs' is 14 % lower than the true value. The total iteration is 17 and computational time is 15 s in an Intel 2.4 GHz processor and 2G of RAM. The initial regularization λ is set as 100.
Fig. 6.

(Top) True distributions for μa (Left) and μs' (Right). (Bottom) Reconstucted result for μa (Left) and μs' (Right).
3.2 Reconstruction for 3D mathematical phantom
The orientation and location of prostate, source and detector are the same as 2D mathematical phantom. Instead of using linear source in 2D mathematical phantom, to simulate clinical environment, point sources are chosen as the light source used in 3D mathematical phantom. For the source location at a certain z plan, our isotropic detectors scan along the z-axis and record the fluence rate. Therefore, the locations where the isotropic detectors recorded data are equal to the virtual detector locations used in forward and inverse calculation. Circle and cross symbols in Fig. 7 (A) represent the locations of detectors and sources. The separation between each detector along the z axis is 1 mm. The 2D prostate contour (Fig. 4. (A)) is expanded in z axis to construct a 3D prostate structure (Fig. 7 (A) and (B)). Two anomalies and an outer medium are placed inside and surrounding the prostate (Fig. 7 (B)). The optical properties of the background are set as μs' = 14 (cm−1) and μa 0.3 (cm−1. For the left anomaly, the μs' and μa are 14 (cm−1) and 0.6 (cm−1), respectively, and for the right anomaly, μs' is 28 (cm−1) and μa is 0.3 (cm−1).
Fig. 7.
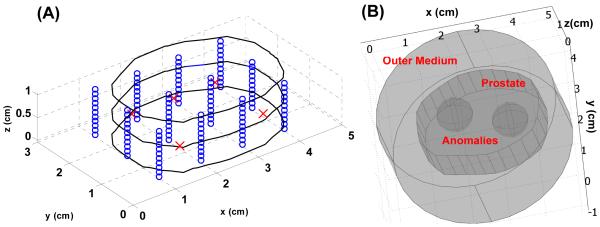
(A) Layout of prostate contour and source and detector locations for 3D mathematical phantom. Circle and cross symbol represent the locations of isotropic detector and point source, respectively. Fig. 7 (B) shows a layout of two anomalies inserted into the prostate, and an extra outer medium is applied to enclose the prostate.
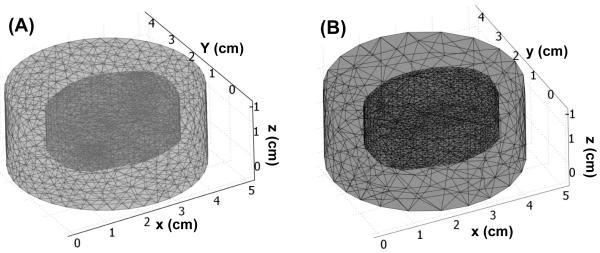
Similar to the mesh generated procedures in 2D mathematical phantom case (Sec. 3.1), we use finer mesh to generate the simulated data, and coarse mesh for the forward calculation in reconstruction procedures (Fig. 8 (A) and (B)). The nodes and tetrahedral number are 8834 and 49927 for finer mesh (Fig. 8 (A)), and 5618 and 32410 for coarse mesh (Fig. 8 (B)). A pixel basis 12 × 12 × 12 of uniform cells is chosen as a second reconstruction basis.
Fig. 8.
(A) COMSOL-generated mesh used for simulated data. (B) COMSOL-generated mesh used in the forward calculation in reconstruction procedures (Fig. 1 Step 4).
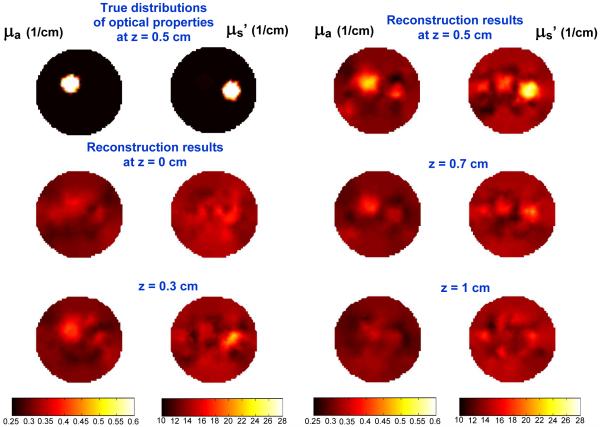
The reconstructed results for 3D mathematical phantom are shown in Fig. 9. The source and the center of anomalies are located at 0.5 cm at z axis. The top left two figures show the true distribution of optical properties. The other figures are the reconstructed results for each z plan. At each z location, left and right figure represent the distribution of μa and μs', respectively. From the result of Fig. 9, the anomalies start to appear as we move our plan from z = 0 to z = 0.5 cm, and disappear as we move toward z = 1 cm. The maximum reconstructed μa and μs' are 0.5 and 27 (1/cm) at z = 0.5 cm vs. the true optical properties 0.6 and 28 (1/cm). The reconstructed μa' is 17 % lower than the true value. The total iteration is 15 and computational time is 2 hrs in an Intel 2.4 GHz processor and 2G of RAM. The initial regularization λ is set as 100.
Fig. 9.
(Top left two) True distributions for μa (Left) and μs' (Right). Reconstucted result for μa and μs' for different z plan.
Based on the results of 2D and 3D phantom studies, we found that the reconstructed μa for 2D mathematical phantom case using linear sources is more accurate than the 3D case using point sources. The reconstructed maximum and averaged μa are 0.58 and 0.47 (1/cm) in 2D vs. 0.5 and 0.43 (1/cm) in 3D (at z = 0.5 cm plan). However, for μs', 2D mathematical phantom case is less accurate than the 3D case. The reconstructed maximum and averaged μs' are 24 and 20 (1/cm) in 2D vs. 27 and 21.4 (1/cm) in 3D (at z = 0.5 cm).
4. CONCLUSION
In this study, the accuracy of the forward calculation performed by NIRFAST has been demonstrated by comparing the analytical and COMSOL computed results, in both 2D linear source and 3D point source cases. We also demonstrate that the spatial distribution of optical properties for a 2D and 3D mathematical phantom are successfully reconstructed.
The ongoing direction in our group is to reconstruct optical properties of patient prostate cancer. The challenges we face are less measured data available, large computational cost, and measurement noise, compared with the case of reconstruction for a mathematical phantom. In clinical environment, only detectors located closely to source can maintain good signal to noise ratio. Consequently, the increased reconstructed unknowns and measurement noise will reduce the stability of inverse calculation. Moreover, male prostate is around 4 – 5 cm in length and 2 −3 cm in width. Significant amount of tetrahedral element is necessary to compute accurate forward data. Therefore, the algorithm to stabilize the inverse calculation and improve computational speed is necessary.
ACKNOWLEDGES
The authors would like to thank Dr. Hamid Dehghani for helping with NIRFAST programming and both Dr. Brian Pogue and Dehghani for providing the NIRFAST software. We thank Dr. Xiaodong Zhou for many helpful discussions. This work is supported by grants from National Institute of Health (NIH) R01 CA 109456 and P01 CA87971.
REFERENCES
- 1.Brown SB, Brown EA, Walker I. The present and future role of photodynamic therapy in cancer treatment. Lancet Oncol. 2004;5(8):497–508. doi: 10.1016/S1470-2045(04)01529-3. [DOI] [PubMed] [Google Scholar]
- 2.Dehgani H, Eames ME, Yalavarthy PK, Davis SC, Srinivasan S, Carpenter CM, Pogue BW, Paulsen KD. Near infrared optical tomogrophy using NIRFAST: Algorithm for numerical model and image reconstruction. Commun. Numer. Meth. Engng. 2008 doi: 10.1002/cnm.1162. DOI: 10.1002/cnm.1162. [DOI] [PMC free article] [PubMed] [Google Scholar]
- 3.Jemal A, Siegel R, Ward E, Murray T, Xu J, Thun MJ. Cancer statistics, 2007. CA Cancer J Clin. 2007;57(1):43–66. doi: 10.3322/canjclin.57.1.43. [DOI] [PubMed] [Google Scholar]
- 4.Zhou X, Zhu TC. Image reconstruction of continuous wave diffue optical tomography (DOT) of human prostate. Proc. COMSOL Multiphysics. 2006:89–95. [Google Scholar]
- 5.Zhou X, Zhu TC, Finlay JC, Li J, Dimofte A, Hahn SM. Two dimensional/three dimensional hybrid interstitial diffuse optical tomography of human prostate during photodynamic therapy: phantom and clinical results. Proc. SPIE. 2007;6434:64341Y, 1–11. doi: 10.1117/12.701717. [DOI] [PMC free article] [PubMed] [Google Scholar]
- 6.Zhou X, Zhu TC. Interstitial diffuse optical tomography using an adjoint model with linear sources. Proc. SPIE. 2008;6846:68450C. doi: 10.1117/12.762340. [DOI] [PMC free article] [PubMed] [Google Scholar]
- 7.Zhou X, Zhu TC. Sensitivity analysis of imaging geometries for prostate diffuse optical tomography. Proc. SPIE. 2008;6846:68450P. doi: 10.1117/12.764222. [DOI] [PMC free article] [PubMed] [Google Scholar]
- 8.Arridge SR, Schweiger M. Photon-measurement density functions. Part 2: Finite-element-method calculations. Appl Opt. 1995;34(34):8026–8036. doi: 10.1364/AO.34.008026. [DOI] [PubMed] [Google Scholar]
- 9.Dehghani H, Brooksby B, Vishwanath K, Pogue BW, Paulsen KD. The effects of internal refractive index variation in near-infrared optical tomography: a finite element modelling approach. Phys Med Biol. 2003;48(16):2713–27. doi: 10.1088/0031-9155/48/16/310. [DOI] [PubMed] [Google Scholar]
- 10.Zhu TC, Hahn SM, Kapatkin AS, Dimofte A, Rodriguez CE, Vulcan TG, Glatstein E, Hsi RA. In vivo optical properties of normal canine prostate at 732 nm using motexafin lutetium-mediated photodynamic therapy. Photochem Photobiol. 2003;77(1):81–8. doi: 10.1562/0031-8655(2003)077<0081:ivopon>2.0.co;2. [DOI] [PubMed] [Google Scholar]


