

SUMMARY
Heterozygous somatic mutations in the spliceosome gene U2AF1 occur in ~11% of patients with myelodysplastic syndromes (MDS), the most common adult myeloid malignancy. It is unclear how these mutations contribute to disease. We examined in vivo hematopoietic consequences of the most common U2AF1 mutation using a doxycycline-inducible transgenic mouse model. Mice expressing mutant U2AF1(S34F) display altered hematopoiesis and changes in pre-mRNA splicing in hematopoietic progenitor cells by whole transcriptome analysis (RNA-seq). Integration with human RNA-seq datasets determined that common mutant U2AF1-induced splicing alterations are enriched in RNA processing genes, ribosomal genes, and recurrently-mutated MDS and acute myeloid leukemia-associated genes. These findings support the hypothesis that mutant U2AF1 alters downstream gene isoform expression, thereby contributing to abnormal hematopoiesis in MDS patients.
Keywords: U2AF1, splicing, myelodysplastic syndrome
INTRODUCTION
Myelodysplastic syndromes (MDS) are the most common myeloid malignancy of the elderly, with at least 10,000 new cases occurring in the United States annually (Ma, 2012). MDS are a heterogeneous group of clonal hematopoietic stem cell disorders characterized by peripheral blood cytopenias, with up to 30% of patients progressing to secondary acute myeloid leukemia (AML) (Troy et al., 2014). Mutations in spliceosome genes have been identified in over half of MDS patient bone marrow samples, making it the most common class of genes mutated in MDS (Damm et al., 2012; Graubert et al., 2011; Papaemmanuil et al., 2011; Thol et al., 2012; Visconte et al., 2011; Walter et al., 2013; Yoshida et al., 2011). The recurrently-mutated spliceosome genes encode factors that are involved in the recognition of the 3′-intronic splice site and are mutually exclusive of one another in patient samples (Haferlach et al., 2014; Papaemmanuil et al., 2013; Walter et al., 2013; Yoshida et al., 2011), implying that they may contribute similarly to MDS pathogenesis or, alternatively, may not be tolerated by a cell when they co-occur.
Our group and others identified mutations in U2AF1 (U2 small nuclear RNA auxiliary factor 1) in 11% of MDS patients, making it one of the most commonly mutated genes in this disease (Graubert et al., 2011; Yoshida et al., 2011). In addition, U2AF1 mutations typically occur in the founding clone, suggesting they may play an important role in disease initiation (Haferlach et al., 2014; Papaemmanuil et al., 2013; Walter et al., 2013). U2AF1 mutations have also been identified across major cancer types, including AML, lung adenocarcinoma, head and neck squamous cell carcinoma, uterine corpus endometrial carcinoma, bladder urothelial carcinoma, breast adenocarcinoma, and colorectal carcinoma, further implicating U2AF1 broadly in cancer pathogenesis (Kandoth et al., 2013). During normal pre-mRNA splicing activity, the U2AF1 protein binds to the AG dinucleotide at the 3′ end of the intron, thereby assisting its cofactor U2AF2 in recruitment of the U2 snRNP for spliceosome activation as part of the spliceosome E/A complex (Wahl et al., 2009; Wu et al., 1999).
It is unknown how U2AF1 mutations contribute to MDS pathogenesis. Several groups have reported splicing changes in cells expressing mutant U2AF1, including cell lines (HeLa, K562), primary human CD34+ cells, and patient AML and MDS cells (Brooks et al., 2014; Graubert et al., 2011; Ilagan et al., 2014; Okeyo-Owuor et al., 2014; Przychodzen et al., 2013; Yoshida et al., 2011). However, the downstream targets of mutant U2AF1 identified in these studies are variable, perhaps due to differences in cell types, co-occurring mutations, and experimental methods used. Initial in vivo studies using a retroviral overexpression model showed that mouse bone marrow cells expressing mutant U2AF1 have reduced repopulation ability (Yoshida et al., 2011). Together, these data lead us to hypothesize that mutant U2AF1-induced splicing alterations and subsequent changes in gene isoform expression result in abnormal hematopoiesis.
RESULTS
Splicing is altered in primary human AML cells expressing mutant U2AF1
To examine the effects of U2AF1 mutations on global splicing in primary patient samples, we utilized RNA-seq data from the The Cancer Genome Atlas (TCGA) AML cohort (Cancer Genome Atlas Research, 2013). We identified 8 samples with a spliceosome gene mutation, including 6 samples with a U2AF1 mutation affecting the S34 amino acid (4 S34F, 2 S34Y), 1 sample with U2AF1(Q157P), 1 sample with SF3B1(K700E), and 102 samples without a mutation or copy number alteration in spliceosome genes (Table S1). Unsupervised clustering using the splicing ratio of cassette and mutually exclusive exon splice junctions segregated the 6 mutant U2AF1(S34) patient samples from the 102 control, the U2AF1(Q157P), and SF3B1(K700E) samples (Figure 1), indicating that splicing is distinctly altered in primary patient cells with U2AF1 mutations affecting the S34 amino acid.
Figure 1. Global alterations in pre-mRNA splicing are distinct in human AML patients with U2AF1 mutations.
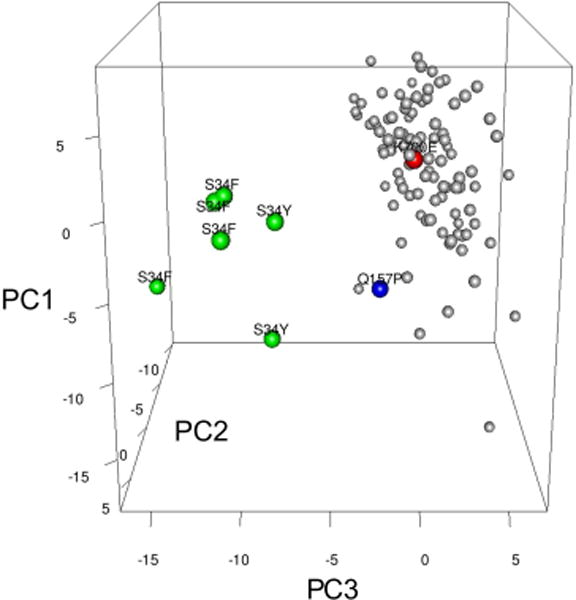
Unsupervised principal component analysis of standardized splicing ratios of expressed 3′ splice sites of cassette and mutually exclusive exons (> 5 reads in ≥ half of samples) in human AML patients [n=6 mutant U2AF1(S34F/Y) (green dots), n=102 normal for spliceosome genes (gray dots), n=1 U2AF1(Q157P) (blue dot), n=1 SF3B1(K700E) (red dot)]. Putative spliceosome genes were used to denote “normal;” see also Table S1.
Generation of U2AF1(S34F) transgenic mice
To study the in vivo consequences of U2AF1 mutations on splicing and hematopoiesis in an isolated genetic system and to prioritize splicing alterations identified in primary patient samples, we created a mouse model to study the most abundant U2AF1 mutation found in MDS patients [U2AF1(S34F)]. Using a previously-validated, single-copy, site-specific integration approach (Beard et al., 2006), we generated doxycycline-inducible U2AF1(S34F) and control U2AF1(WT) transgenic mice. We integrated human cDNA (human and mouse U2AF1 proteins differ in only one amino acid in the polyglycine tract of the C-terminal RS domain) coding for U2AF1(S34F) or U2AF1(WT) into the Col1a1 locus of KH2 mouse embryonic stem (ES) cells (Figure S1A). KH2 ES cells contain the M2rtTA tetracycline-responsive transactivator protein (rtTA) ubiquitously expressed from the Rosa26 locus, which allows for induction of the integrated U2AF1(S34F) or U2AF1(WT) transgene following treatment of cells with the tetracycline derivative doxycycline (Figure 2A). Integration was validated in both mouse lines by Southern blot analysis (Figure 2B). These transgenic mouse lines display dose-dependent, inducible, in vivo expression of the integrated U2AF1 transgene (S34F or WT) in bone marrow cells (Figure 2C). For subsequent experiments, we used a doxycycline dose (625 ppm doxycycline chow) that induced levels of exogenous transgene expression similar to endogenous mouse U2af1 levels in bone marrow cells, consistent with the heterozygous expression of U2AF1 mutations in MDS patient bone marrow samples (Graubert et al., 2011). This dose of doxycycline induced similar levels of transgene expression in U2AF1(S34F)/rtTA and U2AF1(WT)/rtTA double transgenic mice, as determined by pyrosequencing (data not shown). U2AF1(WT) and U2AF1(S34F) expression was in excess of normal mouse U2af1 expression levels, resulting in approximately double the normal protein level in cells (Figure S1B); however, overexpression of human U2AF1 transgene(s) at this dose of doxycycline has no impact on endogenous mouse U2af1 expression (Figure S1C). U2AF1 transgene expression was induced in myeloid and lymphoid cell lineages, as well as in stem and progenitor cells (Figure S1D).
Figure 2. Generation of doxycycline-inducible U2AF1 transgenic mice.

(A) Schematic of doxycycline-inducible U2AF1 transgene system. Human U2AF1(S34F) or U2AF1(WT) cDNA was integrated into a modified Col1a1 locus of mouse ES cells containing the reverse tetracycline transactivator (M2rtTA) expressed from the Rosa26 locus. Addition of doxycycline induces U2AF1 transgene expression. (B) Southern blot of ES cell or transgenic mouse tail genomic DNA using the 5′ Col1a1 probe to detect the integration of U2AF1(S34F) or U2AF1(WT) transgenes. Flip-in of the pBS31′ vector is detected by the appearance of a 4.1 kb band. Frt is the modified frt locus (6.7 kb), and WT is the wild-type locus (6.2 kb) (C) Doxycycline-dose response curve of U2AF1 transgene expression relative to endogenous mouse U2af1 in bone marrow cells measured by RT-PCR followed by pyrosequencing assay (n=2–7). Data is represented as mean (+/−SD). The 625 ppm doxycycline chow (*) was used in all subsequent experiments; ppm, parts per million. See also Figure S1.
Hematopoietic cell lineage is altered in U2AF1(S34F)-recipient mice
To examine the cell-autonomous effects of mutant U2AF1(S34F) expression on hematopoiesis, we transplanted transgenic mouse bone marrow into lethally-irradiated wild-type congenic recipient mice, allowing for ≥6 weeks of engraftment prior to induction of the transgene. Initial experiments were conducted with all six possible genotypes produced from transgenic colonies. Control genotypes of wild-type (nontransgenic) mice, single transgenic rtTA-only, U2AF1(WT)-only, and U2AF1(S34F)-only, and double transgenic U2AF1(WT)/rtTA mice were similar in parameters measured (Figure S2A). Given the similarity of all controls, subsequent experiments were performed with the U2AF1(S34F)/rtTA double transgenic mice and two control genotypes: U2AF1(WT)/rtTA double transgenic mice and single transgenic rtTA-only mice [littermates from the U2AF1(S34F) transgenic mouse colony].
Examination of hematopoietic compartments in recipient mice following one month of doxycycline to induce transgene expression revealed a reduction in peripheral blood total white blood cell (WBC) counts in U2AF1(S34F)/rtTA-recipient mice compared to U2AF1(WT)/rtTA-and rtTA-only recipient controls (4.3 vs 7.11 and 7.13 K/μl, respectively, p=0.014) (Figure 3A), but no difference in red blood cell parameters or platelet counts (Figure S2B). This peripheral blood leukopenia was stable and persisted for up to 12 months (Figure 3A); it was also dependent on mutant U2AF1 expression, since the WBC counts in mutant U2AF1(S34F)/rtTA mice recovered to levels similar to U2AF1(WT)/rtTA mice after halting doxycycline treatment, even after 6 months of transgene expression (Figure S2C). Flow cytometry analysis of mature lineage cells in the peripheral blood revealed a reduction in B cells and monocytes in U2AF1(S34F)/rtTA-recipient mice compared to controls (Figure 3B).
Figure 3. Mature hematopoietic cell lineages are altered by in vivo expression of U2AF1(S34F).

(A) Peripheral blood white blood cell counts of mice transplanted with transgenic donor marrow following 1, 6, and 12 months of doxycycline induction of transgene expression (n=5–12). (B) Absolute count of peripheral blood monocytes (Gr-1+, CD115+), neutrophils (Gr-1+, CD115−), B cells (B220+), and T cells (CD3e+) based on WBC and flow cytometry following 1 month doxycycline (n=9–11). (C) Mature lineage distribution of bone marrow cells by flow cytometry for monocytes, neutrophils, B cells, and T cells following 1 month doxycycline (n=9–11). (D) Detection of apoptosis in bone marrow monocytes (Gr-1+, CD115+) following 5 days of doxycycline by flow cytometry for Annexin V+ (left panel, n=9–14) and intracellular phospho-H2AX (right panel, n=8–13). All data are represented as mean (+/−SD). (*p<0.05, **p<0.01, ***p<0.001) MFI, Mean Fluorescence Intensity. See also Figure S2.
There were no differences in bone marrow cellularity or spleen weights in U2AF1(S34F)/rtTA mice compared to controls (Figure S2D). However, mature cell lineage distribution was altered in the bone marrow of U2AF1(S34F)/rtTA-recipient mice after one month of doxycycline. Both monocytes and B cells were reduced in U2AF1(S34F)/rtTA-recipient mouse bone marrow, and neutrophils were increased (Figure 3C). The reduction of monocytes in the bone marrow of U2AF1(S34F)/rtTA-recipient mice occurred as soon as five days after transgene induction (Figure S2E) and was associated with an increase in Annexin V+ and phospho-H2AX staining of monocytes (Figure 3D). In vitro culture of transgenic mouse bone marrow revealed a similar trend in Annexin V+ and phospho-H2AX flow cytometry in U2AF1(S34F)/rtTA-expressing cells compared to controls (Figure S2F). There was no evidence of bone marrow dysplasia in U2AF1(S34F)/rtTA-recipient mice (Figure S2G). The overall survival of U2AF1(S34F)/rtTA- and U2AF1(WT)/rtTA-recipient mice was similar (Figure S2H), and mutant mice did not develop MDS or AML after at least one year of continuous doxycycline.
U2AF1(S34F)-recipient mice have increased progenitor cells in bone marrow and spleen, but stem cells have a competitive disadvantage in repopulation assays
Following one month of doxycycline to induce transgene expression, U2AF1(S34F)/rtTA-recipient mice displayed an increased frequency of myeloid progenitors in both bone marrow (Figure 4A) and spleen (Figure 4B) by progenitor colony forming assay (CFU-C) compared to U2AF1(WT)/rtTA and rtTA-only recipient control mice. This increase was also seen by flow cytometry analysis for c-Kit+/lineage− (KL) cells in the bone marrow (Figure S3A), as well as for common myeloid progenitors (CMP) in bone marrow (Figure 4C) and spleen (Figure 4D) of U2AF1(S34F)/rtTA-recipient mice compared to controls. Granulocyte/macrophage progenitors (GMP) were variably increased (Figure S3B) and megakaryocyte/erythroid progenitors (MEP) were unchanged in mutant mice compared to controls (Figure S3C).
Figure 4. Hematopoietic stem-enriched and progenitor cells are increased by in vivo expression of U2AF1(S34F), but have a competitive disadvantage in repopulation assays.

(A, B) Myeloid progenitor colony forming CFU-C assays of bone marrow (A, n=9–11) and spleen cells (B, n=5–10) from mice transplanted with transgenic donor marrow following 1 month of doxycycline. (C, D) Flow cytometry for donor-derived common myeloid progenitors (CMP: CD45.1−, CD45.2+, lin−, c-Kit+, Sca-1−, CD34+, Fcγ−) in bone marrow (C, n=9–11) and spleen (D, n=5–6) of mice transplanted with transgenic donor marrow following 1 month of doxycycline. (E) Flow cytometry for donor-derived, stem-cell enriched fractions of bone marrow [KLS: CD45.1−, CD45.2+, lin−, c-Kit+, Sca-1+ cells (n=9–11)] following 1 month of doxycycline. Representative flow cytometry plots of U2AF1(WT)/rtTA and U2AF1(S34F)/rtTA-recipient mice showing c-Kit and Sca-1 antigen expression on CD45.2+, lin− gated cells (left panel); quantification of multiple mice (right panel). (F) Intracellular flow cytometry of Ki67+ levels in bone marrow KLS cells following 5 days of doxycycline (n=9). (G) Peripheral blood chimerism of primary recipient mice transplanted with equal portions of transgenic (CD45.2+) and wild-type (CD45.1+/CD45.2+) bone marrow cells in competitive repopulation assays. Data is shown as fold change of transgenic (CD45.2+ chimerism) from the start of doxycycline (n=5–12). Differences (two-way ANOVA) are indicated at each time point as different from the U2AF1(S34F) genotype by: *wild-type nontransgenic mice, ΦrtTA only, and εU2AF1(WT)/rtTA. (H) Bone marrow cells from primary recipient mice of the same genotype were pooled equally and transplanted into secondary recipient mice (left panel, n=3–5); likewise, bone marrow from secondary recipients was transplanted into tertiary recipient mice (right panel, n=4–5). Fold change of transgenic cells (CD45.2+ chimerism) measured in peripheral blood from 1 month post-secondary and tertiary transplants. All data are represented as mean (+/−SD), except panel C as mean (+/−SEM). (*p≤0.05, **p≤0.01, ***p≤0.001) See also Figure S3.
Flow cytometry for the stem cell-enriched compartment defined by c-Kit+/lineage−/Sca-1+ (KLS) cells also showed an increase in the bone marrow of U2AF1(S34F)/rtTA-recipient mice compared to controls (Figure 4E) following one month of doxycycline. Further characterization of stem cells by flow cytometry using SLAM and CD34/Flk2 revealed a trend toward increased multipotent progenitors, but no difference in short-term and long-term stem cell populations (Figure S3D). The increase in bone marrow stem-enriched and progenitor cells (KLS, KL, CMP) measured by flow cytometry and by CFU-C in U2AF1(S34F)/rtTA-recipient mice was detectable following only 5 days of doxycycline exposure (Figure S3E–H). The increased frequency of KLS cells after 5 days of transgene induction was associated with increased Ki67+ staining in KLS cells from U2AF1(S34F)/rtTA-recipient mice compared to controls (Figure 4F); a similar trend was seen for BrdU incorporation (Figure S3I). There was no increase in hematopoietic stem-enriched and progenitor cells measured by flow cytometry and methylcellulose in the absence of doxycycline in U2AF1(S34F)/rtTA-recipient mice (Figure S3E, G, H), confirming this early phenotype at 5 days was not due to doxycycline-independent transgene expression. Next, we evaluated stem cell function using a competitive repopulation assay. Although we observed an increase in the frequency of stem-enriched and progenitor cells in mutant U2AF1-recipient mice, competitive repopulation assays revealed a disadvantage for U2AF1(S34F)/rtTA-expressing stem cells compared to U2AF1(WT)/rtTA-expressing cells in primary recipient mice (Figure 4G). The competitive disadvantage was sustained when the bone marrow from primary recipients was transplanted into secondary and tertiary recipient mice (Figure 4H).
Comprehensive RNA sequencing of U2AF1(S34F)-expressing mouse bone marrow progenitors reveals splicing alterations
MDS patient bone marrow samples have an increased fraction of common myeloid progenitors (CMPs) compared to normal bone marrow donors (Pang et al., 2013; Woll et al., 2014), and we observed an increase in CMPs in mutant U2AF1 mouse bone marrow as early as 5 days following doxycycline exposure with a concomitant increase in CFU-C formation. Therefore, we sorted donor-derived CMPs from U2AF1(S34F)/rtTA- and U2AF1(WT)/rtTA-recipient mice following 5 days of transgene induction and performed transcriptome sequencing (RNA-seq) to detect U2AF1(S34F)-induced splicing alterations. The levels of transgene induction were similar among samples (Figure S4A). On average, CMP samples yielded 3.2 ×10⁸ sequencing reads (Figure S4B), with an average of 2.0 ×10⁸ uniquely mapped reads across samples (Figure S4C). The distribution of reads from various species of RNA was similar, with mutant samples having a slightly higher percentage of intergenic bases (p<0.05) and lower percentage of coding bases (p=0.05) (Figure S4D).
Unsupervised clustering based on the splicing ratio of cassette and mutually exclusive exon junctions segregated U2AF1(S34F)-expressing CMP samples from U2AF1(WT) controls (Figure 5A), as it did for AML patients (Figure 1). DESeq (Anders and Huber, 2010), an algorithm that accounts for RNA-seq replicate data and biologic variation, identified changes in overall gene expression in 128 genes (FDR<0.1) in U2AF1(S34F)/rtTA samples compared to U2AF1(WT)/rtTA controls (Table S2). Using these genes, we performed gene set enrichment and pathway analyses with GOseq (Young et al., 2010) and identified an enrichment of genes involved in immune response and leukocyte activation processes (FDR<0.1) (Table S3).
Figure 5. U2AF1(S34F) expression alters splicing in mouse progenitors cells in vivo.
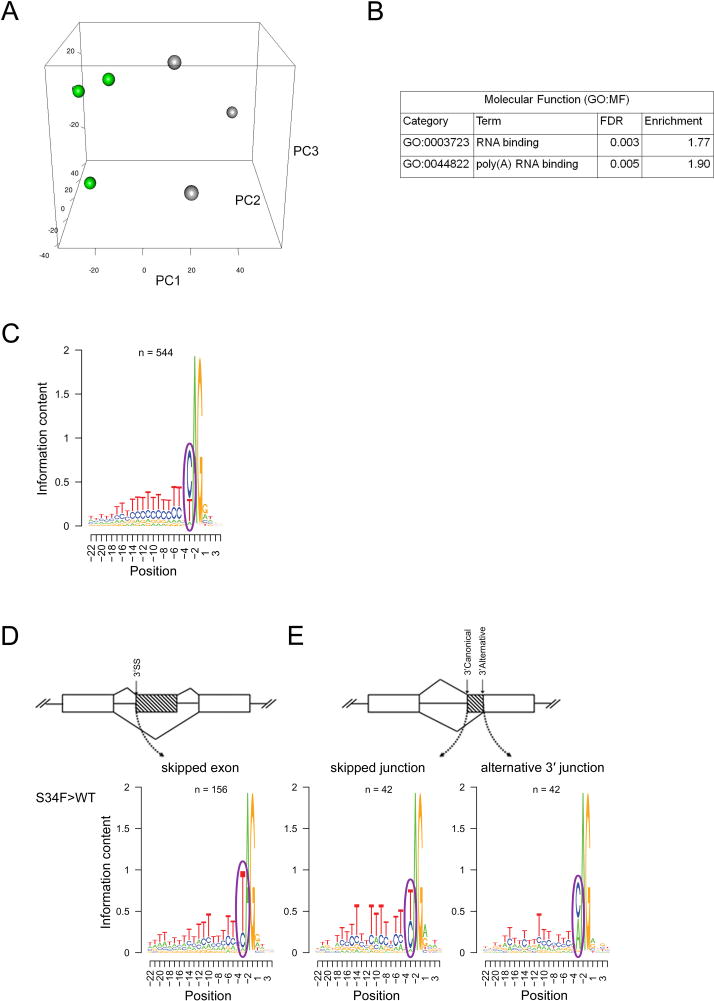
(A) Unsupervised principal component analysis of standardized splicing ratios of expressed 3′ splice sites of cassette and mutually exclusive exons (> 5 reads in ≥ half of samples) in donor-derived bone marrow common myeloid progenitor cells (CMP) sorted from mice transplanted with U2AF1(S34F)/rtTA or U2AF1(WT)/rtTA bone marrow (n=3 pools of 5–7 mice each) following 5 days doxycycline. (B) Pathways enriched (GOseq FDR<0.1) in differentially spliced genes in U2AF1(S34F)/rtTA CMPs. (C) The consensus sequence surrounding the AG dinucleotide of the 3′ splice site of 544 randomly selected junctions not altered by U2AF1(S34F). (D) The 3′ splice site consensus sequence of U2AF1(S34F)-skipped exons (n=156) and (E) of skipped canonical splice junctions and their associated alternative 3′ junctions (n=42) identified by DEXSeq (FDR<0.1). Results are depicted in Logos plots. ss, splice site. See also Figure S4 and Table S2–S4.
DEXSeq (Anders et al., 2012), an algorithm that identifies altered junctions while accounting for changes in overall gene expression, identified 742 splicing junctions that were differentially expressed in 633 genes in U2AF1(S34F)/rtTA samples compared to U2AF1(WT)/rtTA controls (FDR<0.1) (Table S4). Using these 633 genes, we again performed gene set enrichment and pathway analyses and identified an enrichment of genes involved in RNA binding (FDR<0.1) (Figure 5B). The majority of differentially spliced junctions in U2AF1(S34F)/rtTA samples compared to U2AF1(WT)/rtTA controls were classified as cassette exon, simple alternative 3′ splice acceptor site, and coordinate cassette exon events (Figure S4E).
U2AF1(S34F) has altered 3′ splice acceptor sequence preference
To further examine the effects of U2AF1(S34F) expression on splicing in vivo, we determined the consensus sequence flanking the AG dinucleotide at the 3′ splice acceptor site known to be recognized by U2AF1 during splicing (Wu et al., 1999). In contrast to the sequence motif seen in non-dysregulated control junctions (Figure 5C), exons skipped more frequently by mutant U2AF1(S34F) relative to U2AF1(WT) were enriched for uracil (indicated by a T) in the −3 position relative to the AG dinucleotide (Figure 5D). We observed a similar pattern in alternative 3′ splice site usage; there is an enrichment of T in the −3 position of canonical 3′ splice sites whose alternative 3′ splice site was utilized more frequently in mutant U2AF1(S34F)/rtTA samples relative to U2AF1(WT)/rtTA controls (Figure 5E). This pattern is the same as seen in AML patient samples with U2AF1 mutations and in primary human CD34+ cells expressing U2AF1(S34F) or U2AF1(WT), and similar to previously-reported data in human samples (Brooks et al., 2014; Ilagan et al., 2014; Okeyo-Owuor et al., 2014; Przychodzen et al., 2013). These data indicate that the sequence-specific pattern of altered splicing induced by mutant U2AF1 is similar in mouse and human cells.
U2AF1(S34F)-induced splicing changes are enriched in genes involved in RNA processing and splicing, protein translation, and recurrently mutated genes in MDS/AML
To prioritize altered splicing events for further analysis, we intersected significant junctions (DEXSeq; FDR<0.1) across 3 datasets: mouse CMP samples (n=219 junctions), AML patient samples with and without U2AF1 mutations (n=162 junctions), and our previously-described primary human CD34+ cells over-expressing U2AF1(S34F) or U2AF1(WT) (n=1652 junctions) (Okeyo-Owuor et al., 2014). The intersection was (necessarily) composed of homologous junctions and was additionally restricted to include only concordantly dysregulated (same direction of log fold change) junctions; 17 homologous dysregulated junctions (p<0.0001; simulation) were present in 13 genes (Figure 6A, B). Several of the dysregulated junctions corresponded to the same splicing event in a transcript and were identified as reciprocal splice junctions. All of these junctions occur in known isoforms, though the function of most of these isoforms remains largely unknown. Several of these junctions occur in genes mutated in MDS and AML (GNAS, PICALM) (Bejar et al., 2011; Borel et al., 2012) or known to be involved in stem cell biology (H2AFY, MED24) (Buschbeck et al., 2009; Chia et al., 2010; Gaspar-Maia et al., 2013).
Figure 6. Mutant U2AF1 alters splicing in common targets across species.
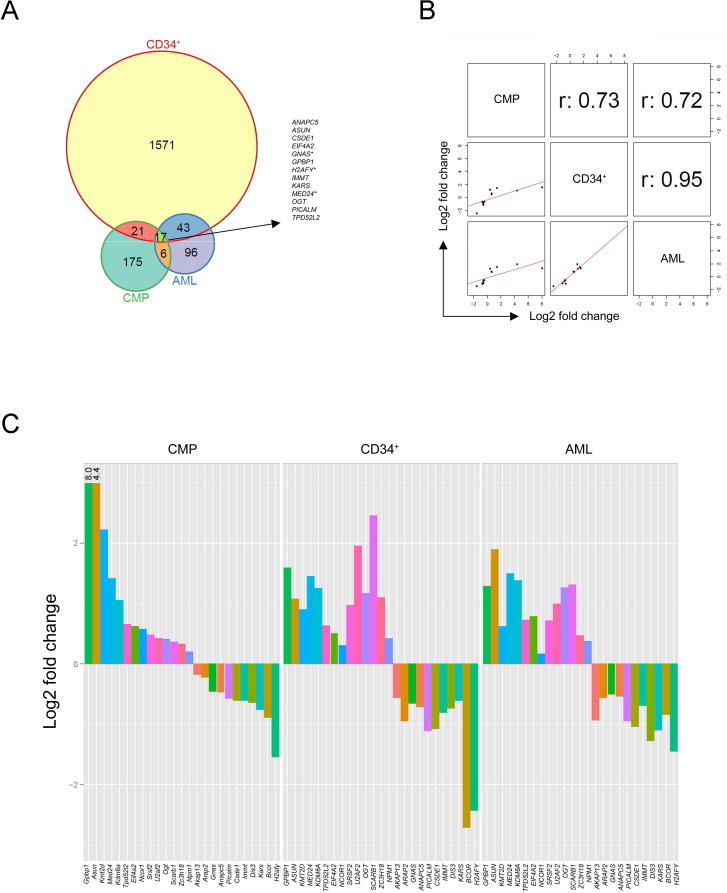
(A) Venn diagram of the overlap of independently discovered mutant U2AF1-induced splice junction changes by DEXSeq analysis (FDR<0.1) in 3 RNA-seq datasets: transgenic mouse CMPs, primary human hematopoietic CD34+ cells, and human AML patient samples. *Indicates multiple significant junctions detected within the gene. (B) Correlation plots and r values for junctions identified by overlap of DEXSeq datasets shown in the Venn diagram. One junction per gene is shown. (C) Log2 fold change in junction expression [U2AF1(WT) versus U2AF1(S34F)] for overlapping genes (A) and recurrently mutated genes in MDS and AML identified by Fisher’s meta-analysis (Table 1), plotted in descending order based on CMP results. U2AF1 was excluded due to an inability to differentiate endogenous vs. exogenous U2AF1(WT) transcript in CD34+ cells. See also Figure S5 and Tables S5, S6.
To broaden the list of potentially concordant changes across species, we performed a meta-analysis of the three independent datasets using Fisher’s combined probability test (Brown, 1975) and identified 555 significantly dysregulated homologous junctions in 415 genes across all three datasets (FDR<0.1) (Table S5). The larger number of dysregulated junctions relative to the conservative intersection above enables both consensus sequence analysis and pathway/gene-set enrichment analyses. Skipped exons from the Fisher dataset also show an enrichment of T at the −3 position of 3′ splice sites, as in the CMP data (Figure S5). We hypothesized that splicing in biologic pathway(s) could be widely disrupted by mutation of an upstream splicing factor. To test this, we performed gene set enrichment and pathway analyses on the 415 splicing-dysregulated genes using GOseq. This resulted in 28 pathways/categories identified as significant (FDR<0.1, Enrichment >2) by one of the 3 independent analyses of KEGG pathways or GO molecular function (MF) or biological processes (BP) categories:14 of these contain genes involved in RNA processing, RNA splicing, RNA localization/transport, and RNA binding, while 11 were involved in protein translation processes and ribosomal pathways (Table S6). Additionally, spliceosome genes (p=4.68e-08, Table S1) and genes recurrently mutated in MDS and AML (Bejar et al., 2011; Cancer Genome Atlas Research, 2013; Haferlach et al., 2014; Papaemmanuil et al., 2013; Walter et al., 2013) (p=0.03, Table S7) were enriched in the 415 splicing-dysregulated genes (Table 1 and Figure 6C). Oncogenes and tumor suppressors (Supek et al., 2014) were also highly represented (p=0.09, data not shown).
Table 1.
Spliceosome and recurrently mutated MDS/AML genes with dysregulated splicing (Fisher FDR<0.1).
| Spliceosome Genes | Recurrently Mutated Genes in MDS/AML |
|---|---|
|
| |
| CLK1 | AKAP13 |
| CLK3 | ARAP2 |
| CPSF4 | BCOR |
| HNRNPA1 | DIS3 |
| HNRNPA2B1 | GNAS |
| HNRNPC | KDM6A |
| HNRNPD | KMT2D |
| HNRNPH1 | NCOR1 |
| HNRNPM | NPM1 |
| PCBP2 | SCARB1 |
| PRPF40A | SRSF2 |
| PTBP1 | U2AF1 |
| PTBP2 | U2AF2 |
| RBM39 | ZC3H18 |
| RNMT | |
| SF3B3 | |
| SNRNP70 | |
| SNRPG | |
| SRSF10 | |
| SRSF11 | |
| SRSF2 | |
| SRSF7 | |
| TCERG1 | |
| THOC1 | |
| THOC2 | |
| U2AF1 | |
| U2AF1L4 | |
| U2AF2 | |
| YBX1 | |
| ZMAT2 | |
U2AF1(S34F)-induced splicing changes are present in human MDS bone marrow samples
Next, we examined MDS patient bone marrow samples for mutant U2AF1-induced splicing changes discovered by RNA-seq analysis in a subset of affected genes. Dysregulated splicing events were prioritized for validation by overlap in the 3 datasets, splicing ratio change, or known biological function of the gene, with particular focus on genes mutated in MDS. Mutant U2AF1-induced splice isoform changes identified by RNA-seq analysis were concordant with RT-PCR of MDS patient bone marrow samples for 7 of 8 splicing events examined, including H2AFY, BCOR, PICALM, GNAS, KDM6A, KMT2D (MLL2), and MED24; only EIF4A2 showed no difference (Figure 7 and data not shown).
Figure 7. Mutant U2AF1 alters splicing in MDS bone marrow cells.
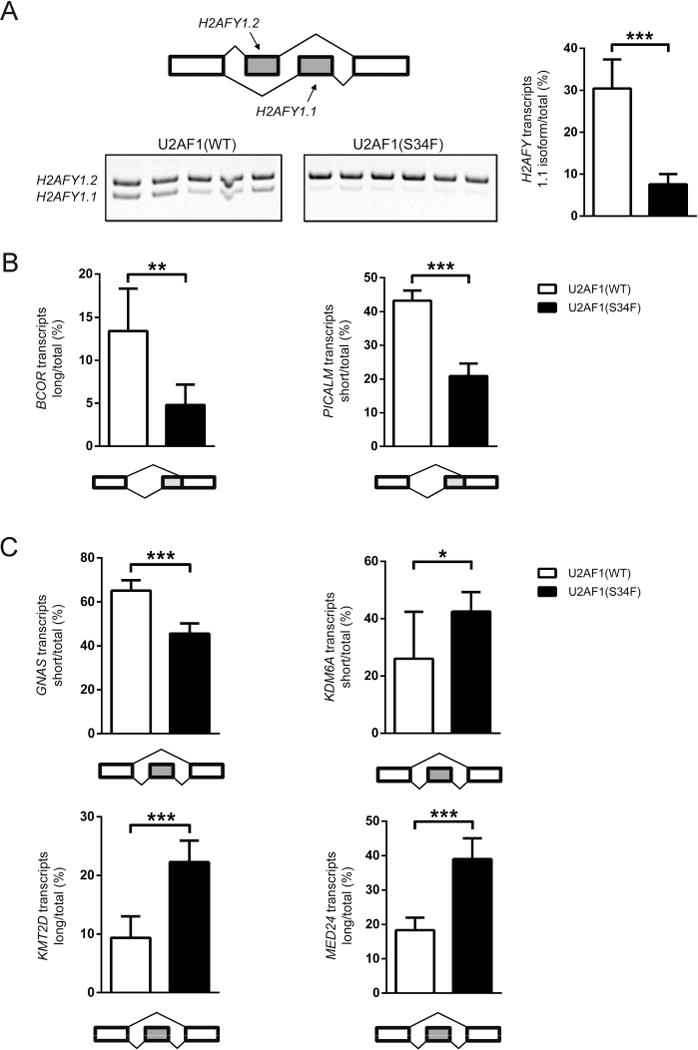
(A) Mutually exclusive exons in H2AFY detected by RT-PCR and gel electrophoresis (quantified in right panel); the diagram of the event measured and the gel image (left panel). (B, C) Quantification of alternative splice site utilization (B) and altered cassette exon events (C). All data are represented as mean (+/−SD). (*p≤0.05, **p≤0.01, ***p≤0.001; n=5–6)
DISCUSSION
In this study, we provide evidence that mutant U2AF1 expression alters hematopoiesis and pre-mRNA splicing in the primary hematopoietic progenitor cells of mice. U2AF1(S34F) expression in mice results in leukopenia and changes in the distribution of mature hematopoietic lineages in the peripheral blood and bone marrow. In addition, U2AF1(S34F) expression increases the frequency of progenitor cells in the bone marrow and spleen of mice and the frequency of progenitor cell cycling in the bone marrow. We identify U2AF1(S34F)-specific changes in splice isoforms in 633 genes in mouse common myeloid progenitors. Finally, through an integrative meta-analysis of 3 unique RNA-seq datasets, we identify splice junctions consistently altered across species by mutant U2AF1 expression and that are enriched in RNA processing genes, translational processes/ribosomal genes, and recurrently mutated genes in MDS/AML. Collectively, these results suggest that U2AF1(S34F)-induced alternative splicing may contribute to the altered hematopoiesis that is characteristic of MDS patients.
Mutant U2AF1(S34F) mice display several phenotypes associated with MDS, including leukopenia, increased apoptosis of maturing cells in the bone marrow, and progenitor cell expansion (Catenacci and Schiller, 2005; Hamblin, 1992; Pang et al., 2013; Raza et al., 1995a; Raza et al., 1995b; Shetty et al., 2000; Troy et al., 2014; Woll et al., 2014; Yoshida, 1993). However, these mice do not show dysplasia, nor do they develop MDS or AML. Similar to another genetic mouse model of MDS mutations (ASXL1) (Abdel-Wahab et al., 2013), mutant U2AF1(S34F)-expressing stem cells appear to have a competitive disadvantage and increased apoptosis compared to wild-type cells, highlighting a conundrum for MDS biology: how is clonal dominance achieved by a cell containing mutation(s) that result in reduced competitiveness and increased apoptosis? Although U2AF1 mutations are typically early genetic events, they may occur in cells already harboring a mutation that is permissive for clonal expansion. Cooperativity studies with significantly co-occurring mutations, such as del(20) or ASXL1 mutations (Bacher et al., 2014; Damm et al., 2012; Papaemmanuil et al., 2013; Walter et al., 2013) (or with other common mutations in MDS, like those in TET2 or DNMT3A), may be necessary to determine whether U2AF1 mutations require a specific genetic context to cause MDS or AML. Ultimately, U2AF1 mutations may contribute to ineffective hematopoiesis that is typical in MDS, while other mutations confer clonal dominance. This mouse model could be used to address these questions.
In this study, we show U2AF1(S34F)-induced splicing alterations in primary hematopoietic cells in an isolated genetic system in vivo. By using primary mouse CMPs and human CD34+ cells, we capitalize on identifying early splicing changes that are induced by mutant U2AF1 expression in the absence of transformation. Importantly, expression of mutant U2AF1 in mouse bone marrow cells results in an altered 3′ splice acceptor site sequence preference that is identical to the pattern observed in human cells, suggesting that the same mechanism of altered splicing is conserved across species and credentialing the mouse model for mechanistic studies.
We have identified a list of consistently altered candidate genes that may contribute to myeloid disease pathogenesis. Comparison of these datasets with dysregulated junctions found in lung adenocarcinoma patient samples with U2AF1 mutations suggests that at least some genes with altered splicing are shared across cancer and cell types harboring U2AF1 mutations; indeed, 13 of 29 genes with significant alterations associated with U2AF1 mutations in both lung adenocarcinoma and AML are also present in our list of junctions identified by meta-analysis (Brooks et al., 2014).
Further studies will be needed to identify the consequences of mutant U2AF1-induced splicing alterations for hematopoiesis and myeloid disease. It is still unknown if the contribution of U2AF1 mutations to MDS pathology involves pre-mRNA splicing alterations of one, a select few, or many genes of interest. Future rescue experiments using target mRNAs/shRNAs to alter isoform expression in mice will be necessary to address this question. However, the observation that dysregulated splicing junctions induced by mutant U2AF1(S34F) are enriched in recurrently-mutated genes in MDS/AML raises the possibility that subtle changes in isoform expression in one or more genes may contribute to mutant U2AF1-associated disease. Changes in isoform expression of cancer-associated genes may have important consequences for a cell. For example, different isoforms of NRAS have been shown to activate different signaling molecules, and expression of a rare isoform results in increased cell proliferation and transformation when compared to other NRAS isoforms (Eisfeld et al., 2014). We identified consistent splicing alterations in several genes commonly affected by loss of function mutations in MDS and cancer, including BCOR and KDM6A; however, splicing changes in both genes resulted in frame-preserving isoforms. Although the functional consequences of these changes are unknown, the dysregulated isoform of BCOR has been shown to lack a domain necessary to interact with the transcription factor AF9 (a common fusion partner of MLL) and repress AF9 transcriptional activity (Srinivasan et al., 2003).
We report here that perturbations in spliceosome and RNA processing genes occur in three independent mutant U2AF1 RNA-seq datasets. It raises the possibility that mutation of a spliceosome gene may result in autoregulatory changes in splicing machinery by altering isoform expression (Jangi and Sharp, 2014). This may account for the mutual exclusivity of spliceosome gene mutations in MDS patients (Haferlach et al., 2014; Papaemmanuil et al., 2013; Walter et al., 2013; Yoshida et al., 2011). Perturbations in the splicing process may have consequences for genome stability, as missplicing has been implicated in co-transcriptional R-loop formation (RNA:DNA hybrid) (Chan et al., 2014; Skourti-Stathaki and Proudfoot, 2014). This may contribute to the increased phospho-H2AX staining we observe in monocytes by inducing DNA damage through R-loop formation. Further studies are needed to address this. Also, the identification of genes involved in ribosome function and translational processes are an interesting consequence of mutant U2AF1 expression, because perturbations in the ribosome have been linked to MDS (Barlow et al., 2010; Ebert et al., 2008; Pellagatti et al., 2008). If other spliceosome gene mutations (e.g. SRSF2, SF3B1) perturb either of these two pathways, it would suggest a unifying mechanism of action for all these mutations. Ultimately, examination of dysregulated splicing caused by other spliceosome gene mutations and comparison with these findings may help clarify which gene pathways are important.
By performing all of our experiments in a cell-autonomous manner using a transplantation model, transgenic donor bone marrow cells necessarily undergo the stress of repopulating the hematopoietic system in the irradiated microenvironment of recipient mice. However, phenotypes observed in the transplanted mice were also seen in non-transplanted transgenic mice, including bone marrow progenitor expansion and monocyte apoptosis (data not shown). While the transgenic model we describe here could be used to test the dependency of tumors on mutant U2AF1 expression (by removing doxycycline once tumors develop), the overexpression of U2AF1(S34F) or U2AF1(WT) transgene, albeit low, is expected to result in non-stoichiometric levels of U2AF1 relative to other splicing factors. However, no detectable phenotypes were observed in U2AF1(WT)-expressing transgenic mice compared to rtTA only controls. Additional models of U2AF1 mutations (e.g., knock-in of S34F at the endogenous U2af1 locus and mice with other U2AF1 mutations) will be important to further characterize the effect of U2AF1 mutations in vivo.
While this study improves our understanding of mutant U2AF1 biology, our ultimate goal is to improve treatment of patients with U2AF1 mutations. The pervasive nature of spliceosome gene mutations in MDS highlights the need to understand and develop effective therapeutic approaches, perhaps by using splicing modulator drugs. This U2AF1 mouse model may be a useful pre-clinical tool to test potential therapies in a variety of cancers with U2AF1 mutations.
EXPERIMENTAL PROCEDURES
Generation of doxycycline-inducible U2AF1(S34F) and U2AF1(WT) transgenic mice
cDNAs that code for human U2AF1(S34F) and U2AF1(WT) were cloned from an MDS patient BM sample (UPN 571656) by RT-PCR using Superscript III kit (Invitrogen) and introduced individually into the pBS31′ vector (Beard et al., 2006) using EcoRI restriction sites. U2AF1(S34F) and (WT) cDNA sequences differed only in the one nucleotide that produced the S34F amino acid conversion. U2AF1(S34F)-pBS31′ and U2AF1(WT)-pBS31′ plasmids were introduced into KH2 ES cells by the FLP/FRT system (Beard et al., 2006) to produce U2AF1(S34F) and U2AF1(WT)-expressing ES cell lines. ES cell clones were selected by hygromycin, and integration of U2AF1 (S34F) or (WT)-pBS31′ was confirmed using PCR and Southern blot approaches. Integration at the 5′ end was detected using standard Southern blotting techniques as described (Beard et al., 2006). PCR screening of ES cells and genotyping of mice were performed with the primers described (Supplemental Materials). KH2 ES cells are (C57BL/6 × 129S4Sv/Jae)F1-derived V6.5 embryonic stem (ES) cells (Beard et al., 2006); therefore, transgenic mouse colonies were maintained by breeding heterozygous, doubly transgenic mice (U2AF1(S34F)/rtTA and U2AF1(WT)/rtTA) to (C57BL/6 × 129S4Sv/Jae)F1 mice. Doxycycline was administered via doxycycline-containing rodent chow (Pico 5053 base, TestDiet) or via doxycycline in water (in UV light-protected red water bottles, changed every 2 days).
All mouse procedures were performed according to protocols approved by the Washington University Animal Studies Committee.
RT-PCR and pyrosequencing
Following doxycycline induction of transgene expression in vivo, bone marrow cells were harvested from the leg bones. RNA was isolated from bone marrow cell pellets using the RNeasy kit (Qiagen) followed by DNA removal with Turbo DNA-free kit (Ambion). Reverse transcription PCR was then performed using the Superscript III RT-PCR kit (Invitrogen). PCR for U2AF1 and U2af1 to detect exogenous human transgene and endogenous mouse transcripts expressed in transgenic cells, respectively, was performed, and pyrosequencing for single nucleotide polymorphisms that differ between mouse and human cDNAs was performed on PCR products (primer sequences are in the Supplemental Materials).
Murine bone marrow transplant and competitive repopulation assays
To generate mice for each experiment, 1 × 10⁶ transgenic mouse donor bone marrow cells from 2–3 mice pooled (CD45.2) were transplanted into at least 5 lethally-irradiated (1100 rads) congenic wild-type recipient mice (C57BL/6 × 129S4Sv/Jae)F1 (CD45.1/CD45.2) per genotype. Donor mice were between 8–12 weeks of age, and recipient mice ranged from 6–12 weeks of age; donor and recipient mice were sex-matched. Competitive repopulation assays were performed by mixing transgenic donor “test” mouse bone marrow cells (CD45.2) from 2–3 mice in equal proportions with (C57BL/6 × 129S4Sv/Jae)F1 (CD45.1/CD45.2) donor “competitor” mouse bone marrow cells from 2–3 mice, and then transplanted into (C57BL/6 × 129S4Sv/Jae)F1 (CD45.1/CD45.2) recipient mice. Transgene induction was started ≥6 weeks after transplantation.
Mouse hematopoietic progenitor assay
Methylcellulose progenitor colony forming assays (CFU-C) were performed using Methocult GF M3434 (Stem Cell Technologies). Bone marrow and spleen cells were obtained from transplanted mice following doxycycline induction of transgene expression. Red blood cells were lysed prior to plating of 10,000 bone marrow cells or 100,000 spleen cells per 1.3 ml media; each sample was evaluated in duplicate. Progenitor colonies (defined as ≥40 cells/colony) were counted following 7 days culture at 37°C with 5% CO2.
Flow cytometry
Flow cytometry of donor-derived mature cell lineage distribution was performed on bone marrow, peripheral blood, and spleen using the cell surface receptors: CD45.1, CD45.2, CD115, Gr-1, B220, and CD3e (antibodies and procedures described in the Supplemental Materials). Apoptosis was evaluated by flow cytometry for Annexin V (APC, BD Biosciences) and intracellular Phospho-H2AX (FITC, JBW301, EMD Millipore) using the BD Cytofix/Cytoperm kit (BD Biosciences) following the manufacturer’s recommendations. Donor-derived hematopoietic progenitor and stem cell flow cytometry was performed on bone marrow and spleen using the following cell surface markers (antibodies described in the Supplemental Materials): CD45.1, CD45.2, mature lineage (Gr-1, Cd3e, B220, Ter119, and CD41), c-Kit, Sca-1, CD34, Fcγ, CD150, CD48, and Flk2. All flow cytometry was performed using FACScan or Gallios cytometers (BD Biosciences) and analyzed using FlowJo software (FlowJo, LLC., Ashland, OR). Progenitor cells were isolated for RNA-seq using an iCyt Synergy flow sorter (Sony).
RNA sequencing of Common Myeloid Progenitors
Donor-derived common myeloid progenitors (CMPs; lin−, c-Kit+, Sca-1−, CD34+, Fcγ−) cells were sorted from pooled bone marrow of 5–7 U2AF1(S34F)- or U2AF1(WT)-transplanted mice. Cells were sorted into DMEM media, and RNA was prepared from cell pellets using a miRNeasy kit (Qiagen). Genomic DNA was removed by Turbo DNA-free kit (Ambion). Ribosomal RNA was depleted (Ribozero, Epicenter), followed by cDNA preparation and TruSeq stranded Illumina library production. 2 × 100bp paired-end sequencing was performed on the HiSeq2000 platform (Illumina).
RNA-seq analysis
Reads were aligned to the mouse mm9 reference genome using TopHat (version 2.0.8) (Kim et al., 2013). All subsequent analyses were performed in R (Gentleman et al., 2004). Differential gene expression was determined using DESeq2 (version 1.6.1) (Anders and Huber, 2010), which applies a negative binomial model to counts of reads mapped to genes. Gene models were provided by Ensembl version 67 (Flicek et al., 2013). Differential junction expression was determined using DEXSeq (version 1.12.1) (Anders et al., 2012), which applies a negative binomial model to (novel or Ensembl-annotated) junction-spanning read counts while controlling for potential changes in overall gene expression between conditions. Gene enrichment analysis was performed using GOseq (version 1.18.0) (Young et al., 2010), which accounts for gene-length induced biases. Regions spanning junctions were downloaded from the UCSC Genome Browser (Kent et al., 2002) using BSgenome (version 1.34.0), and their sequence logos were created using seqLogo (1.32.1). Principal component analysis was performed using prcomp, with normalization performed by ggbiplot (version 0.55). Additional bioinformatic analysis of RNA-seq data, including splicing ratio calculation, is described in the Supplemental Materials.
RT-PCR and gel electrophoresis for validation of discovered altered junctions
RNA extraction from MDS patient samples, cDNA preparation, and RT-PCR followed by gel electrophoresis were carried out as previously described (Okeyo-Owuor et al., 2014). Briefly, total RNA was treated with DNase using the Turbo DNA-free kit (Ambion), and cDNA was generated using the Superscript III reverse transcriptase kit (Invitrogen). PCR products were electrophoresed in TBE-polyacrylamide gels and stained with ethidium bromide for imaging. Densitometry was performed using ImageJ. PCR primers are described in the Supplemental Materials.
All patients provided written consent on a protocol approved by the Washington University Human Studies Committee.
Statistical Analyses
Statistical analysis and generation of graphical presentations of data were performed using analysis functions in GraphPad Prism 6 and as described in the Supplemental Materials for RNA-seq analysis.
Accession Number
The RNA-seq data discussed in this publication have been deposited in NCBI’s Gene Expression Omnibus (Edgar et al., 2002) and are accessible through the GEO Series accession number GSE66793.
Supplementary Material
SIGNIFICANCE.
Mutations in spliceosome genes occur in up to ~50% of patients with myelodysplastic syndromes (MDS), suggesting that perturbations in pre-mRNA splicing contribute to disease pathogenesis. We generated a murine model of the most common mutation in the spliceosome gene U2AF1 and observed hematopoietic phenotypes and pre-mRNA splicing alterations that also occur in MDS and acute myeloid leukemia patients. Concordant changes in isoform expression of RNA processing genes, ribosomal genes, and recurrently mutated genes in myeloid cancers in the mouse and human highlight cellular processes and pathways that may functionally contribute to mutant U2AF1-associated diseases. Determining whether splicing changes in the same genes are induced by other MDS-associated spliceosome gene mutations may further prioritize key target genes in MDS.
Acknowledgments
Support was provided by NIH/NHLBI (T32HL007088 to CLS), Barnes-Jewish Hospital Foundation (BSW, TAG, MJW), an NIH/NCI SPORE in Leukemia (P50CA171963 to BSW, TAG, and MJW), an NIH/NCI grant (K12CA167540 to BSW), the Edward P. Evans Foundation (TAG, MJW), a Clinical and Translational Award from the NIH National Center for Advancing Translational Sciences (UL1 TR000448 to BSW), a Howard Hughes Medical Institute Physician-Scientist Early Career Award, Leukemia and Lymphoma Society Scholar Award, Department of Defense (BM120018), and Aplastic Anemia and MDS International Foundation (MJW). Technical assistance was provided by the Alvin J. Siteman Cancer Center High Speed Cell Sorting Core and the Tissue Procurement Core supported by an NCI Cancer Center Support Grant (P30CA91842), and the Genome Institute. The authors thank Tianjiao Wang for technical assistance and Drs. Tim Ley and Dan Link for helpful scientific discussions.
Footnotes
Publisher's Disclaimer: This is a PDF file of an unedited manuscript that has been accepted for publication. As a service to our customers we are providing this early version of the manuscript. The manuscript will undergo copyediting, typesetting, and review of the resulting proof before it is published in its final citable form. Please note that during the production process errors may be discovered which could affect the content, and all legal disclaimers that apply to the journal pertain.
AUTHOR CONTRIBUTIONS
The study was designed by: CLS, TAG, MJW
Mouse characterization by: CLS, JNL, SK, JT, MN, EJD, TL
RNA sequencing by: SM, VM, RSF, CF, MO
Bioinformatics analysis was performed by: BSW, MG
Clinical sample validation performed by: SK, JS, BW, TOO
The manuscript was written and edited by: CLS, JNL, BSW, SK, TAG, MJW
All co-authors reviewed and approved the submission.
CONFLICTS OF INTEREST
The authors declare no competing financial interests.
References
- Abdel-Wahab O, Gao J, Adli M, Dey A, Trimarchi T, Chung YR, Kuscu C, Hricik T, Ndiaye-Lobry D, Lafave LM, et al. Deletion of Asxl1 results in myelodysplasia and severe developmental defects in vivo. The Journal of experimental medicine. 2013;210:2641–2659. doi: 10.1084/jem.20131141. [DOI] [PMC free article] [PubMed] [Google Scholar]
- Anders S, Huber W. Differential expression analysis for sequence count data. Genome biology. 2010;11:R106. doi: 10.1186/gb-2010-11-10-r106. [DOI] [PMC free article] [PubMed] [Google Scholar]
- Anders S, Reyes A, Huber W. Detecting differential usage of exons from RNA-seq data. Genome research. 2012;22:2008–2017. doi: 10.1101/gr.133744.111. [DOI] [PMC free article] [PubMed] [Google Scholar]
- Bacher U, Haferlach T, Schnittger S, Zenger M, Meggendorfer M, Jeromin S, Roller A, Grossmann V, Krauth MT, Alpermann T, et al. Investigation of 305 patients with myelodysplastic syndromes and 20q deletion for associated cytogenetic and molecular genetic lesions and their prognostic impact. British journal of haematology. 2014;164:822–833. doi: 10.1111/bjh.12710. [DOI] [PubMed] [Google Scholar]
- Barlow JL, Drynan LF, Hewett DR, Holmes LR, Lorenzo-Abalde S, Lane AL, Jolin HE, Pannell R, Middleton AJ, Wong SH, et al. A p53-dependent mechanism underlies macrocytic anemia in a mouse model of human 5q- syndrome. Nature medicine. 2010;16:59–66. doi: 10.1038/nm.2063. [DOI] [PMC free article] [PubMed] [Google Scholar]
- Beard C, Hochedlinger K, Plath K, Wutz A, Jaenisch R. Efficient method to generate single-copy transgenic mice by site-specific integration in embryonic stem cells. Genesis. 2006;44:23–28. doi: 10.1002/gene.20180. [DOI] [PubMed] [Google Scholar]
- Bejar R, Stevenson K, Abdel-Wahab O, Galili N, Nilsson B, Garcia-Manero G, Kantarjian H, Raza A, Levine RL, Neuberg D, Ebert BL. Clinical effect of point mutations in myelodysplastic syndromes. The New England journal of medicine. 2011;364:2496–2506. doi: 10.1056/NEJMoa1013343. [DOI] [PMC free article] [PubMed] [Google Scholar]
- Borel C, Dastugue N, Cances-Lauwers V, Mozziconacci MJ, Prebet T, Vey N, Pigneux A, Lippert E, Visanica S, Legrand F, et al. PICALM-MLLT10 acute myeloid leukemia: a French cohort of 18 patients. Leukemia research. 2012;36:1365–1369. doi: 10.1016/j.leukres.2012.07.008. [DOI] [PubMed] [Google Scholar]
- Brooks AN, Choi PS, de Waal L, Sharifnia T, Imielinski M, Saksena G, Pedamallu CS, Sivachenko A, Rosenberg M, Chmielecki J, et al. A pan-cancer analysis of transcriptome changes associated with somatic mutations in U2AF1 reveals commonly altered splicing events. PloS one. 2014;9:e87361. doi: 10.1371/journal.pone.0087361. [DOI] [PMC free article] [PubMed] [Google Scholar]
- Brown MB. Method for Combining Non-Independent, One-Sided Tests of Significance. Biometrics. 1975;31:987–992. [Google Scholar]
- Buschbeck M, Uribesalgo I, Wibowo I, Rue P, Martin D, Gutierrez A, Morey L, Guigo R, Lopez-Schier H, Di Croce L. The histone variant macroH2A is an epigenetic regulator of key developmental genes. Nature structural & molecular biology. 2009;16:1074–1079. doi: 10.1038/nsmb.1665. [DOI] [PubMed] [Google Scholar]
- Cancer Genome Atlas Research, N. Genomic and epigenomic landscapes of adult de novo acute myeloid leukemia. The New England journal of medicine. 2013;368:2059–2074. doi: 10.1056/NEJMoa1301689. [DOI] [PMC free article] [PubMed] [Google Scholar]
- Catenacci DV, Schiller GJ. Myelodysplasic syndromes: a comprehensive review. Blood reviews. 2005;19:301–319. doi: 10.1016/j.blre.2005.01.004. [DOI] [PubMed] [Google Scholar]
- Chan YA, Hieter P, Stirling PC. Mechanisms of genome instability induced by RNA-processing defects. Trends in genetics: TIG. 2014;30:245–253. doi: 10.1016/j.tig.2014.03.005. [DOI] [PMC free article] [PubMed] [Google Scholar]
- Chia NY, Chan YS, Feng B, Lu X, Orlov YL, Moreau D, Kumar P, Yang L, Jiang J, Lau MS, et al. A genome-wide RNAi screen reveals determinants of human embryonic stem cell identity. Nature. 2010;468:316–320. doi: 10.1038/nature09531. [DOI] [PubMed] [Google Scholar]
- Damm F, Kosmider O, Gelsi-Boyer V, Renneville A, Carbuccia N, Hidalgo-Curtis C, Della Valle V, Couronne L, Scourzic L, Chesnais V, et al. Mutations affecting mRNA splicing define distinct clinical phenotypes and correlate with patient outcome in myelodysplastic syndromes. Blood. 2012;119:3211–3218. doi: 10.1182/blood-2011-12-400994. [DOI] [PubMed] [Google Scholar]
- Ebert BL, Pretz J, Bosco J, Chang CY, Tamayo P, Galili N, Raza A, Root DE, Attar E, Ellis SR, Golub TR. Identification of RPS14 as a 5q- syndrome gene by RNA interference screen. Nature. 2008;451:335–339. doi: 10.1038/nature06494. [DOI] [PMC free article] [PubMed] [Google Scholar]
- Edgar R, Domrachev M, Lash AE. Gene Expression Omnibus: NCBI gene expression and hybridization array data repository. Nucleic acids research. 2002;30:207–210. doi: 10.1093/nar/30.1.207. [DOI] [PMC free article] [PubMed] [Google Scholar]
- Eisfeld AK, Schwind S, Hoag KW, Walker CJ, Liyanarachchi S, Patel R, Huang X, Markowitz J, Duan W, Otterson GA, et al. NRAS isoforms differentially affect downstream pathways, cell growth, and cell transformation. Proceedings of the National Academy of Sciences of the United States of America. 2014;111:4179–4184. doi: 10.1073/pnas.1401727111. [DOI] [PMC free article] [PubMed] [Google Scholar]
- Flicek P, Ahmed I, Amode MR, Barrell D, Beal K, Brent S, Carvalho-Silva D, Clapham P, Coates G, Fairley S, et al. Ensembl 2013. Nucleic acids research. 2013;41:D48–55. doi: 10.1093/nar/gks1236. [DOI] [PMC free article] [PubMed] [Google Scholar]
- Gaspar-Maia A, Qadeer ZA, Hasson D, Ratnakumar K, Leu NA, Leroy G, Liu S, Costanzi C, Valle-Garcia D, Schaniel C, et al. MacroH2A histone variants act as a barrier upon reprogramming towards pluripotency. Nature communications. 2013;4:1565. doi: 10.1038/ncomms2582. [DOI] [PMC free article] [PubMed] [Google Scholar]
- Gentleman RC, Carey VJ, Bates DM, Bolstad B, Dettling M, Dudoit S, Ellis B, Gautier L, Ge Y, Gentry J, et al. Bioconductor: open software development for computational biology and bioinformatics. Genome biology. 2004;5:R80. doi: 10.1186/gb-2004-5-10-r80. [DOI] [PMC free article] [PubMed] [Google Scholar]
- Graubert TA, Shen D, Ding L, Okeyo-Owuor T, Lunn CL, Shao J, Krysiak K, Harris CC, Koboldt DC, Larson DE, et al. Recurrent mutations in the U2AF1 splicing factor in myelodysplastic syndromes. Nature genetics. 2011;44:53–57. doi: 10.1038/ng.1031. [DOI] [PMC free article] [PubMed] [Google Scholar]
- Haferlach T, Nagata Y, Grossmann V, Okuno Y, Bacher U, Nagae G, Schnittger S, Sanada M, Kon A, Alpermann T, et al. Landscape of genetic lesions in 944 patients with myelodysplastic syndromes. Leukemia. 2014;28:241–247. doi: 10.1038/leu.2013.336. [DOI] [PMC free article] [PubMed] [Google Scholar]
- Hamblin T. Clinical features of MDS. Leukemia research. 1992;16:89–93. doi: 10.1016/0145-2126(92)90106-h. [DOI] [PubMed] [Google Scholar]
- Ilagan JO, Ramakrishnan A, Hayes B, Murphy ME, Zebari AS, Bradley P, Bradley RK. U2AF1 mutations alter splice site recognition in hematological malignancies. Genome research. 2014 doi: 10.1101/gr.181016.114. [DOI] [PMC free article] [PubMed] [Google Scholar]
- Jangi M, Sharp PA. Building robust transcriptomes with master splicing factors. Cell. 2014;159:487–498. doi: 10.1016/j.cell.2014.09.054. [DOI] [PMC free article] [PubMed] [Google Scholar]
- Kandoth C, McLellan MD, Vandin F, Ye K, Niu B, Lu C, Xie M, Zhang Q, McMichael JF, Wyczalkowski MA, et al. Mutational landscape and significance across 12 majo cancer types. Nature. 2013;502:333–339. doi: 10.1038/nature12634. [DOI] [PMC free article] [PubMed] [Google Scholar]
- Kent WJ, Sugnet CW, Furey TS, Roskin KM, Pringle TH, Zahler AM, Haussler D. The human genome browser at UCSC. Genome research. 2002;12:996–1006. doi: 10.1101/gr.229102. [DOI] [PMC free article] [PubMed] [Google Scholar]
- Kim D, Pertea G, Trapnell C, Pimentel H, Kelley R, Salzberg SL. TopHat2: accurate alignment of transcriptomes in the presence of insertions, deletions and gene fusions. Genome biology. 2013;14:R36. doi: 10.1186/gb-2013-14-4-r36. [DOI] [PMC free article] [PubMed] [Google Scholar]
- Ma X. Epidemiology of myelodysplastic syndromes. The American journal of medicine. 2012;125:S2–5. doi: 10.1016/j.amjmed.2012.04.014. [DOI] [PMC free article] [PubMed] [Google Scholar]
- Okeyo-Owuor T, White BS, Chatrikhi R, Mohan DR, Kim S, Griffith M, Ding L, Ketkar-Kulkarni S, Hundal J, Laird KM, et al. U2AF1 mutations alter sequence specificity of pre-mRNA binding and splicing. Leukemia. 2014 doi: 10.1038/leu.2014.303. [DOI] [PMC free article] [PubMed] [Google Scholar]
- Pang WW, Pluvinage JV, Price EA, Sridhar K, Arber DA, Greenberg PL, Schrier SL, Park CY, Weissman IL. Hematopoietic stem cell and progenitor cell mechanisms in myelodysplastic syndromes. Proceedings of the National Academy of Sciences of the United States of America. 2013;110:3011–3016. doi: 10.1073/pnas.1222861110. [DOI] [PMC free article] [PubMed] [Google Scholar]
- Papaemmanuil E, Cazzola M, Boultwood J, Malcovati L, Vyas P, Bowen D, Pellagatti A, Wainscoat JS, Hellstrom-Lindberg E, Gambacorti-Passerini C, et al. Somatic SF3B1 mutation in myelodysplasia with ring sideroblasts. The New England journal of medicine. 2011;365:1384–1395. doi: 10.1056/NEJMoa1103283. [DOI] [PMC free article] [PubMed] [Google Scholar]
- Papaemmanuil E, Gerstung M, Malcovati L, Tauro S, Gundem G, Van Loo P, Yoon CJ, Ellis P, Wedge DC, Pellagatti A, et al. Clinical and biological implications of driver mutations in myelodysplastic syndromes. Blood. 2013;122:3616–3627. doi: 10.1182/blood-2013-08-518886. quiz 3699. [DOI] [PMC free article] [PubMed] [Google Scholar]
- Pellagatti A, Hellstrom-Lindberg E, Giagounidis A, Perry J, Malcovati L, Della Porta MG, Jadersten M, Killick S, Fidler C, Cazzola M, et al. Haploinsufficiency of RPS14 in 5q- syndrome is associated with deregulation of ribosomal- and translation-related genes. British journal of haematology. 2008;142:57–64. doi: 10.1111/j.1365-2141.2008.07178.x. [DOI] [PMC free article] [PubMed] [Google Scholar]
- Przychodzen B, Jerez A, Guinta K, Sekeres MA, Padgett R, Maciejewski JP, Makishima H. Patterns of missplicing due to somatic U2AF1 mutations in myeloid neoplasms. Blood. 2013;122:999–1006. doi: 10.1182/blood-2013-01-480970. [DOI] [PMC free article] [PubMed] [Google Scholar]
- Raza A, Gezer S, Mundle S, Gao XZ, Alvi S, Borok R, Rifkin S, Iftikhar A, Shetty V, Parcharidou A, et al. Apoptosis in bone marrow biopsy samples involving stromal and hematopoietic cells in 50 patients with myelodysplastic syndromes. Blood. 1995a;86:268–276. [PubMed] [Google Scholar]
- Raza A, Mundle S, Iftikhar A, Gregory S, Marcus B, Khan Z, Alvi S, Shetty V, Dameron S, Wright V, et al. Simultaneous assessment of cell kinetics and programmed cell death in bone marrow biopsies of myelodysplastics reveals extensive apoptosis as the probable basis for ineffective hematopoiesis. American journal of hematology. 1995b;48:143–154. doi: 10.1002/ajh.2830480302. [DOI] [PubMed] [Google Scholar]
- Shetty V, Hussaini S, Broady-Robinson L, Allampallam K, Mundle S, Borok R, Broderick E, Mazzoran L, Zorat F, Raza A. Intramedullary apoptosis of hematopoietic cells in myelodysplastic syndrome patients can be massive: apoptotic cells recovered from high-density fraction of bone marrow aspirates. Blood. 2000;96:1388–1392. [PubMed] [Google Scholar]
- Skourti-Stathaki K, Proudfoot NJ. A double-edged sword: R loops as threats to genome integrity and powerful regulators of gene expression. Genes & development. 2014;28:1384–1396. doi: 10.1101/gad.242990.114. [DOI] [PMC free article] [PubMed] [Google Scholar]
- Srinivasan RS, de Erkenez AC, Hemenway CS. The mixed lineage leukemia fusion partner AF9 binds specific isoforms of the BCL-6 corepressor. Oncogene. 2003;22:3395–3406. doi: 10.1038/sj.onc.1206361. [DOI] [PubMed] [Google Scholar]
- Supek F, Minana B, Valcarcel J, Gabaldon T, Lehner B. Synonymous mutations frequently act as driver mutations in human cancers. Cell. 2014;156:1324–1335. doi: 10.1016/j.cell.2014.01.051. [DOI] [PubMed] [Google Scholar]
- Thol F, Kade S, Schlarmann C, Loffeld P, Morgan M, Krauter J, Wlodarski MW, Kolking B, Wichmann M, Gorlich K, et al. Frequency and prognostic impact of mutations in SRSF2, U2AF1, and ZRSR2 in patients with myelodysplastic syndromes. Blood. 2012;119:3578–3584. doi: 10.1182/blood-2011-12-399337. [DOI] [PubMed] [Google Scholar]
- Troy JD, Atallah E, Geyer JT, Saber W. Myelodysplastic syndromes in the United States: an update for clinicians. Annals of medicine. 2014;46:283–289. doi: 10.3109/07853890.2014.898863. [DOI] [PubMed] [Google Scholar]
- Visconte V, Makishima H, Jankowska A, Szpurka H, Traina F, Jerez A, O’Keefe C, Rogers HJ, Sekeres MA, Maciejewski JP, Tiu RV. SF3B1, a splicing factor is frequently mutated in refractory anemia with ring sideroblasts. Leukemia. 2011;26:542–545. doi: 10.1038/leu.2011.232. [DOI] [PubMed] [Google Scholar]
- Wahl MC, Will CL, Luhrmann R. The spliceosome: design principles of a dynamic RNP machine. Cell. 2009;136:701–718. doi: 10.1016/j.cell.2009.02.009. [DOI] [PubMed] [Google Scholar]
- Walter MJ, Shen D, Shao J, Ding L, White BS, Kandoth C, Miller CA, Niu B, McLellan MD, Dees ND, et al. Clonal diversity of recurrently mutated genes in myelodysplastic syndromes. Leukemia. 2013;27:1275–1282. doi: 10.1038/leu.2013.58. [DOI] [PMC free article] [PubMed] [Google Scholar]
- Woll PS, Kjallquist U, Chowdhury O, Doolittle H, Wedge DC, Thongjuea S, Erlandsson R, Ngara M, Anderson K, Deng Q, et al. Myelodysplastic syndromes are propagated by rare and distinct human cancer stem cells in vivo. Cancer cell. 2014;25:794–808. doi: 10.1016/j.ccr.2014.03.036. [DOI] [PubMed] [Google Scholar]
- Wu S, Romfo CM, Nilsen TW, Green MR. Functional recognition of the 3′ splice site AG by the splicing factor U2AF35. Nature. 1999;402:832–835. doi: 10.1038/45590. [DOI] [PubMed] [Google Scholar]
- Yoshida K, Sanada M, Shiraishi Y, Nowak D, Nagata Y, Yamamoto R, Sato Y, Sato-Otsubo A, Kon A, Nagasaki M, et al. Frequent pathway mutations of splicing machinery in myelodysplasia. Nature. 2011;478:64–69. doi: 10.1038/nature10496. [DOI] [PubMed] [Google Scholar]
- Yoshida Y. Hypothesis: apoptosis may be the mechanism responsible for the premature intramedullary cell death in the myelodysplastic syndrome. Leukemia. 1993;7:144–146. [PubMed] [Google Scholar]
- Young MD, Wakefield MJ, Smyth GK, Oshlack A. Gene ontology analysis for RNA-seq: accounting for selection bias. Genome biology. 2010;11:R14. doi: 10.1186/gb-2010-11-2-r14. [DOI] [PMC free article] [PubMed] [Google Scholar]
Associated Data
This section collects any data citations, data availability statements, or supplementary materials included in this article.