Abstract
Photodynamic therapy (PDT) dose, D, is defined as the absorbed dose by the photosensitizer during photodynamic therapy. It is proportional to the product of photosensitizer concentration and the light fluence. This quantity can be directly characterized during PDT and is considered to be predictive of photodynamic efficacy under ample oxygen supply. For type-II photodynamic interaction, the cell killing is caused by the reaction of cellular acceptors with singlet oxygen. The production of singlet oxygen can be expressed as ηD, where η is the singlet oxygen quantum yield and is a constant under ample oxygen supply. For most PDT, it is desirable to also take into account the effect of tissue oxygenation. We have modeled the coupled kinetics equation of the concentrations of the singlet oxygen, the photosensitizers in ground and triplet states, the oxygen, and tissue acceptors along with the diffusion equation governing the light transport in turbid medium. We have shown that it is possible to express η as a function of local oxygen concentration during PDT and this expression is a good approximation to predict the production of singlet oxygen during PDT. Theoretical estimation of the correlation between the tissue oxygen concentration and hemoglobin concentration, oxygen saturation, and blood flow is presented.
Keywords: photodynamic therapy, singlet oxygen production, oxygen dependence of singlet oxygen quantum yield
1. Introduction
Photodynamic therapy (PDT) is a cancer treatment modality based on the interaction of light, a photosensitizing drug, and oxygen.1 PDT has been approved by the US Food and Drug Administration for the treatment of microinvasive lung cancer, obstructing lung cancer, and obstructing esophageal cancer and Barrett's esophagus with high grade dysplasia, as well as for age-related macular degeneration and actinic keratosis.2
To quantify the photodynamic efficacy, the current start of art in clinical PDT dosimetry uses a quantity called PDT dose,3 defined as the number of photons absorbed by photosensitizing drug per gram of tissue [ph/g], i.e.,
| 1 |
where ρ is the density of tissue [g/cm3], φ is the light fluence rate [W/cm2], hv is the energy of a photon [J/ph], c is the drug concentration in tissue [μM], ε is the extinction coefficient of the photosensitizer [1/cm/μM]. The photodynamic dose (D) does not consider the quantum yield (η) of oxidative radicals, the effect of tissue oxygenation on η, or the fraction (f) of radicals that oxidize cellular targets. Thus, it is only applicable in cases where ample oxygen supplies exist. For type-II photodynamic interaction, production of singlet oxygen is responsible for the PDT damage. The production of singlet oxygen that has damaged the cellular targets can be expressed as:4
| 2 |
where f depends on the localization of the photosensitizer at the cell level and thus depends on the photosensitizer and tissue types, the quantum yield η gives the number of singlet oxygen molecules produced per an absorbed photon, which is a constant under ample oxygen supply. However, when insufficient oxygen supply exists, η is also a function of the oxygen concentration, or pO2, in tissue. (We explain later why the PDT dose multiplied the tissue mass density, or ρD [ph/cm3] is used in Eq. (2)).
The purpose of this study is to establish the relationship between the singlet oxygen concentration and the PDT dose under arbitrary oxygen supply conditions. This is achieved by solving the coupled kinetics equations describing the macroscopic process of the generation of singlet oxygen and the diffusion equations describing the light transport assuming the 3-dimensional distribution of photosensitizers can be independently characterized during PDT. Since the oxygen concentration in tissue is a local quantity that cannot be easily measured. We have also presented a model that can be used to determine the local oxygen concentration by measuring the macroscopic quantities related to oxygen supplies in the blood vessel, i.e., hemoglobin concentration, oxygen saturation, and blood flow.
2. Method
The majority of photosensitizers available for PDT utilize Type II photodynamic processes, i.e., the photodynamic effect is achieved through the production of singlet oxygen.5, 6 The Jablonski diagram shown in Fig. 1 summarizes the underlying physical processes involved in type-II PDT. The process begins with the absorption of a photon by photosensitizer in its ground state, promoting it to an excited state. The photosensitizer molecule can return to its ground state by emission of a fluorescence photon, which can be used for fluorescence detection. Alternatively, the molecule may convert to a triplet state, a process known as intersystem crossing (ISC). A high intersystem-crossing yield is an essential feature of a good Type II photosensitizer. Once in its triplet state, the molecule may undergo a collisional energy transfer with ground state molecular oxygen (type II) or with the substrate (type I). In type II interaction, the photosensitzer returns to its ground state, and oxygen is promoted from its ground state (a triplet state) to its excited (singlet) state. Since the photosensitizer is not consumed in this process, the same photosensitizer molecule may create many singlet oxygen molecules.
Figure 1.
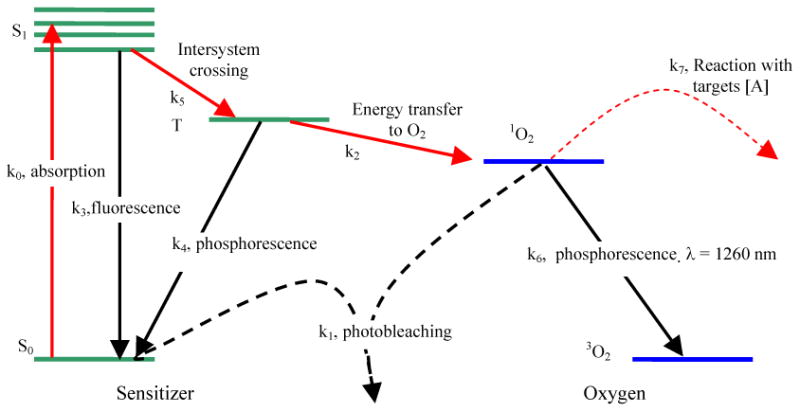
Jablonski diagram of photosensitized singlet oxygen formation by Type II photosensitizer. The rate constants for monomolecular transition (solid lines) and bimolecular energy transfer (dashed lines) are indicated.
Once the singlet oxygen is created, it reacts almost immediately with cellular targets in its immediate vicinity. The majorities of these reactions are irreversible, and lead to consumption of oxygen. This consumption of oxygen is efficient enough to cause measurable decreases in tissue oxygenation when the incident light intensity is high enough. In addition to its reactions with cellular targets, singlet oxygen may react with the photosensitizer itself. This leads to its irreversible destruction (photobleaching). Photobleaching can decrease the effectiveness of PDT by reducing the photosensitizer concentration, however it can also be useful for dosimetry.7 Because of its high reactivity, singlet oxygen has a very short lifetime in tissue. However, a small fraction of the singlet oxygen produced may return to its ground state via emission of a phosphorescence photon, which can be detected optically.8, 9
2.1 Macroscopic kinetics rate equations
We adopted the rate equation approach first proposed by Foster et al 10 and later refined by Hu et al 11 to describe the PDT kinetics process. We use ki (i = 0, 1, …, 7) to designate the reaction rate. The details of the reactions associated with the reaction rates and the species involved are summarized below:
The PDT process started by the absorption of light by the photosensitizer in the ground state, S0, and it excites to the singlet state S1. The S1 state will spontaneously decay to the ground state, S0, by emission of a fluorescent photon.
This is a reversible process. The monomolecular reaction rate k0 (1/s) is proportional to the light fluence φ (in unit of W/cm2): , where ε is the extinction coefficient (in unit of cm-1/μM), hv is the photon energy (in unit of Joule).
The monomolecular reaction rate k3= 1/τ3 (in units of 1/s) is the inverse of the relaxation time τ1 from S1 to S0 due to fluorescence. The photosensitizer in the ground state can interact with the singlet oxygen and produce photoproduct [SO2]. The bimolecular reaction rate, k1 (in unit of 1/s/μM), describes the irreversible photobleaching reaction of the photosensitizer:
Similarly, the bimolecular reaction rate, SΔk2 (in unit of 1/s/μM) describe the production of singlet oxygen caused by the collisions between the photosensitizer triplet state [T] and the ground state oxygen [3O2] to create the singlet oxygen [1O2]. The second equation illustrates that a fraction (SΔ) of interaction between [T] and [3O2] does not yield singlet oxygen.
The phosphorescence and inter-system crossing of the photosensitizer are described by the monomolecular reaction rate k4 and k5 (in units of 1/s), respectively:
The phosphorescence of singlet oxygen and the oxidation of acceptors [A] are described by the reaction rates k6 and k7, respectively:
Here [S0], [S1], and [T] also describes the concentration of the ground, excited, and triplet state of the photosensitizer molecule, respectively. [1O2] and [3O2] is the concentration of singlet and triplet (ground) state of the oxygen, respectively, and [A] is the concentration of all singlet oxygen acceptors except for the photosensitizer itself. [SO2], [AO2] are the concentrations of oxidation products.
The kinetics of the above processes can be described by the coupled differential equations:
| 3 |
| 4 |
| 5 |
| 6 |
| 7 |
| 8 |
Where P is the oxygen diffusion and perfusion rate and can be treated as a known constant. SΔ is the fraction of interaction between [3O2] and [T] that resulted in production of singlet oxygen. The values of the various parameters for Photofrin are listed in Table 1.
Table 1.
Parameters used in the macroscopic kinetics equations for Photofrin.
| Sym. | Definition | Values | References |
|---|---|---|---|
| k0 | PS absorb. rate at φ =100 mW/cm2 | 1.9 s-1 | 12 |
| k1 | Photobleaching rate | 1.2 × 10⁵ 1/μM·s | 11 |
| k2 | Reaction rate of 3O2 with T | 100 1/μM·s | 13 for k4/k2=12.1 μM |
| k3 | Rate of S1 to S0 | 2.0 × 1071/s | 13 for k5/(k5+k3)= 0.80 |
| k4 | Rate of T to S0 | 1250 1/s | 10 |
| k5 | Rate of S1 to T | 8.0 × 1071/s | 11 |
| k6 | Rate of 1O2 to 3O2 | 1 × 10⁶ 1/s | 11 |
| k7 | Reaction rate of 1O2 with [A] | 2.6 × 10⁶ 1/μM·s | 13 for k1/k7[A]=56.5M-1 |
| ε | Extinction coefficient of [S0] | 0.0036 cm-1/μM | 12 |
| SΔ | Fraction 1O2 from reaction [T] and [3O2] | 0.5 | 13 |
| P | Oxygen Diffusion and Perfusion rate | 1.66 × 10⁻² μM/s | 11 |
| [S0]i | PS concentration | 8.5 μM* (= 5 mg/kg) | 14 |
| [S1]i | Init. Con. | 0 μM | 11 |
| [T]i | Init. Con. | 0 μM | 11 |
| [3O2]i | Init. Con. | 83μM | 13 |
| [1O2]i | Init. Con. | 0 μM | 11 |
| [A]i | Init. Con. | 830 μM | 11 |
1 μM = 6.022 × 1014 cm-3.
It should be emphasized that the first term in Eq. (3), k0[S0] is the rate of PDT dose, as that defined in Eq. (1), multiplied by the tissue mass density ρ. The light fluence rate, φ, describes the light propagation in tissue and follows a diffusion equation:
| 9 |
where μa = μ0 + ε[S0] (in cm-1) and μs′ (in cm-1) are the absorption and reduced scattering coefficients in tissue, and S (in W) is the source strength. For a point source in an infinite turbid medium, one can provide an analytical solution to Eq. (9) as:
| 10 |
where S is the light source strength (in W), r is the radial distance from the point source, and is the effective attenuation coefficient. For a given photosensitizer, the reaction rates (k0 – k7) are considered constants.
The rate equation is implemented in the COMSOL finite-element modeling (FEM) package (COMSOL AB, Stockholm, Sweden). The calculation time is in seconds for the rate equation alone and tens of minutes for the time and spatially coupled differential equations.
2.2 Oxygen dependence of the singlet oxygen quantum yield
The life time of the singlet and triplet states of photosensitizer ([S1] and [T]) and the singlet oxygen (1O2) are very short (ns – μs time scale) since they either decay or react with cellular targets immediately after they are created. Thus, it is reasonable to set the time dependences, d[S1]/dt, d[T]/dt, and d[1O2]/dt to be zero for Eqs. (4), (5), (7). Thus, the coupled kinetics equations (3) – (8) can be rewritten as:
| 11 |
| 12 |
| 13 |
| 14 |
and
| 15 |
We have replaced k1[S0] + k7[A] by k7[A] in Eq. 15 since k1[S0]«k7[A]. Equation (11) describes the relationship between the singlet oxygen concentration and the PDT dose rate, Ḋ = k0 · [S0] / ρ. Once the time dependence of the singlet oxygen concentration [1O2] is known, one can solve Eq. (8) for the destruction of the acceptors:
| 16 |
Thus, the threshold value of cumulative singlet oxygen production for sufficient cellular target killing is assuming [A]/[A]0 = 10-2. However, this quantity has no unit. To maintain the unit of concentration (μM) for singlet oxygen production, an alternative quantity is the concentration of singlet oxygen that has interacted with the tissue, [1O2]rx. By integrating Eq. (8) and setting [1O2]rx to equal to the reduction of cellular targets as a fraction of acceptors [A]:
| 17 |
where f is the fraction of acceptors [A] that is the cellular target. Substituting Eq. (11) into Eq. (17) and compared the results with Eq. (2), we can determine the expression for the singlet oxygen quantum yield as:
| 18 |
| 19 |
Equation 18 is the expression of singlet oxygen quantum yield under the condition of arbitrary tissue oxygen concentration [3O2] during PDT. ρ = 1 g/cm3 for tissue. To use this expression for a particular photo sensitizer, one needs to know the parameters k5/(k5+k3), k4/k2, and k7[A]/k6 (see Table 3). Under ample oxygen supply, Eq. 19 returns to the form of Eq. 2. The local tissue oxygenation [3O2] cannot be directly measured using absorption spectroscopy. We provide some preliminary result of microscopic modeling of the diffusion process to correlate the tissue oxygenation with the measured quantities inside the blood vessel, such as total hemoglobin concentration, the oxygen saturation, SO2, and the blood flow speed.
Table 3. Parameters for selected photosensitizers.
2.3 Tissue oxygen concentration vs. THC, SO2, and blood flow
Governing Equations
Tumor tissue is represented as an array of uniformly spaced Krogh cylinders with capillaries along the axes. Each cylinder is assumed to be supplied oxygen exclusively from the capillary within it (Fig 2.).
Figure 2.
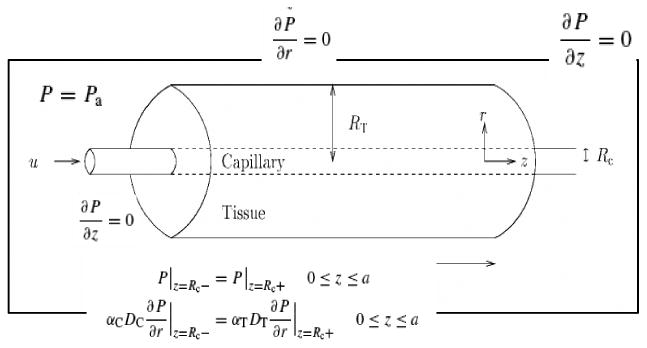
Schematics of the capillary cylinder used in our model.
In the capillary, the equations governing oxygen transport are:
| 20 |
where P (mmHg) is the partial pressure of oxygen in the capillary, αc (μM/mmHg) is the oxygen solubility in the capillary, Dc (μm2/s) is the diffusion coefficient of oxygen in the capillary, u (μm/s) is the speed of blood flow, CH (μM) is the oxygen carrying capacity of hemoglobin at 100% saturation and S is the fractional hemoglobin saturation described using Hill equation:15
| 21 |
where P50 is the pO2 at which hemoglobin is 50% saturated and n is a constant describing the cooperative binding of oxygen to hemoglobin. 15-17
The governing equation in the tumor tissue is given by:
| 22 |
where αt (μM/mmHg) is the oxygen solubility in the tumor tissue, Dt (μm2/s) is the diffusion coefficient of oxygen in the tumor tissue, q(P) (μM/s) is the oxygen consumption rate per unit volume of the tissue cylinder. With Michaelis-Menten kinetics, q(P)=q0P/(P+Pm), where q0 (μM/s) is the oxygen demand, i.e., the consumption when the oxygen supply is not limiting, and Pm is the pO2 at which consumption is half of the demand.16, 18 Notice that PDT consumption of oxygen is not considered in the above equations, thus the conclusion is only valid before (or after) PDT treatment.
Boundary Conditions
At the capillary-tissue interface, both pO2 and oxygen flux must be continuous.16 , and . P is initially in equilibrium with tumor arterial blood, so where Pts is the tumor oxygen supply pO2. At all the other boundaries, the flux of dissolved oxygen per unit area is zero,16 described as an insulation boundary . The differential equation is solved using COMSOL FEM package.
Parameter values
Parameter values are chosen to represent blood flow in various tumor tissues and are listed in Table 2.
Table 2.
Summary of parameter values used in the oxyeen diffusion model.
| Parameter | Description | Value | References |
|---|---|---|---|
| Rc | Capillary radius | 4∼10 μm | 19 |
| Rt | Tissue radius | 18∼65 μm | 20 |
| z | Length of capillary | 220 μm | 16 |
| u | Blood velocity in capillary | 50∼750 μm/s | 16, 18 |
| CH | Plasma oxygen carrying capacity | 9000 μM | 16 |
| αc | Oxygen solubility in plasma | 1.527 μM/mmHg | 16 |
| αt | Oxygen solubility in tissue | 1.295 μM/mmHg | 16 |
| P50 | Half maximum hemoglobin saturation | 26mmHg | 20 |
| Pm | Half maximum oxygen consumption | 1mmHg | 20 |
| Pts | Tumor supply pO2 | 20∼40 mmHg | 19 |
| n | Hill constant | 2.7 | 17 |
| Dc | Oxygen capillary diffusion coefficient | 1120 μm2/s | 16 |
| Dt | Oxygen tissue diffusion coefficient | 1700 μm2/s | 16 |
| q0 | Oxygen consumption | 2∼16 μM/s | 21 |
3. Results and Discussion
3.1 Macroscopic modeling of singlet oxygen production
Figure 3 shows the time dependence of singlet oxygen production [1O2], the oxygen consumption [3O2], and the photosensitizer consumption [S0] by solving the coupled rate equations (Eqs. (3) - (8)) for parameters listed in Table 1. For comparison, the production of triplet state [T] and the excited state [S1] of the photosensitizer are also shown. The light fluence rate is 100 mW/cm2.
Figure 3.

The time dependence of [1O2], [3O2], [S0], [S1], and [T] for parameters listed in Table 1 for Photofrin: (a) The concentrations of various components in log time scale (10-10–104s); (b) The concentrations normalized by the maximum concentrations in linear time scale; (c) The concentration normalized by the concentration at t = 40s in linear time scale. Spatial distributions for light fluence rate, photosensitizer concentration, and oxygenation are assumed to be homogeneous.
There are three time regions for temporal changes (Fig. 3). In the first time region (for time less than 1 ms), the initial rise of [S1], [T], and singlet oxygen [1O2] is very rapid, within 1 μs (Fig. 3a). In the second time region (for time in the region of 0.1 ms to 30 seconds), one observes a rapid decrease of triplet and singlet oxygen concentrations, [3O2] and [1O2], and a corresponding increase of [T] (Fig. 3b). In the third region (for time > 30 seconds), photobleaching of the photosensitizer dominates and one observes a decreases of [S0], [S1], [T] and a corresponding increase If one is only interested in the second and the third time regions, then one can set d[S1]/dt, d[T]/dt, and d[1O2]/dt to zero for equations 4, 5, and 7, and solve for the equilibrium concentration of the excited states of oxygen and photosensitizer relative to their ground states.
For Photofrin, the time it takes to consume most of oxygen is in the order of 20 seconds. To illustrate this process, linear time scale is used in Fig. 3b. In this plot, the concentrations are renormalized by the respective maximum concentrations so that they can all be shown in the linear scale. There is significant consumption of oxygen, with the final oxygen concentration ([3O2] > 0) determined by the diffusion and perfusion rate of oxygen (P). The production of singlet oxygen decreases with time due to consumption of oxygen and finally reaches a saturation concentration determined by P/k7[A] (=5.3 × 10⁻² μM). With the consumption of oxygen, the concentration of the triplet state (T) increases with time before reaching an equilibrium value.
Beyond the initial time region (t > 30 seconds), the singlet oxygen and triplet oxygen concentrations will increase with time due to the photobleaching of photosensitizer. This is illustrated in Fig. 3c where the concentrations are normalized to the respective concentrations at t = 40 seconds. For this Photofrin concentration (8.5 μM or 5 mg/kg), the photobleaching of the photosensitizer is quite low (Fig. 3c), the concentration of S1 (proportional to fluorescence signal) decrease slowly with increasing time.
As the light fluence rate increases, the production of singlet oxygen also increases (Fig. 4a). The time it takes to produce the singlet oxygen is roughly the same. However, the occurrence of the initial rapid consumption of singlet oxygen delays with decreasing light fluence rats during PDT (Fig. 4a). The reacted singlet oxygen concentration increases linearly with time for fluence rates (φ ≥ 10mW/cm2) (Fig. 4b).
Figure 4.
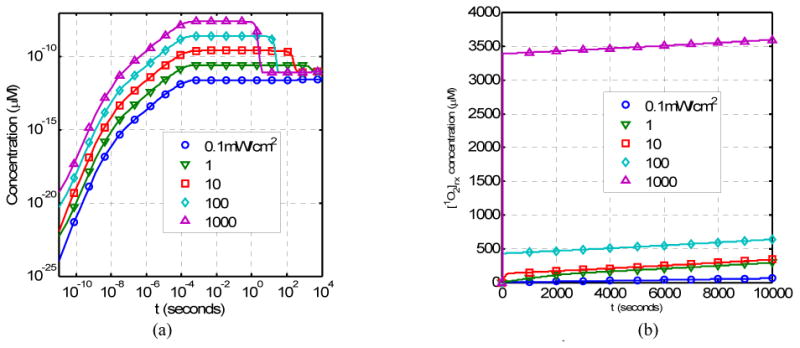
Time dependence of (a) the singlet oxygen concentration [1O2] and (b) the reacted singlet oxygen concentration [1O2]rx as a function of light fluence rate (in unit of mW/cm2).
For a point source within 1 mW power in a homogeneous phantom with a mean optical properties of μa = 0.3 cm-1 and μs′= 14 cm-1,22 the coupled differential equation can be solved to determine both the spatial and time dependence of the singlet oxygen concentration, as shown in Fig. 5a. Clearly the radial distribution of the reacted singlet oxygen concentration is very different from that of the light fluence rate (Fig. 5b).
Figure 5.
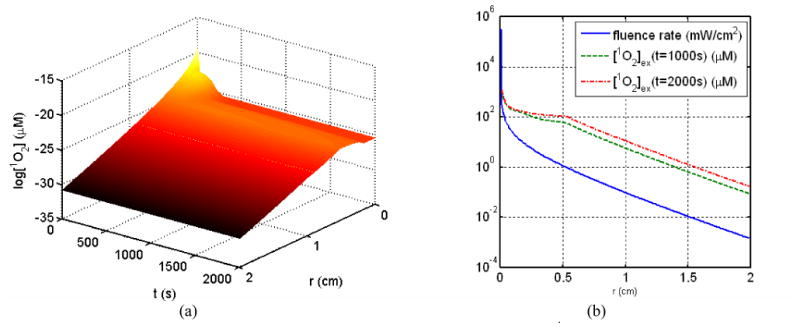
(a) Time and spatial dependence of the singlet oxygen concentration [1O2] (μM) and (b) light fluence rate distribution for a point source. For comparison, the reacted singlet oxygen concentration at 1000s and 2000s are also plotted.
3.2 Relationship between singlet oxygen production and PDT dose
A more general method of establishing a PDT dosimetry protocol is to use the concept of the reacted singlet oxygen concentration, [1O2]rx, as determined in Eq. (19). This equation correlates the measured PDT dose rate with [1O2]rx, without the need of any kinetics modeling. Oxygen dependence of the singlet oxygen quantum yield for a particular photosensitizer depends on the three ratios: k5/(k3+k5), k4/k2, and k7[A]/k6. Table 3 summarizes the known ratios for two photosensitizers based on literature. Since the ratio k7[A]/k6 » 1, the expression for the singlet oxygen quantum yield (Eq. 18) can be simplified as:
| 23 |
One can come to two conclusions based on this expression and Table 3. Firstly, the value of the singlet oxygen quantum yield under ample oxygen supply (second term in parenthesis = 1) has similar values for photofrin and mTHPC. It remains to be seen whether this value is photosensitizer independent. Secondly, as long as the tissue oxygen concentration is larger than k4/k2, or 12 μM, the effect of oxygen consumption can be ignored. This situation applies to cases where PDT effect is mostly vascular, i.e., the damage to the blood vessel dominates, since the tissue oxygen concentration in blood vessel is usually larger than 100 μM (see Fig. 6).
Figure 6.
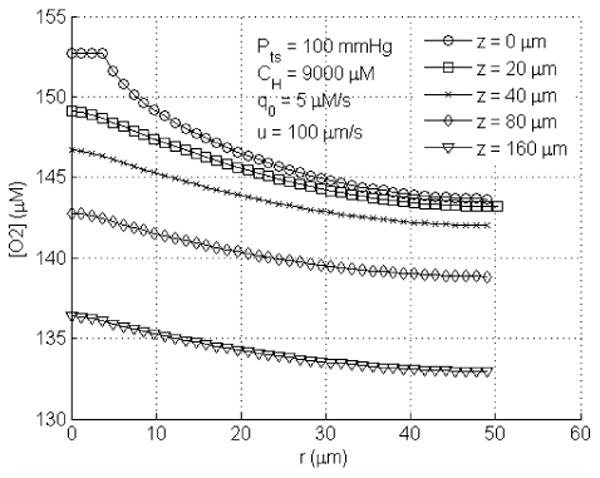
Radial profile of pO2 for q0=5μM/s, at upstream end (z=0μm), midpoints (z=20, 40, and 80μm) and downstream end (z=160μm) of the tumor tissue cylinder. The tumor supply pO2 used here is Pts = 100 mmHg.
We emphasize that the spatial distribution of the reacted singlet oxygen concentration,
can be determined using the measured 3D distribution of light fluence rate and the photosensitizer concentration in real-time. This further underscores the importance of explicit PDT dosimetry of these quantities in real-time.
3.3 Tissue oxygen concentration vs. THC, SO2, and blood flow
Macroscopic measurement of total hemoglobin concentration (THC), oxygen saturation (SO2) and blood flow in blood vessel needs to be correlated to the local tissue oxygen concentration in order to determine the singlet oxygen quantum yield (Eq. 23). This correlation is complicated because it depends on the exact geometrical shape of the capillary and the spacing between capillaries. For a cylindrical capillary, one can calculate the oxygen concentration in tissues surrounding the vessel, as shown in Fig. 6 using parameters listed in Table 1. This figure shows that there is tissue oxygen concentration decreases with increasing distance from the blood vessel. One also observes decrease of oxygen concentration along the blood vessel length.
A preliminary simulation is performed to correlate the mean tissue oxygen concentration vs. the mean tissue oxygen saturation for various conditions. The mean tissue oxygen concentration is calculated as a volumetric average of the tissue oxygen concentration from r = 0 (center of the blood vessel) to outer boundary: . In Fig. 7a, the blood flow speed (u) is varied between 50 and 200μm/s. It seems that the relationship between mean tissue oxygenation and the mean tissue oxygen saturation SO2 are not affected much by the blood flow speed change, when oxygen partial pressure at tumor oxygen supply end is low (Pts < 50 mmHg). On the other hand, when the supply is highly oxygen saturated, the difference in blood flow leads to an approximately 12% difference in mean tissue oxygen concentration. In Fig. 7b, metabolic oxygen consumption rate is varied. The difference in mean tissue oxygen concentration due to different metabolic consumption rate is more pronounced when less saturated oxygen is supplied than when the highly saturated blood is fed to the tumor tissue. However, the difference is not significant for low oxygen consumptions (q0 ≤ 10 μM/s). Thus one can use an average oxygen consumption rate (5μm/s) for all simulations. In Fig 7c, the total (tissue averaged) hemoglobin concentration is defined as: [Hb]tot = (CH / 4)(RC / Rt)2, assuming the hemoglobin concentration in the blood vessel (CH) and inter-capillary distance (tissue cylinder radius Rt) remain constant, and Rc varies from 4 μm to 20 μm. It demonstrates that total hemoglobin concentration has no effect on the relationship between the mean tissue oxygen concentration and SO2. As shown in Fig 7c., four curves overlapping each other, indicating that mean tissue oxygen saturation can be the only input parameter needed to estimate the corresponding mean tissue oxygen concentration. Our geometry may not be representative for the complex tumor vascular architecture since all the simulations are performed on the Krogh single cylinder geometry. Further simulations with complex geometry should be performed. Also notice that these simulations are performed before photodynamic therapy. Additional consumption of oxygen occurs during PDT and these curves cannot be used to estimate the mean tissue oxygen concentration.
Figure 7.
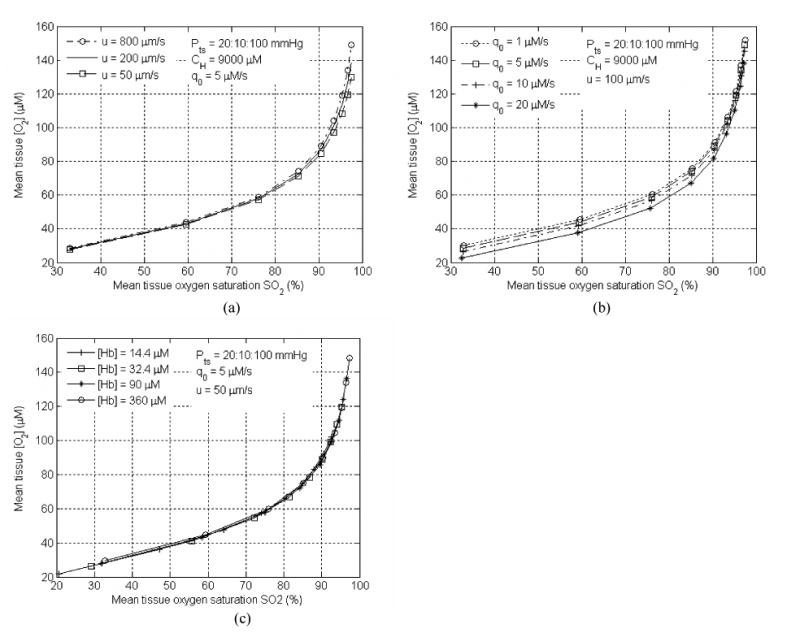
Tissue oxygen concentration vs. SO2 under different (a) blood flow velocity (u), (b) metabolic oxygen consumption rate (q0), and (c) various THC concentrations ([Hb]tol). Rc = 4 μm for (a) and (b) and varies for (c). Rt = 50 μm for all cases.
4. Conclusions
We have shown that using a set of rate equations, one can calculate the production of singlet oxygen. Under 3D heterogeneity of light fluence rate, photosensitizer concentration, and tissue oxygenation, it is suggested to use the reacted singlet oxygen as a dosimetry quantity to monitor and optimize during PDT. Our simulation of PDT kinetics shows low photobleaching rate during clinical PDT and also showed a market difference between light fluence rate distribution and the reacted singlet oxygen concentration, [1O2]rx. Preliminary study has shown that one can correlate the tissue oxygenation with the macroscopic quantity measured in the blood vessel, such as SO2. Further studies are necessary to determine the relationship between the mean oxygen concentration and the macrosopic measurement during PDT.
Acknowledgments
This work is supported by grants from Department of Defense (DOD) DAMD17-03-1-0132 and National Institute of Health (NIH) RO1 CA109456 and P01 CA87971.
References
- 1.Dougherty TJ, Gomer DJ, Henderson BW, et al. Photodynamic Therapy. J Natl Cancer Inst. 1998;90:889–905. doi: 10.1093/jnci/90.12.889. [DOI] [PMC free article] [PubMed] [Google Scholar]
- 2.Zhu TC, Finlay JC. Prostate PDT dosimetry. Photodiagnosis and Photodynamic Therapy. 2006;4:234–246. doi: 10.1016/j.pdpdt.2006.08.002. [DOI] [PMC free article] [PubMed] [Google Scholar]
- 3.Patterson MS, Wilson BC, Graff R. In vivo tests of the concept of photodynamic threshold dose in normal rat liver photosensitized by aluminum chlorosulphonated phthalocyanine. Photochem Photobiol. 1990;51:343–349. doi: 10.1111/j.1751-1097.1990.tb01720.x. [DOI] [PubMed] [Google Scholar]
- 4.Hetzel FW, Brahmavar S, Chen Q, Jacques S, Patterson MS, Wilson BC, Zhu TC. AAPM Photodynamic Therapy Dosimetry, Report 88. Med Phys Publishing, city; 2005. [Google Scholar]
- 5.Foote CS. Photosenstizied oxidations and the role of singlet oxygen. Accounts Chem Res. 1967;1:104–110. [Google Scholar]
- 6.Ochsner M. Photophysical and photobiological processes in the photodynamic therapy of tumours. J Photochem Photobiol B. 1997;39:1–18. doi: 10.1016/s1011-1344(96)07428-3. [DOI] [PubMed] [Google Scholar]
- 7.Wilson BC, Patterson MS, Lilge L. Implicit and explicit dosimetry in photodynamic therapy: A new paradigm. Lasers Med Sci. 1997;12:182–199. doi: 10.1007/BF02765099. [DOI] [PubMed] [Google Scholar]
- 8.Niedre MJ, Patterson MS, Giles A, Wilson BC. Imaging of Photodynamically Generated Singlet Oxygen Luminescence In Vivo. Photochem Photobiol. 2005 doi: 10.1562/2005-03-15-TSN-462. [DOI] [PubMed] [Google Scholar]
- 9.Niedre M, Patterson MS, Wilson BC. Direct near-infrared luminescence detection of singlet oxygen generated by photodynamic therapy in cells in vitro and tissues in vivo. Photochem Photobiol. 2002;75:382–91. doi: 10.1562/0031-8655(2002)075<0382:DNILDO>2.0.CO;2. [DOI] [PubMed] [Google Scholar]
- 10.Foster TH, Murant RS, Bryant RG, Knox RS, Gibson SL, Hilf R. Oxygen consumption and diffusion effects in photodynamic therapy. Radiat Res. 1991;126:296–303. doi: 10.2307/3577919. [DOI] [PubMed] [Google Scholar]
- 11.Hu XH, Feng Y, Lu JQ, Allison RR, Cuenca RE, Downie GH, Sibata CH. Modeling of a Type II Photofrin-mediated Photodynamic Therapy Process in a Heterogeneous Tissue Phantom. Photochem Photobiol. 2005;81:1460–1468. doi: 10.1562/2005-05-04-RA-513. [DOI] [PubMed] [Google Scholar]
- 12.Finlay JC, Mitra S, Foster TH. Photobleaching kinetics of Photofrin in vivo and in multicell tumor spheroids indicate multiple simultaneous bleaching mechanisms. Phys Med Biol. 2004;49:4837–4860. doi: 10.1088/0031-9155/49/21/001. [DOI] [PubMed] [Google Scholar]
- 13.Mitra S, Foster TH. Photophysical parameters, photosensitizer retention and tissue optical properties completely account for the higher photodynamic efficacy of meso-tetra-hydroxyphenyl-chlorin vs Photofrin. Photochem Photobiol. 2005;81:849–59. doi: 10.1562/2005-02-22-RA-447. [DOI] [PubMed] [Google Scholar]
- 14.Wang HW, Zhu TC, Putt ME, Solonenko M, Metz J, Dimofte A, Miles J, Fraker DL, Glatstein E, Hahn SM, Yodh AG. In-vivo broadband reflectance measurements of light penetration depth, blood oxygenation, hemoglobin concentration, and drug concentration in human tissues before and after photodynamic therapy. J Biomed Opt. 2005;10 doi: 10.1117/1.1854679. [DOI] [PubMed] [Google Scholar]
- 15.Hill AV. The possible effects of the aggregation of the molecules of hemoglobin on its dissociation curves. J Physiol (Proc) 1910;40:iv–vii. [Google Scholar]
- 16.Whiteley JP, Gavaghan DJ, Hahn CE. Mathematical modelling of oxygen transport to tissue. J Math Biol. 2002;44:503–22. doi: 10.1007/s002850200135. [DOI] [PubMed] [Google Scholar]
- 17.Popel AS. Theory of oxygen transport to tissue. Crit Rev Biomed Eng. 1989;17:257–321. [PMC free article] [PubMed] [Google Scholar]
- 18.Secomb TW, Hsu R, Beamer NB, Coull BM. Theoretical simulation of oxygen transport to brain by networks of microvessels: effects on tumor oxygen supply and demand on tissue hypoxia. Microcirculation. 2000;7:237–47. [PubMed] [Google Scholar]
- 19.Kavanagh BD, Secomb TW, Hsu R, Lin PS, Venitz J, Dewhirst MW. A theoretical model for the effects of reduced hemoglobin-oxygen affinity on tumor oxygenation. Int J Radiat Oncol Biol Phys. 2002;53:172–9. doi: 10.1016/s0360-3016(02)02740-2. [DOI] [PubMed] [Google Scholar]
- 20.McGuire BJ, Secomb TW. A theoretical model for oxygen transport in skeletal muscle under conditions of high oxygen demand. J Appl Physiol. 2001;91:2255–65. doi: 10.1152/jappl.2001.91.5.2255. [DOI] [PubMed] [Google Scholar]
- 21.Pogue BW, Paulsen KD, O'Hara JA, Wilmot CM, Swartz HM. Estimation of oxygen distribution in RIF-1 tumors by diffusion model-based interpretation of pimonidazole hypoxia and eppendorf measurements. Radiat Res. 2001;155:15–25. doi: 10.1667/0033-7587(2001)155[0015:eoodir]2.0.co;2. [DOI] [PubMed] [Google Scholar]
- 22.Zhu TC, Dimofte A, Finlay JC, Stripp D, Busch TM, Miles J, Whittington R, Malkowicz SB, Tochner Z, Glatstein E, Hahn SM. Optical properties of Human Prostate at 732nm measured in vivo during Motexafin Lutetium-mediated photodynamic therapy. Photochem Photobiol. 2005;81:96–105. doi: 10.1562/2004-06-25-RA-216. [DOI] [PMC free article] [PubMed] [Google Scholar]


