Abstract
Chinese men should have a higher prostate-specific antigen (PSA) “gray zone” than the traditional value of 2.5–10.0 ng ml−1 since the incidence of prostate cancer (PCa) in Chinese men is relative low. We hypothesized that PSA density (PSAD) could improve the rate of PCa detection in Chinese men with a PSA higher than the traditional PSA “gray zone.” A total of 461 men with a PSA between 2.5 and 20.0 ng ml−1, who had undergone prostatic biopsy at two Chinese centers were included in the analysis. The men were then further divided into groups with a PSA between 2.5–10.0 ng ml−1 and 10.1–20.0 ng ml−1. Receiver operating characteristic (ROC) curve was used to evaluate the efficacy of PSA and PSAD for the diagnosis of PCa. In men with a PSA of 2.5–10.0 ng ml−1 or 10.1–20.0 ng ml−1, the areas under the ROC curve were higher for PSAD than for PSA. This was consistent across both centers and the cohort overall. When the entire cohort was considered, the optimal PSAD cut-off for predicting PCa in men with a PSA of 2.5–10.0 ng ml−1 was 0.15 ng ml−1 ml−1, with a sensitivity of 64.4% and specificity of 64.6%. The optimal cut-off for PSAD in men with a PSA of 10.1–20.0 ng ml−1 was 0.33 ng ml−1 ml−1, with a sensitivity of 60.3% and specificity of 82.7%. PSAD can improve the effectiveness for PCa detection in Chinese men with a PSA of 2.5–10.0 ng ml−1 (traditional Western PSA “gray zone”) and 10.1–20.0 ng ml−1 (Chinese PSA “gray zone”).
Keywords: area under the receiver operating characteristic curve, prostate cancer, prostate-specific antigen, prostate-specific antigen density
INTRODUCTION
Prostate cancer (PCa) is still the most common cancer and second leading cause of cancer death in Western countries. In the United States, an estimated 233 000 men will receive a diagnosis of PCa and almost 30 000 will die from it in 2014.1 The incidence of PCa in Asian countries has been increasing in recent years, but until date it is still much lower than in Western countries.2 Prostate-specific antigen (PSA) testing has been widely used for more than two decades to detect early PCa. However, its specificity is low, especially in the PSA “gray zone” (PSA 2.5–10.0 ng ml−1).3 Benson et al.4,5 first reported that PSA density (PSAD) could increase the rate of PCa detection and reduce unnecessary prostatic biopsies for men with a PSA in the ȁgray zone.” However, the population used to define the PSA ȁgray zone” was originally from Western countries. Therefore, it is reasonable that the PSA “gray zone” in Asian men may be higher than the traditional value because the incidence of PCa in Chinese men is much lower compared with Western men.2,6 Currently, the Chinese Urological Association recommends that men with a PSA > 10 ng ml−1 undergo prostate biopsy to detect PCa.7 However, men with a PSA of higher than 10 ng ml−1, in countries with low PCa incidence (such as China), may still have a very low probability of harboring PCa.8 To investigate the usefulness of PSAD for detecting PCa in Chinese men, we analyzed two groups of Chinese men undergoing screening for PCa. The first group included men with a PSA of 2.5–10.0 ng ml−1, in the traditional PSA “gray zone,” while the second group included men with a PSA above this range (PSA 10.1–20.0 ng ml−1) - a hypothetical Chinese PSA “gray zone” - using multicenter data. We hypothesized that using PSAD could improve the efficiency of PCa detection in Chinese men with a PSA above the traditional “gray zone” (PSA 10.1–20.0 ng ml−1) (i.e. Chinese PSA “gray zone”).
MATERIALS AND METHODS
The Guangzhou First People's Hospital cohort
After obtaining Institutional Review Board approval, the records of 813 men who had undergone trans-rectal ultrasound (TRUS)-guided systematic prostatic biopsy for suspicion of PCa between December 1999 and December 2012 were retrieved from the Guangzhou First People's Hospital (Guangzhou FPH) computer center. Of these men, 713 had documentation of a PSA and prostate volume (PV) measurements. Only men with more than 10 biopsy cores were included in this analysis. A total of 331 men with a biopsy (≥10 cores) and a PSA of 2.5–20.0 ng ml−1 were included in the study. Within this cohort, 325 men (98.2%) underwent 13 cores prostate biopsy and 6 (1.8%) underwent 10 to 15 cores biopsies (except for 13 cores). A total of 87 men (26.3%) were diagnosed with PCa.
The Zhujiang hospital cohort
After obtaining Institutional Review Board approval, the records of 335 men who had undergone TRUS-guided systematic prostatic biopsy for the diagnosis of PCa between October 2003 and October 2012 were retrieved from Zhujiang hospital. Of these men, 310 had a documented PSA and PV measurement. A total of 130 men with a biopsy (≥10 cores) and a PSA of 2.5–20.0 ng ml−1 were included in the study. Within this cohort, 106 men (81.5%) underwent 15 cores prostate biopsy, 13 (10.0%) underwent 10 cores biopsy and 11 (8.5%) underwent 12 to 14 cores biopsy. A total of 31 (23.8%) men were diagnosed with PCa.
To evaluate the performance of PSAD in diagnosing PCa, subjects were divided into PSA 2.5–10.0 ng ml−1 (traditional PSA “gray zone”) and PSA 10.1–20.0 ng ml−1 (Chinese PSA “gray zone”) groups. Age, PSA, PV, and PSAD were included in the analysis. PV was measured via TRUS before prostate biopsy was performed and calculated using the ellipsoid volume formula: PV (ml) =0.52 × anterior-posterior diameter (cm) × transverse diameter (cm) × superior-inferior diameter (cm). PSAD (ng ml−1 ml−1) was calculated by dividing PSA (ng ml−1) by PV (ml).
Receiver operating characteristic (ROC) curve was used to evaluate and compare the efficiency of PSA and PSAD for diagnosing PCa. The efficacy of diagnosing PCa using different PSA and PSAD cut-offs in men with PSA 2.5–10.0 ng ml−1, 10.1–20.0 ng ml−1, and 2.5–20.0 ng ml−1 were also evaluated. Total efficiency for diagnosing PCa at different PSA and PSAD cut-offs was calculated using the following formula: total efficiency = sensitivity × specificity. The cut-off on the ROC curve the demonstrated maximum efficiency was presumed to be optimal for diagnosing PCa. Mann–Whitney U-test was used to compare differences in age, PSA, PV and PSAD. Univariate and multivariate logistic regression were used to determine which variables (PSAD as a continuous or categorical variable and age as a continuous variable) were predictive of PCa diagnosis. Statistical analyses were performed using SPSS version 18.0 (SPSS Inc., Chicago, IL, USA). All statistical tests were two-sided with a P < 0.05 considered as statistically significant.
RESULTS
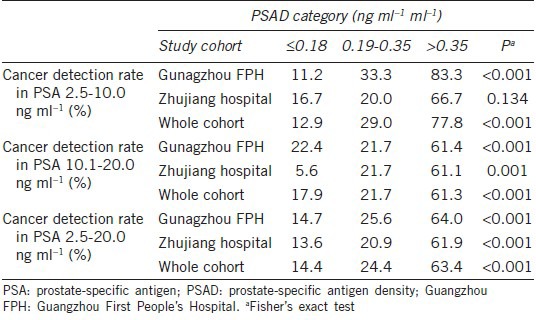
For men with a PSA of 2.5–20.0 ng ml−1, PCa was diagnosed in 87 (26.3%) of the 331 men in the Guangzhou FPH cohort and 31 (23.8%) of the 130 men in the Zhujiang cohort (P = 0.589). In men with a PSA of 2.5–20.0 ng ml−1, the differences in PSA, PV and PSAD for patients with and without PCa in the Guangzhou FPH and Zhujiang hospital groups were not statistical significant (all P > 0.05). Only age at time of biopsy for both cohorts was significant different (both P < 0.05) (Table 1). PCa detection rates increased with increasing PSAD in both cohorts at PSA levels of 2.5–10.0 ng ml−1, 10.1–20.0 ng ml−1 and 2.5–20.0 ng ml−1 (all P < 0.001) (Table 2).
Table 1.
Clinical variables for men with and without PCa with a PSA 2.5-20.0 ng ml−1
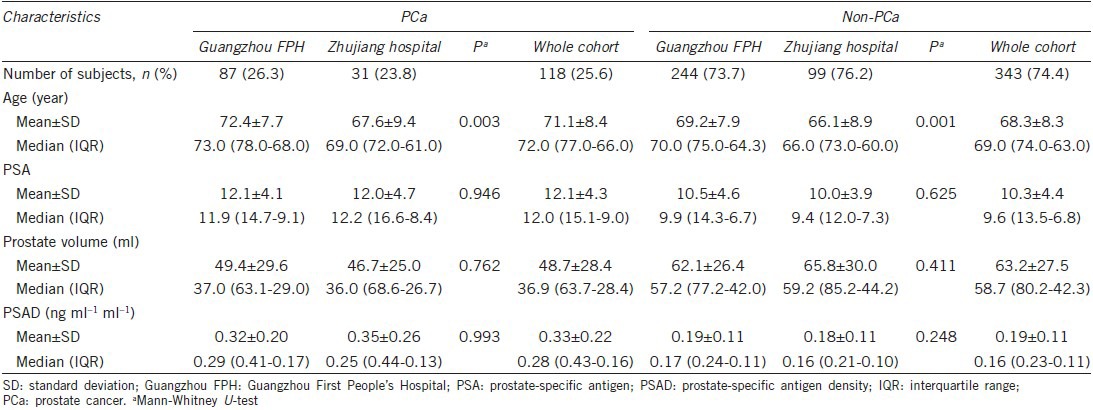
Table 2.
Prostate cancer detection rate by PSAD category
In men with a PSA of 2.5–10.0 ng ml−1, 10.1–20.0 ng ml−1, and 2.5–20.0 ng ml−1, the areas under the ROC curve (AUCs) for PSAD, when considered as a continuous variables, for predicting PCa were all higher than those for PSA for the Guangzhou FPH cohort, Zhujiang hospital cohort and whole cohort (Table 3, Figures 1 and 2).
Table 3.
The AUCs for PSA and PSAD in predicting risk of PCa, stratified by PSA
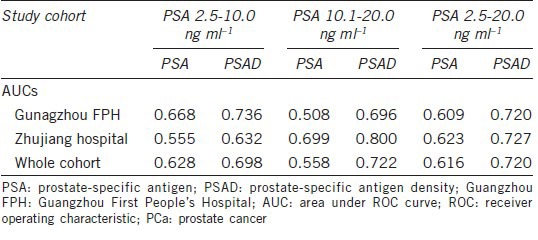
Figure 1.
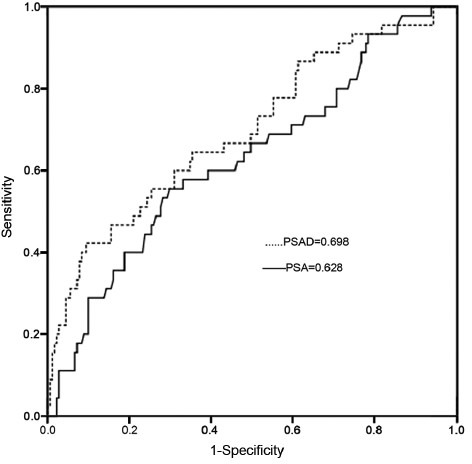
The areas under the receiver operating characteristic curve for prostate-specific antigen (PSA) and PSA density as continuous variables in predicting prostate cancer in men with a PSA of 2.5–10.0 ng ml−1.
Figure 2.
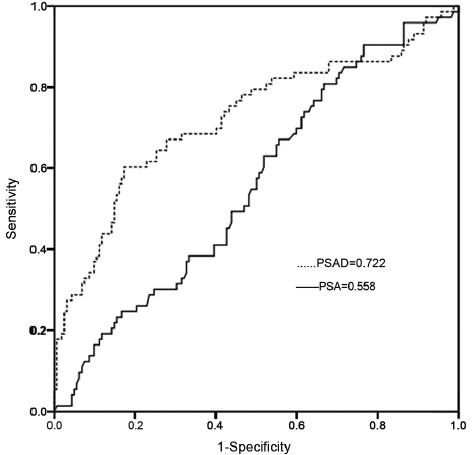
The areas under the receiver operating characteristic curve for prostate-specific antigen (PSA) and PSA density as continuous variables for predicting prostate cancer in men with a PSA of 10.1.20.0 ng ml−1.
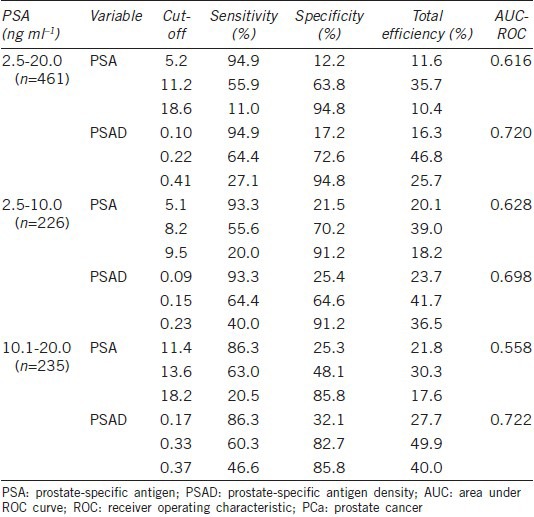
When considering all 461 men, 118 (25.6%) were diagnosed PCa. When broken down by PSA level, 45 (19.9%) of the 226 men with a PSA of 2.5–10.0 ng ml−1 and 73 (31.1%) of the 235 men with a PSA of 10.1–20.0 ng ml−1 were diagnosed with PCa, respectively (P = 0.006). For the whole cohort, the AUCs for PSA and PSAD for predicting PCa in men with a PSA of 2.5–10.0 ng ml−1 were 0.628 and 0.698, respectively. When the optimal PSA cut-off of 8.2 ng ml−1 was determined, an efficiency of 39.0% found, with corresponding sensitivity and specificity 55.6% and 70.2%, respectively. For the optimal PSAD cut-off of 0.15 ng ml−1 ml−1, the efficiency was 41.7% with a corresponding sensitivity and specificity of 64.4% and 64.6%, respectively. The AUCs for PSA and PSAD for predicting PCa in men with a PSA of 10.1–20.0 ng ml−1 were 0.558 and 0.722, respectively. For men with a PSA in this range, optimal PSA cut-off of 13.6 ng ml−1 was found, yielding a total efficiency of 30.3% with a corresponding sensitivity and specificity of 63.0% and 48.1%, respectively. An optimum PSAD cut-off of 0.33 ng ml−1 ml−1 was determined, with an efficiency of 49.9% and a corresponding sensitivity and specificity of 60.3% and 82.7%, respectively. The AUCs for PSA and PSAD for predicting PCa in men with a PSA of 2.5–20.0 ng ml−1 were 0.616 and 0.720, respectively. When an optimal PSA cut-off of 11.2 ng ml−1 was chosen, the total efficiency was 35.7%, with a corresponding sensitivity and specificity of 55.9% and 63.8%, respectively. For the ideal PSAD cut-off of 0.22 ng ml−1 ml−1, the total efficiency was 46.8%, with a corresponding sensitivity and specificity were 64.4% and 72.6%, respectively.
Had a PSA of 11.2 ng ml−1 been chosen as the biopsy cut-off, only 55.9% (66/118) of the men with PCa would have been diagnosed, with a positive biopsy rate of 34.7% (66/190). However, if a PSAD of 0.22 ng ml−1 ml−1 had been chosen as the biopsy cut-off, 64.4% (76/118) of the men with PCa would have been diagnosed, with a positive biopsy rate of 44.7% (76/170), saving at least 20 men from an unnecessary prostate biopsy (Table 4, Figures 1 and 2).
Table 4.
Sensitivity, specificity, and total efficiency of PSA and PSAD cut-offs for diagnosis of PCa, stratified by PSA level
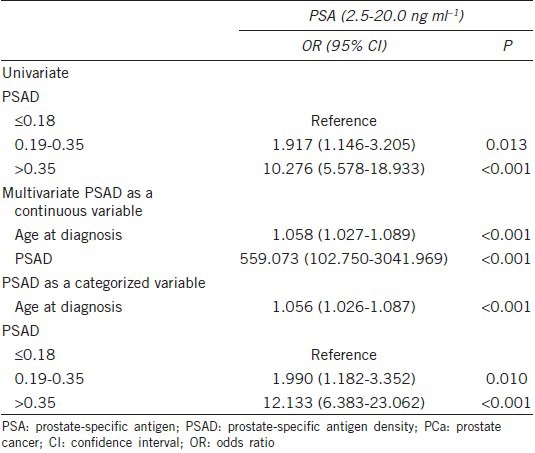
On univariate analysis, the risk of PCa was associated with PSAD. On multivariate analysis, PSAD (as either a continuous or categorical variable) was found to be an independent predictor of PCa. Men with a PSAD of > 0.35 ng ml−1 ml−1 were found to be at a increased risk of having PCa with an odds ratios of 12.133 when compared to those with a PSAD of ≤ 0.18 ng ml−1 ml−1 (P < 0.001) (Table 5).
Table 5.
Univariate and multivariate analysis of variables at the time of prostate biopsy for predicting PCa in Chinese man with a PSA of 2.5-20.0 ng ml−1
DISCUSSION
To our knowledge, the present study is the first to evaluate the effectiveness of PSAD for diagnosing PCa for men with a PSA in either the traditional Western PSA “gray zone” (2.5–10.0 ng ml−1) or the Chinese PSA “gray zone” (10.1–20.0 ng ml−1) using Chinese multicenter data. We found that for men both a PSA of 2.5–10.0 ng ml−1 and 10.1–20.0 ng ml−1, PSAD could improve the specificity of PSA in the diagnosis of PCa.
For men with a PSA in the traditional Western “gray zone” (2.5–10.0 ng ml−1), it is widely accepted that the PSAD may improve the diagnostic efficiency of detecting PCa.5,9,10,11,12,13,14,15 Zheng et al.16 analyzed a Chinese cohort of 44 patients with PCa and 193 with benign prostatic hyperplasia, all with a PSA of 4–10 ng ml−1. They showed that the sensitivity and specificity of PSAD at a cut-off of 0.134 ng ml−1 ml−1 were 90% and 33.7%, respectively. They concluded that PSAD was significantly better than percent free/total PSA (f/t PSA) and PSA for diagnosis PCa in men with a PSA of 4–10 ng ml−1.
In the present study, the specificities of PSAD in diagnosing of PCa were all higher than those of PSA. For instance, when employing a PSAD threshold of 0.17 ng ml−1 ml−1, PSAD had a sensitivity of 86.3% and a specificity of 32.1% for detecting PCa. When using a PSA threshold of 11.4 ng ml−1, the same sensitivity was found but the specificity was only 21.8%. For PSA values in between 2.5 and 20.0 ng ml−1, 2.5–10.0 ng ml−1 and 10.1–20.0 ng ml−1, we found the optimal total efficiencies of PSAD were all higher than those of the corresponding optimum PSA values (46.8% vs 35.7%, 41.7% vs 39.0%, and 49.9% vs 30.3%, respectively). Our results demonstrate that the utilization of PSAD could improve PCa detection rates for men with a PSA in the traditional PSA “gray zone” (PSA 2.5–10.0 ng ml−1) and agree with previous studies.5,9,10,13,14,15 The AUCs in men with a PSA of 2.5–10.0 ng ml−1 group for PSAD for predicting PCa was 0.698. It improved the AUCs of 0.070 for PSA (0.628), which was comparable to another Chinese study (AUCs are 0.678 and 0.717 for PSA and PSAD).16 However, the improvement of AUCs was lower as compared to the report in the literature from Western population.17 This discrepancy further indicates that Chinese men have a special characteristics when evaluate PCa risk.
A systematic review revealed that Asian men (primarily Japanese and Korean men) with PSAs of 2.0–10.0 ng ml−1 have lower rates of PCa than men with a similar PSA from Western countries.18 Furthermore, we recently reported that the PCa rate in Chinese men with a PSA of 4.0–10.0 ng ml−1 was 20.5%, much lower than the rates reported for Western men.19 For this reason, it is reasonable that the PSA “gray zone” in Chinese men is higher than the traditional PSA “gray zone.” We then further evaluated the effectiveness of PSAD in diagnosis PCa for a PSA of 10.1–20.0 ng ml−1. As expected, we found PSAD can improve the detection rate of PCa for a PSA higher than the traditional PSA “gray zone.” Currently, the Chinese Urological Association recommends that men with a PSA > 10 ng ml−1 undergo a prostate biopsy.7 Based on this recommendation, if a man with a PSA > 10 ng ml−1, clinicians may neglect other variables, such as f/t PSA, PSAD and PSA velocity. However, we recently reported that Chinese men with a PSA of 10–20 ng ml−1 with a large PV may also have a very low probability of harboring PCa.8 Thus, evaluating the effectiveness of PSAD in Chinese men with a PSA of 10.1–20.0 ng ml−1 is particularly pertinent. Our findings may also be used to improve PCa detection rates in patients with a PSA of 10–20 ng ml−1 in countries with lower incidences of PCa, reducing unnecessary prostate biopsies.
The present study is limited as it is retrospective in nature. All the data in our study were obtained from two large, tertiary medical centers. The strategies used in diagnosing PCa may differ between centers, despite being in the same geographical area. Furthermore, the time span over which data was collected was relative long such that some assays and methods used at the two centers may have changed. This may induce inherent bias. However, the two Chinese centers from which data was retrieved did not significantly alter their criteria for biopsy over that time frame, which could produce a more robust result. Finally, this study was not population-based and as such it is possible that our results overestimate the rate of PCa.
CONCLUSION
Prostate-specific antigen was not the ideal predictor of PCa for men with a PSA of 2.5–10.0 ng ml−1 or 10.1–20.0 ng ml−1. Using PSAD may improve the efficiency of PSA in diagnosing PCa and decrease unnecessary prostatic biopsies in Chinese men with a PSA of 2.5–20.0 ng ml−1.
AUTHOR CONTRIBUTIONS
PT and KJX conceived and designed the study. YRL, XHW, PFD, HQX, XTL and SFW collected the data. XHW and YRL performed statistical analyses. YRL, XHW, MU, and PT wrote the manuscript with input from all co-authors. All authors read and approved the final manuscript.
COMPETING INTERESTS
All authors declare no competing interests.
ACKNOWLEDGMENTS
This work was supported by the National Natural Science Foundation of China (No. 81072091/H1619) and a Key Project of Guangzhou Municipal Health Bureau Grant, China (No. 20121A021006) to Ping Tang.
REFERENCES
- 1.Siegel R, Ma J, Zou Z, Jemal A. Cancer statistics, 2014. CA Cancer J Clin. 2014;64:9–29. doi: 10.3322/caac.21208. [DOI] [PubMed] [Google Scholar]
- 2.Matsuda T, Saika K. Comparison of time trends in prostate cancer incidence (1973-2002) in Asia, from cancer incidence in five continents, Vols IV-IX. Jpn J Clin Oncol. 2009;39:468–9. doi: 10.1093/jjco/hyp077. [DOI] [PubMed] [Google Scholar]
- 3.Yoshida K, Honda M, Sumi S, Arai K, Suzuki S, et al. Levels of free prostate-specific antigen (PSA) can be selectively measured by heat treatment of serum: free/total-PSA ratios improve detection of prostate carcinoma. Clin Chim Acta. 1999;280:195–203. doi: 10.1016/s0009-8981(98)00189-2. [DOI] [PubMed] [Google Scholar]
- 4.Benson MC, Whang IS, Pantuck A, Ring K, Kaplan SA, et al. Prostate specific antigen density: a means of distinguishing benign prostatic hypertrophy and prostate cancer. J Urol. 1992;147:815–6. doi: 10.1016/s0022-5347(17)37393-7. [DOI] [PubMed] [Google Scholar]
- 5.Benson MC, Whang IS, Olsson CA, McMahon DJ, Cooner WH. The use of prostate specific antigen density to enhance the predictive value of intermediate levels of serum prostate specific antigen. J Urol. 1992;147:817–21. doi: 10.1016/s0022-5347(17)37394-9. [DOI] [PubMed] [Google Scholar]
- 6.Li M, Na YQ. The detection rate of prostate cancer in different prostate-specific antigen (PSA) levels in Chinese men. Zhonghua Yi Xue Za Zhi. 2008;88:16–8. Article in Chinese. [PubMed] [Google Scholar]
- 7.Na Y, Ye Z, Sun Y, Sun G. Beijing: People's Medical Publishing House; 2014. Chinese Guidelines for the Diagnosis and Treatment of Urological Diseases; p. 63. [Google Scholar]
- 8.Tang P, Jin XL, Uhlman M, Lin YR, Deng XR, et al. Prostate volume as an independent predictor of prostate cancer in men with PSA of 10-50 ng ml−1. Asian J Androl. 2013;15:409–12. doi: 10.1038/aja.2013.11. [DOI] [PMC free article] [PubMed] [Google Scholar]
- 9.Catalona WJ, Southwick PC, Slawin KM, Partin AW, Brawer MK, et al. Comparison of percent free PSA, PSA density, and age-specific PSA cutoffs for prostate cancer detection and staging. Urology. 2000;56:255–60. doi: 10.1016/s0090-4295(00)00637-3. [DOI] [PubMed] [Google Scholar]
- 10.Djavan B, Remzi M, Zlotta AR, Ravery V, Hammerer P, et al. Complexed prostate-specific antigen, complexed prostate-specific antigen density of total and transition zone, complexed/total prostate-specific antigen ratio, free-to-total prostate-specific antigen ratio, density of total and transition zone prostate-specific antigen: results of the prospective multicenter European trial. Urology. 2002;60:4–9. doi: 10.1016/s0090-4295(02)01896-4. [DOI] [PubMed] [Google Scholar]
- 11.Sözen S, Eskicorapci S, Küpeli B, Irkilata L, Altinel M, et al. Complexed prostate specific antigen density is better than the other PSA derivatives for detection of prostate cancer in men with total PSA between 2.5 and 20 ng/ml: results of a prospective multicenter study. Eur Urol. 2005;47:302–7. doi: 10.1016/j.eururo.2004.10.009. [DOI] [PubMed] [Google Scholar]
- 12.Aslan G, Irer B, Kefi A, Celebi I, Yörükoglu K, et al. The value of PSA, free-to-total PSA ratio and PSA density in the prediction of pathologic stage for clinically localized prostate cancer. Int Urol Nephrol. 2005;37:511–4. doi: 10.1007/s11255-005-0921-x. [DOI] [PubMed] [Google Scholar]
- 13.Kefi A, Irer B, Ozdemir I, Tuna B, Goktay Y, et al. Predictive value of the international prostate symptom score for positive prostate needle biopsy in the low-intermediate prostate-specific antigen range. Urol Int. 2005;75:222–6. doi: 10.1159/000087798. [DOI] [PubMed] [Google Scholar]
- 14.Lodeta B, Benko G, Car S, Filipan Z, Stajcar D, et al. Prostate specific antigen density can help avoid unnecessary prostate biopsies at prostate specific antigen range of 4-10 ng/ml. Acta Clin Croat. 2009;48:153–5. [PubMed] [Google Scholar]
- 15.Froehner M, Buck LM, Koch R, Hakenberg OW, Wirth MP. Derivatives of prostate-specific antigen as predictors of incidental prostate cancer. BJU Int. 2009;104:25–8. doi: 10.1111/j.1464-410X.2009.08349.x. [DOI] [PubMed] [Google Scholar]
- 16.Zheng XY, Xie LP, Wang YY, Ding W, Yang K, et al. The use of prostate specific antigen (PSA) density in detecting prostate cancer in Chinese men with PSA levels of 4-10 ng/ml. J Cancer Res Clin Oncol. 2008;134:1207–10. doi: 10.1007/s00432-008-0400-8. [DOI] [PubMed] [Google Scholar]
- 17.Lam JS, Cheung YK, Benson MC, Goluboff ET. Comparison of the predictive accuracy of serum prostate specific antigen levels and prostate specific antigen density in the detection of prostate cancer in Hispanic-American and white men. J Urol. 2003;170:451–6. doi: 10.1097/01.ju.0000074707.49775.46. [DOI] [PubMed] [Google Scholar]
- 18.Roddam AW, Duffy MJ, Hamdy FC, Ward AM, Patnick J, et al. Use of prostate-specific antigen (PSA) isoforms for the detection of prostate cancer in men with a PSA level of 2-10 ng/ml: systematic review and meta-analysis. Eur Urol. 2005;48:386–99. doi: 10.1016/j.eururo.2005.04.015. [DOI] [PubMed] [Google Scholar]
- 19.Tang P, Du W, Xie K, Deng X, Fu J, et al. Transition zone PSA density improves the prostate cancer detection rate both in PSA 4.0-10.0 and 10.1-20.0 ng/ml in Chinese men. Urol Oncol. 2013;31:744–8. doi: 10.1016/j.urolonc.2011.06.012. [DOI] [PubMed] [Google Scholar]


