Abstract
We present an extension of the all-atom internal-coordinate force field, ICMFF, that allows for simulation of heterogeneous systems including hexopyranose saccharides and glycan chains in addition to proteins. A library of standard glycan geometries containing α- and β-anomers of the most common hexapyranoses, i.e., d-galactose, d-glucose, d-mannose, d-xylose, l-fucose, N-acetylglucosamine, N-acetylgalactosamine, sialic, and glucuronic acids, is created based on the analysis of the saccharide structures reported in the Cambridge Structural Database. The new force field parameters include molecular electrostatic potential-derived partial atomic charges and the torsional parameters derived from quantum mechanical data for a collection of minimal molecular fragments and related molecules. The ϕ/ψ torsional parameters for different types of glycosidic linkages are developed using model compounds containing the key atoms in the full carbohydrates, i.e., glycosidic-linked tetrahydropyran–cyclohexane dimers. Target data for parameter optimization include two-dimensional energy surfaces corresponding to the ϕ/ψ glycosidic dihedral angles in the disaccharide analogues, as determined by quantum mechanical MP2/6-31G** single-point energies on HF/6-31G** optimized structures. To achieve better agreement with the observed geometries of glycosidic linkages, the bond angles at the O-linkage atoms are added to the internal variable set and the corresponding bond bending energy term is parametrized using quantum mechanical data. The resulting force field is validated on glycan chains of 1–12 residues from a set of high-resolution X-ray glycoprotein structures based on heavy atom root-mean-square deviations of the lowest-energy glycan conformations generated by the biased probability Monte Carlo (BPMC) molecular mechanics simulations from the native structures. The appropriate BPMC distributions for monosaccharide–monosaccharide and protein–glycan linkages are derived from the extensive analysis of conformational properties of glycoprotein structures reported in the Protein Data Bank. Use of the BPMC search leads to significant improvements in sampling efficiency for glycan simulations. Moreover, good agreement with the X-ray glycoprotein structures is achieved for all glycan chain lengths. Thus, average/median RMSDs are 0.81/0.68 Å for one-residue glycans and 1.32/1.47 Å for three-residue glycans. RMSD from the native structure for the lowest-energy conformation of the 12-residue glycan chain (PDB ID 3og2) is 1.53 Å. Additionally, results obtained for free short oligosaccharides using the new force field are in line with the available experimental data, i.e., the most populated conformations in solution are predicted to be the lowest energy ones. The newly developed parameters allow for the accurate modeling of linear and branched hexopyranose glycosides in heterogeneous systems.
I. Introduction
Carbohydrates have been a topic of active theoretical and experimental research for their important roles in biology and chemistry. Carbohydrates are involved in numerous biological functions in humans, such as recognition in axonal growth,1 blood anticoagulation,2 cell–cell recognition,3 antibody–antigen interactions,4,5 structure factors in extracellular matrices,6 and post- or cotranslational modifications of polypeptides.7 Correct glycosylation patterns are essential for normal cell and organism function.8,9 In plants, carbohydrate polymers, cellulose and starch, provide structure and energy storage.10 Interest in carbohydrates has also increased significantly in the past few years because of their potential applications as biofuels.
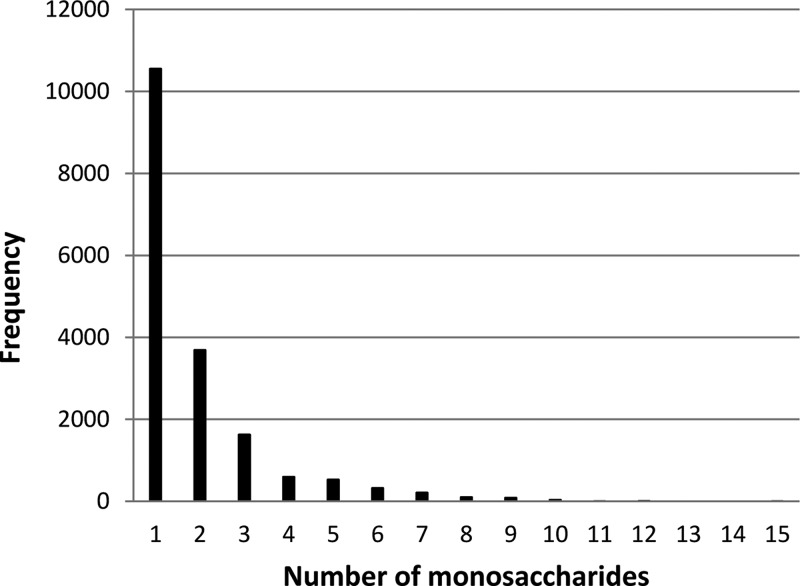
It is, therefore, essential that the structural, dynamic, and thermodynamic properties of carbohydrate molecules are accurately determined. Ideally, a three-dimensional structure of a glycoprotein together with its glycans would be resolved by experimental methods such as X-ray crystallography or NMR spectroscopy. However, a brief survey of the glycoprotein structures in the Protein Data Bank11 (PDB) reveals that the glycan moieties are virtually never preserved in their entirety in crystal structures. Instead of the physiologically typical ∼9 sugar residues at N-glycosylation sites, only 1 to 2 monosaccharide moieties are commonly seen (Figure 1). The reasons for this are manifold: crystallographers often enzymatically truncate larger glycans or completely eliminate glycosylation sites via mutations to improve crystallization properties; even when they are biochemically intact, large portions of glycan moieties are often not traceable in the electron density maps due to disorder, heterogeneity, or the presence of multiple conformers.
Figure 1.
Distribution of numbers of observed monosaccharide moieties at the N-glycosylation sites in PDB X-ray structures. Data was generated by querying PDB using the ICM program.
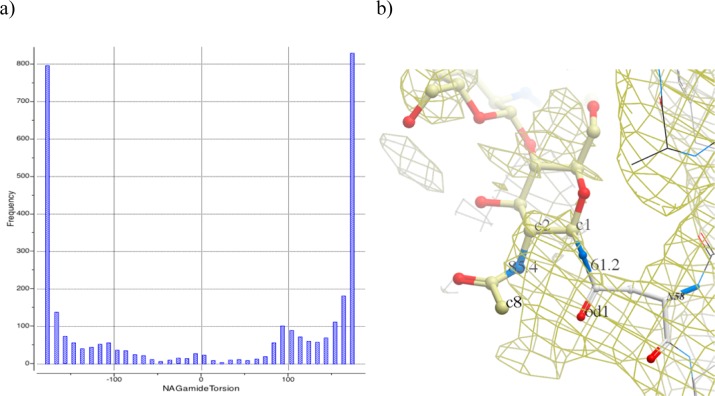
Furthermore, analysis of glycoprotein structures in PDB shows that the reported conformations of the glycans frequently appear highly strained. For example, simple statistics of the amidic torsion angle in N-acetyl glucosamine, one of the most common glycosylating moieties, shows that as many as 33% deviate at least 30° or more from the expected planar trans configuration (Figure 2a), resulting in highly strained conformations. A similar situation is observed for the geometry of the asparagine–glycan amide linkage (Figure 2b), and sugar rings themselves are also often far from their optimal conformers: boat conformations are often seen. It is not unusual to encounter incorrect stereoisomers.
Figure 2.
(a) Distribution of the amide angle of N-acetyl glucosamine in PDB structures. Peaks at ±180° correspond to the expected flat configuration. (b) Example of poor geometry: N-acetylglucosamine at N58 in PDB 1OW0; internal amide bond has a torsion angle at 85°, and the amino acid/sugar amide bond is twisted out of plane by 61°; electron density contouring (brown mesh) reveals that experimental data does not seem to warrant assignment of such a strained conformer.
These strained or otherwise incorrect conformations are very likely artifacts of the X-ray structure refinement procedure and/or software: without well-validated residue library entries for sugar moieties, researchers sometimes borrow geometries from older structures, themselves erroneous; nonstandard force-field parameters are also frequently improperly assigned. Structure quality control is routinely applied to the polypeptide portions of the crystal structure, detecting excessive deviations from the idealized covalent geometry and other problems such as incorrect stereochemistry. Heteroatom groups, including sugars, are much less scrutinized. Efforts to rerefine the small molecule ligands are under way.12 For glycans, similar work maybe necessary to bring the quality of their reconstruction to the level typical for that of the polypeptidic portions of the X-ray structure.13
Independently of the experimental structure accuracy issues, for many if not most systems, a single conformation may not provide an adequate account of the behavior of glycans under physiologically relevant conditions. More likely, the realistic picture should be an ensemble of conformations where some parts of the glycan moiety stay relatively static14−16 due to steric constraints and other stabilizing interactions, whereas other parts will be mobile14 and transiently occupy multiple locations. Because experimental methods of structure resolution alone appear to be insufficient to provide such a static-dynamic picture, computer simulations may be a necessary complementary approach to improve our understanding of structure and function of glycans.
Success of the computational modeling methods is fundamentally determined by two factors: the accuracy of the energy approximation (force field) and the sampling power of the conformational search method. A number of force fields and parameter sets have been proposed for carbohydrates.17−28 A comprehensive review of the existing carbohydrate force fields was published recently.29 A number of carbohydrate force fields were developed for treating poly- and oligosaccharides only and are not fully compatible with existing protein force fields. Some biomolecular force fields, including AMBER, CHARMM, and GROMOS, contain parameters for carbohydrates that are compatible with the latest protein parameters, although fewer contain parameters for glycoproteins or glycolipids. More recent force fields were created by expanding a protein force field by additional atom types and corresponding parameters, making them suitable for simulations of heterogeneous systems, such as glycoproteins. Evaluation of the performance of several carbohydrate force fields against QM30,31 and experimental solution data32,33 showed that no single parameter set consistently out performed the others. Insufficiently high accuracy of the existing force fields is partially due to the fact that the functional form or parameters (such as scaling factors for 1–4 van der Waals and nonbonded interactions) that work well for the original systems of interest (for example, proteins) appeared to be unsuitable for modeling carbohydrates.34 Thus, in a study of the ω angle rotation (O5–C5–C6–O6, Figure 3) in monosaccharides,34 it was observed that O6 may interact with either O4 (1–5 interaction) or O5 (1–4 interaction), and the use of 1–4 scaling unbalanced these interactions, leading to an inability to correctly predict rotamer populations.
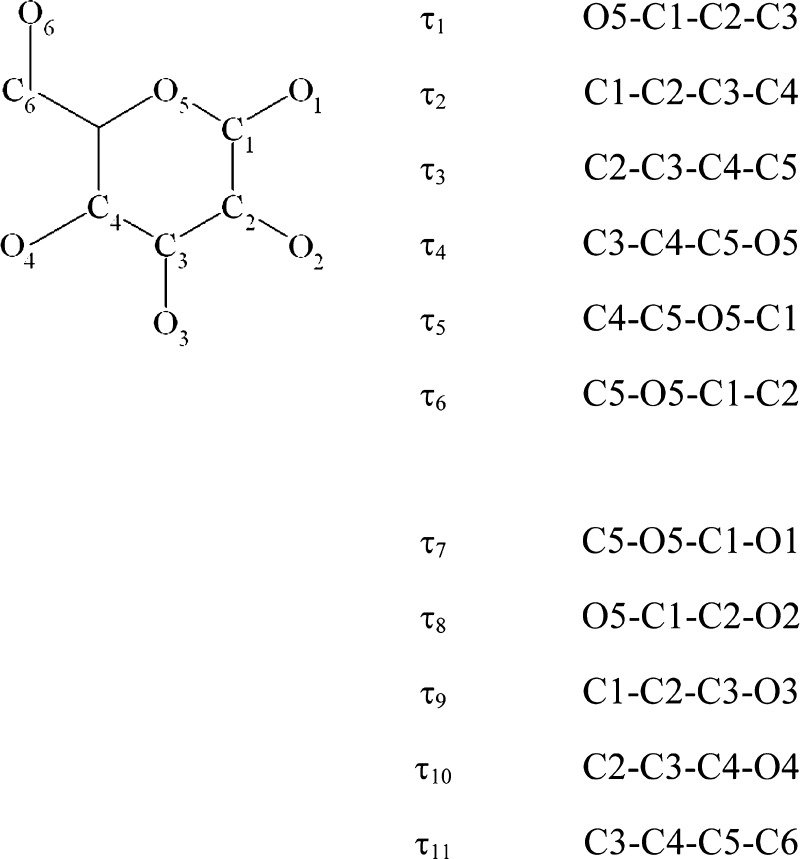
Figure 3.
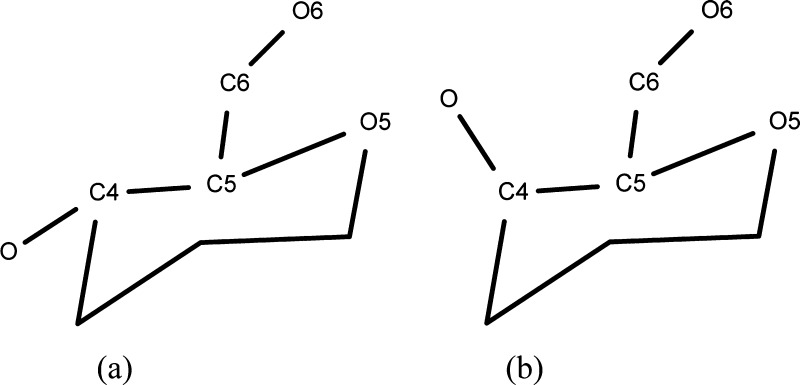
Atom notation and torsional definitions for the hexopyranose fragment.
Inconsistencies in force field development put serious limitations on the applicability of these force fields to many biological problems, which, as in the case of glycans, involve modeling heterogeneous systems including both carbohydrates and proteins and therefore require an accurate force field applicable to different classes of molecules. An effort to develop such consistent parametrizations has been made in the recent versions of the GLYCAM0618 and CHARMM27 force fields. Although the results obtained during the development and evaluation of these force fields look promising, tests carried out for larger and more complex systems may be necessary to evaluate their accuracy adequately.
While recent parametrizations of the carbohydrate force fields may offer improved accuracy, they rely on Cartesian (i.e., XYZ coordinate) representation. Given the large size of conformational space and the complexity of the energy landscapes, extensive sampling and global energy optimization using all-atom Cartesian force fields becomes prohibitive for many biomolecular systems. One way to reduce the conformational space is to use a rigid covalent geometry approximation, i.e., torsional angle representation. The advantage of this approach is not only in the smaller (∼10-fold) dimensionality of the sampling space and faster energy evaluation at each step but also in more efficient local minimization, which has much larger radii of convergence than Cartesian space local minimizations.35 The torsional modeling approach should be particularly beneficial in simulations of glycans because, while they can be highly flexible, their movements are almost exclusively around bonds in glycosidic linkages, whereas pyranose rings often can be considered rigid.
The torsional angle representation was originally introduced in the ECEPP algorithm (empirical conformational energy program for peptides)36 used for conformational energy computations of peptides and proteins.37−40 A new protein internal coordinate mechanics (ICM) force field designed specifically for torsional angle representation was reported recently.41 It was developed using high-level ab initio calculations combined with experimental data for crystals of organic molecules. The main features of ICMFF include more accurate description of hydrogen-bond interactions, improved backbone covalent geometry and energetics achieved using novel backbone torsional potentials, and inclusion of the bond angles at the Cα atoms into the internal variable set. Loop modeling simulations carried out for 4–13 residue loops demonstrated the high accuracy of the new ICM force field41 and indicate that ICMFF represents a promising starting point for development of an accurate and consistent force field for simulations of glycoproteins and protein–carbohydrate complexes.
Computational studies of biomolecular systems are not possible without a highly efficient conformation search method. We have previously proposed and validated a method (biased probability Monte Carlo, BPMC42) to dramatically enhance efficiency of the Monte Carlo (MC) optimization procedure in peptide simulations by preferentially sampling the regions of conformational space that are known to be low-energy or well-populated. By performing MC random steps predominantly into these regions, BPMC avoids wasting computational cycles on sampling parts of the conformational space that are irrelevant in biological structures due to their exceedingly high energy. We demonstrated that much faster convergence of peptide folding simulations is achieved when BPMC rather than flatly distributed random steps are used.42 The approach was subsequently used in side chain optimization for homology modeling43,44 and small protein folding.45,46 Both the analysis of the experimental structures of glycoproteins47 and quantum mechanics (QM) calculations48 for glycosidic linkages show that the ϕ/ψ combinations observed for different types of linkages correspond to small sets (1–3) of well-defined low-energy regions. These conformational preferences of glycosidic linkages make them perfect candidates for applying the BPMC method.
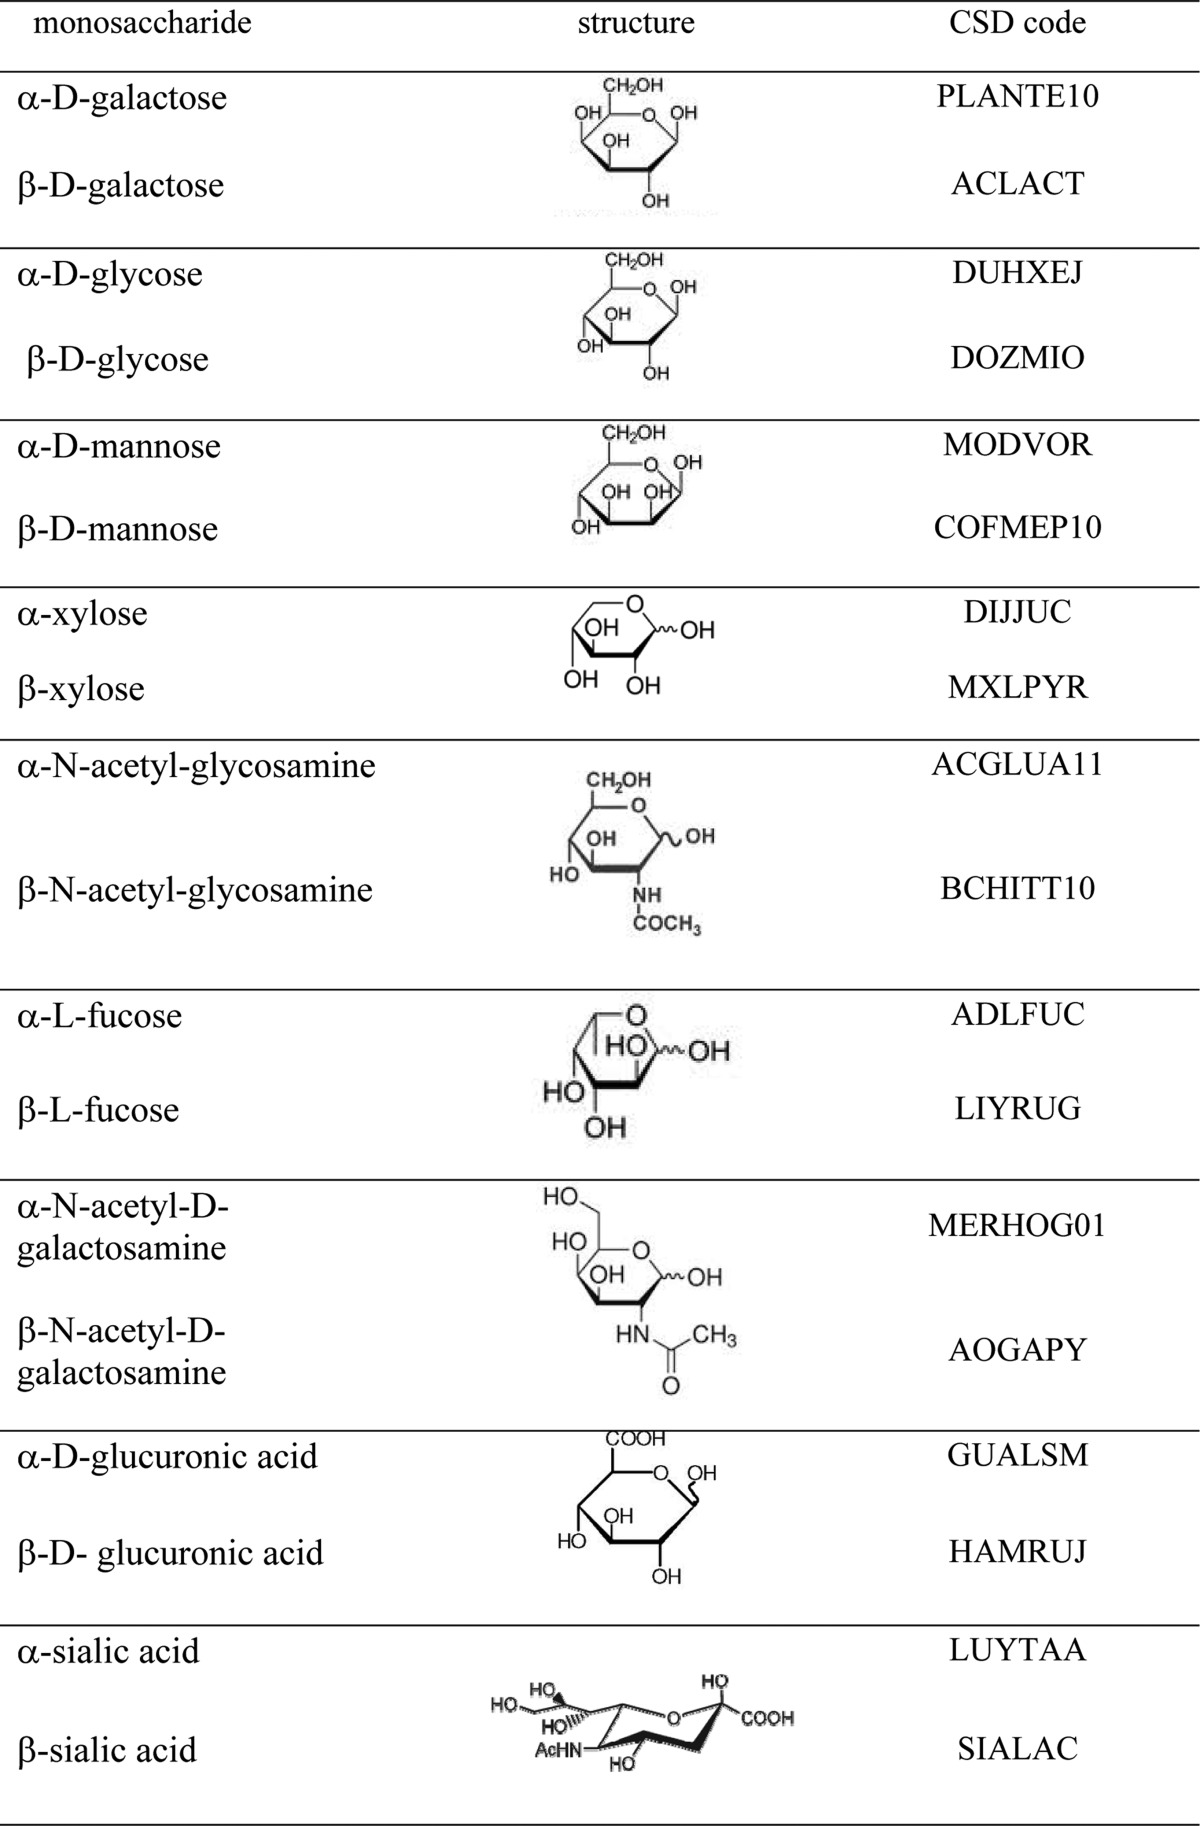
The main goal of this work is the development of a carbohydrate force field that is consistent with the existing ICM force field for proteins, thereby enabling the simulation of heterogeneous systems. Therefore, we use the same functional form and parametrization procedure as ICMFF.41 As a first step, we obtained, from the analysis of the experimental data from the Cambridge Structural Database (CSD), standard geometries for both α- and β-anomers of the nine most common hexopyranose monosaccharides (Table 1) and computed corresponding atomic partial charges. Torsional parameters were derived using QM calculations for small molecule model compounds corresponding to fragments of the hexopyranose monosaccharides and to disaccharide linkages. Next, biased probability zones were defined for different disaccharides using glycoprotein experimental data available from PDB. The validation step at the end of the parameter development process consisted of BPMC conformational search carried out for (a) short oligosaccharides in solution and (b) 1–12-residue glycan chains from a set of high-resolution X-ray glycoprotein structures. This step ensured that the parameters are transferable from the model compounds to the glycan chains and are compatible with the rest of the force field.
Table 1. Monosaccharides Considered in This Work and the Corresponding MRF.
II. Computational Details
II.A. Form of the Potential
ICMFF is an internal coordinate force field, i.e., its intramolecular energy is a function of torsional degrees of freedom (with certain exceptions, see below). It employs the standard residue geometry.49 A detailed description of the ICM force field for proteins and its parametrization was published recently.50
The total energy of a molecule in ICMFF, Eintra, consists of nonbonded (van der Waals plus electrostatics), Eintranbe, torsional, Etor, and angle bending, Ebb, terms
| 1 |
The nonbonded term of the force field is calculated as a sum of the Buckingham potential and the Coulomb contribution
| 2 |
where rij is the distance between atoms i and j separated by at least three bonds; Aij, Bij, and Cij are van der Waals parameters; qi and qj are point charges (in e.u.) localized on atoms. The summation runs over all pairs of atoms i < j. k14 and k14el are scale factors for 1–4 van der Waals and electrostatic interactions, respectively. The dielectric constant ε = 2 was used. In simulations of glycoproteins, distance-dependent dielectric constant ε = 2rij was used to account for solvent screening of electrostatic interactions.
The following combination rules for the van der Waals parameters Aij, Bij and Cij were applied
| 3 |
The van der Waals and electrostatic interactions described by eq 1 are included for 1–4 or higher-order atom pairs. The 1–4 interactions are treated in a special way by introducing k14 and k14el scaling factors. k14 = 1 and k14 = 2 were chosen based on our studies41 of the terminally blocked alanine where nonscaled 1–4 repulsion resulted in an excessively high energy barrier at θ ∼ 0°.
Hydrogen-bonding interaction is represented by a combination of electrostatic and van der Waals terms (eq 1) with a separate set of parameters for heavy atom–hydrogen pairs.41
The glycan residues considered in this work contain atom types that are already present in ICMFF; therefore, no derivation of additional parameters was necessary. Hexopyranose oxygen is the only exception, but we assumed that van der Waals parameters of hydroxyl oxygen can be used to describe this atom type. Transferability of the van der Waals parameters to hexopyranoses was assessed by carrying out local energy minimizations for crystal structures of eight monosaccharides retrieved from CSD (see Results and Discussion).
II.B. Atomic Partial Charges
To obtain a set of atomic charges for hexose residues that is consistent with the existing ICM force field, we followed the methodology described in ref (41), i.e., partial atomic charges, qi (eq 2), were fitted41 to reproduce the molecular electrostatic potential, calculated with the Hartree–Fock wave function and the 6-31G* basis set using the GAMESS program.43
A small set of low-energy conformations differing in orientation of hexose side chains was generated for each standard hexose geometry. Electrostatic potentials were computed for all conformations from the set. Multiple-conformation fitting was carried out using the restrained electrostatic potential (resp) method44a implemented in the AMBER 6.0 program.44b Resulting partial atomic charges for the 18 hexose residues are reported in Table S1, Supporting Information. The resp method was also employed to obtain a single set of charges using several conformations for model molecules used for deriving torsional parameters (see below).
II.C. Torsional Potential
The torsional energy term for all dihedral angles’ θ’s is computed as follows
| 4 |
where θ is a torsional angle varying from 0 to 180°, kθi are the torsional parameters, and N ≤ 3.
II.D. QM and MM ϕ/ψ Maps for C–O–C Monosaccharide–Monosaccharide Linkages
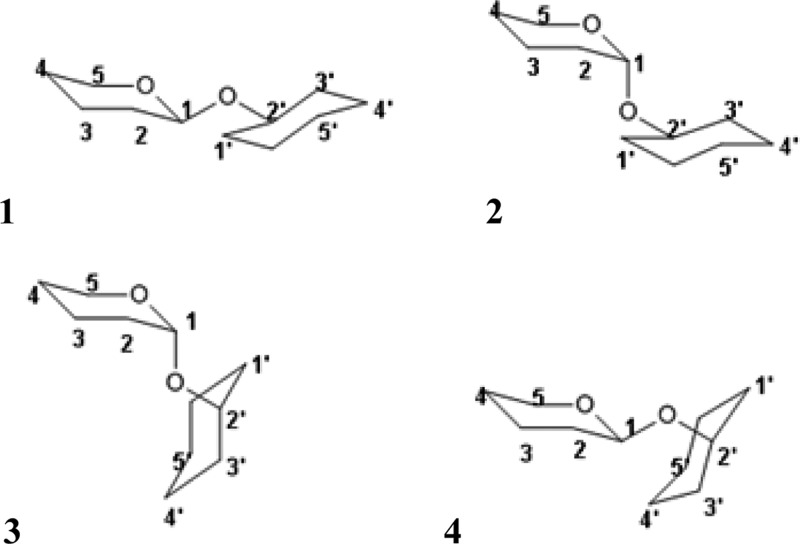
To derive torsional energy profile for the relative rotation of two hexopyranose units connected via O-linkage, entire QM ϕ/ψ maps were calculated for four model molecules (Figure 4), representing all possible enantiomers of the two chiral centers involved in the linkage.
Figure 4.
Model molecules used for deriving ϕ/ψ torsional parameters for O-linkage: (1) equatorial–equatorial (eq–eq), (2) axial–equatorial (ax–eq), (3) axial–axial (ax–ax), and (4) equatorial–axial (eq–ax) linkages.
All quantum mechanical calculations were carried out using the GAMESS software.50 The QM ϕ/ψ maps were computed in two steps. First, all conformations generated in two-dimensional ϕ/ψ space on a 15° grid were geometry-optimized at the Hartree–Fock level with the 6-31G** basis set and with the ϕ and ψ angles constrained. Next, single-point energy calculations were carried out for each of the optimized geometries using the more accurate MP2 method with the 6-31G** basis set and the polarizable continuum model (PCM) implemented in GAMESS. The PCM model was used to take into account the solvation free energy for consistency with our nonbonded energy calculations carried out with the effective dielectric constant ε = 2. Heptane was used as a solvent. The MP2/6-31G**//HF/6-31G** methods were used to generate target data to maintain consistency with the current ICMFF parametrization.
The resulting ϕ/ψ energy maps were compared to the corresponding maps obtained with the ICM force field. The MM energy maps were computed using standard ICM geometries and minimizing the energy of each conformation with the ϕ/ψ torsion angles constrained at the designated values.
II.E. Derivation of Parameters of the Torsional Potentials
Our derivation of the torsional potential energy terms relied on fitting the molecular mechanical (MM) energy profiles for rotation around a specific bond against the corresponding QM profiles. The torsional potential energy terms were obtained by fitting a cosine series (eq 4) to the difference between the QM and MM profiles (the latter consisting of nonbonded and electrostatic terms), i.e., by minimizing the following target function
| 5 |
with respect to the kθn coefficients of the Fourier expansion (eq 4). The summation runs over all N points of the ϕ/ψ map taken into consideration. ΔEi and ΔEiQM are the relative MM and QM energies, respectively, for a given point i; wi are empirical weights. The weights were computed according to the formula
| 6 |
where c and c1 are empirical parameters introduced to provide additional de-emphasis of high-energy regions. The value of c was chosen so as to give higher weights to those of the fitting points located at or near the energy minima.
Because this fitting method does not always produce acceptable results for ϕ/ψ maps,41 in this study it was combined with an alternative empirical approach described in detail in the Results and Discussion. It was designed to reproduce main features of the QM ϕ/ψ map (such as shape and relative stability of the low-energy regions) while focusing on the low-energy regions of the QM energy surface that are also the most populated areas of the ϕ/ψ map obtained from the analysis of the experimental glycoprotein structures.
To obtain a complete set of torsional parameters, including both the ϕ/ψ backbone and side chain torsional potentials, a number of model molecules (Table S2, Supporting Information) containing the same types of torsional angles as those present in the glycan side chains, such as hydroxyl groups, were used. The four atoms (defining each type of torsional angle) with their covalently bound neighbors replaced by hydrogen atoms defined the molecules selected for the calculations. More complex model molecules were used in cases where nontrivial influence of distant atoms was expected, i.e., for ϕ/ψ. Thus, the torsional terms were parametrized to reproduce the properties of the simplest molecules possible and then applied to larger and more complex ones.
The QM and MM profiles of the model molecules were calculated adiabatically, i.e. by constraining the appropriate torsions for each of the torsional angles on a 10° grid while minimizing the energy with respect to all other degrees of freedom. All of the ab initio calculations were carried out at the MP251,52 level of theory with a 6-31G** basis set implemented in the GAMESS program.53,54 The corresponding MM torsional profiles were computed using the ICM program. The molecular geometries (bond lengths and bond angles) were optimized by QM calculations, and the lowest-energy QM conformations were used for calculating the MM torsional profiles. Some functional groups, such as methyl group, can have higher symmetry than the geometries obtained from QM calculations on fixed rotamers of these groups; hence, the corresponding bond lengths and bond angles of these groups were averaged to conform to the highest symmetry possible for a particular group.
II.F. Flexibility of C–O–C Linkage
Analysis of CSD X-ray data for oligosaccharides showed that the C1–O–C angle in glycan–glycan O-linkage exhibits significant variation depending on values of ϕ and ψ angles (Figure 5). Therefore, following the methodology used in development of ICMFF for proteins, we introduced flexibility of the C1OC bond angle into our model. The angle bending term, Ebb, empolyed to account for conformation-dependent changes in ∠C1OC is computed as follows
| 7 |
where kijk is the angle bending force constant (in kcal/rad2) and θijk0 is a reference ∠C1OC in degrees.
Figure 5.
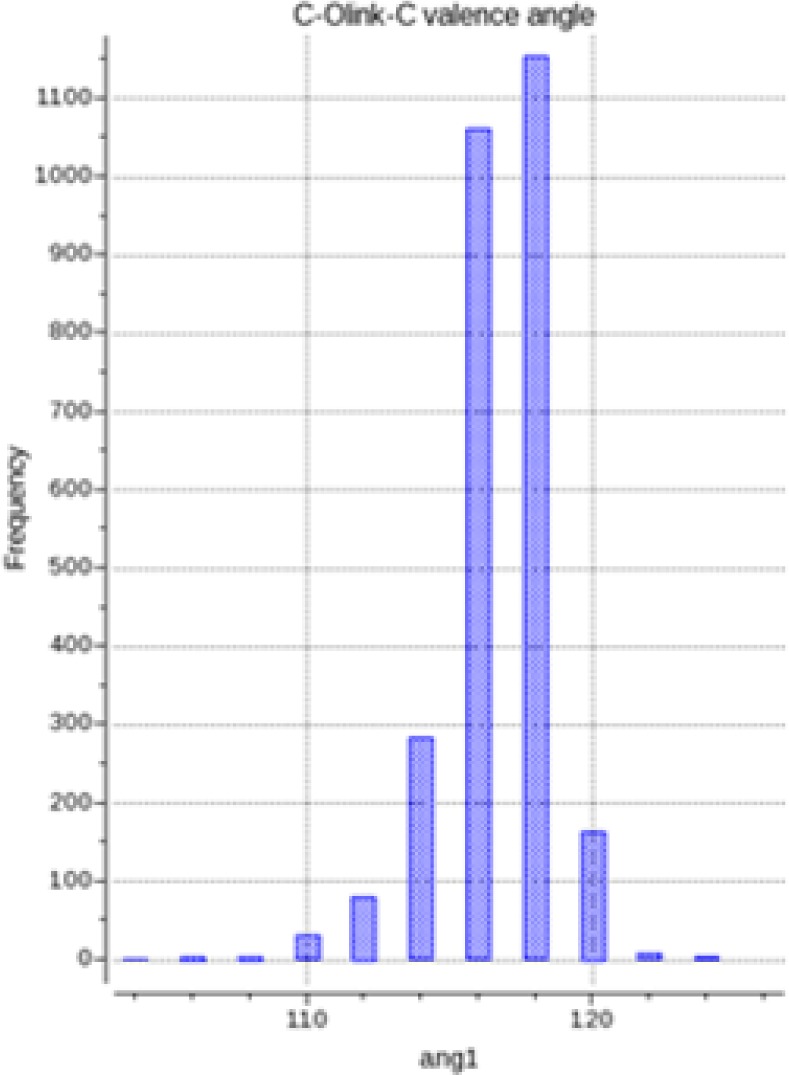
Distribution of C1–O–C valence angles (in degrees) in CSD saccharide structures with R < 10%.
Parameters of the harmonic potential (eq 7) describing angle bending were derived using the QM ϕ/ψ maps for the model molecules from Figure 4.
The force constant and reference angle of the angle bending term (eq 7) were obtained by minimizing RMSD between the QM and MM values of ∠C1OC (θ) for a set of conformations, i.e.,
| 8 |
where θiQM are the QM values of ∠C1OC taken from the conformations of the model molecules generated to compute QM ϕ/ψ energy maps. N is a number of structures. θi angles were calculated by minimizing MM energy of a given model molecule while keeping the ϕ and ψ angles fixed at the same values as those in the corresponding QM conformations.
Parameter optimization was carried out via a systematic search on the k0/θ0 grid. Grid points were obtained by scanning the 200–1000 kcal/rad2 range for k0 and 110–130° range for θ0 with step of 50 kcal/rad2 and 1° for the force constant and the reference angle, respectively. The final ∠C1OC bending parameters, k0 (in kcal/rad2) and θ0, are 800.0 and 121°, respectively. Resulting potential enabled us to reproduce accurately (RMSD < 2°) QM values of ∠C1OC (corresponding to low-energy conformations) in the model molecules.
II.G. Solvation Model
Simulations of glycoproteins were carried out with the solvation free energy, ΔGsolv, of each structure estimated by using a solvent-accessible surface area (SA) model
| 9 |
where Ai represents the solvent-accessible SAs of various atom types calculated as described in ref (55) and σi is the solvation parameter for each type.
Solvation parameters employed in the current work were optimized41 using conformational ensembles for 58 loops of nine residues and subsequently tested in simulation of protein loops of different lengths. The ICM energy function supplemented by the solvation energy term with these parameters was shown41 to discriminate near-native loop conformations from a large set of decoy structures.
II.H. Standard Monosaccharide Geometry
The following most common hexopyranose residues (Table 1) were considered in the work: d-galactose, d-glucose, d-mannose, d-xylose, l-fucose, d-GlcNac (N-acetylglucosamine), d-GalNac (N-acetylgalactosamine), and sialic (NANA) and glucuronic acids. Standard geometries were obtained for the glycans with the energetically more favorable 4C1 conformation of the pyran ring and for both the α- and β-anomers.
To derive representative orthogonal coordinates for each hexopyranose residue, we followed the methodology described in detail in refs (56 and 57). Thus, a Cambride Structural Database (CSD)58 search was carried out to find crystal structures containing the hexopyranose fragments listed in Table 1. The 2011 release of CSD and the graphical search program QUEST were used for search and data retrieval. We applied the same search criteria as those described by Allen and Fortier56 except that the lower R factor of 10% was adopted because a large amount of accurate experimental data has been added to CSD over the past 20 years. Each hexopyranose conformation was described by the 11 torsion angles (descriptors, see Figure 3): six intra-annular torsional angles and up to five torsional angles defining axial or equatorial disposition of ring substituents with respect to the ring (for example, C5–O5–C1–O1). Geometries of all hexopyranose fragments retrieved from CSD were clustered using these descriptors, and the average values of each descriptor were computed for each cluster. The set of 11 average τ values for each cluster defines a cluster centroid. Deviations of τ angles of each structure of a cluster from the corresponding centroid values were calculated, and the most representative fragment (MRF) was defined for each cluster as the fragment of the data set that is closest to the cluster centroid.57 Table 1 lists the CSD reference codes of the crystal structures containing MRF for each of the 18 monosaccharides.
II.I. Biased Probability Monte Carlo Procedure
Having an efficient search method along with an accurate force field represent two crucial parts of the prediction of any structure. The Monte Carlo method implemented in the ICM program employs the so-called biased probability zones to cover the conformational space of a protein more efficiently. The idea of the BPMC method is to sample with larger probability those regions of the conformational space that are known to be highly populated.
Local probability distributions of a small number of correlated variables can be deduced from the statistical analysis of the available experimental data or evaluated based on their energy. Thus, all ϕ and ψ angles of a glycan chain are divided into (Nresidues – 1) pairs, and a random Monte Carlo move is made by selecting a residues and a change of both angles by some values. In the current implementation of the BPMC procedure, we describe the probability distribution by a set of Gaussian distributions. The random move consists of the following steps: (1) randomly select an internal variable, (2) identify all high-probability zones associated with the variable, (3) select one zone according to the probability P, and (4) make a normally distributed step in the vicinity of kth zone, i.e., the displacement from the center of the zone by a random vector having components distributed with the probability density ρ
| 10 |
Local conformational preferences of glycosidic linkages between monosaccharides and with a protein side chain are represented by multidimentional ellipsoidal zones in subspaces of associated internal variables (ϕ/ψ/ω). To evaluate the positions, sizes, and probabilities of preferred zones in ϕ/ψ/ω subspaces, we carried out statistical analysis for a representative set of known glycoprotein structures solved by X-ray diffraction at 2.5 Å or better resolution. The resulting maps were divided into regions based on visual inspection and, therefore, are somewhat arbitrary. However, two regions were considered to be independent if they were separated by at least 20°. Extremely accurate definition of the probability zones is not critical because we use the continuous distribution rather than fixed rotamers. Each region corresponds to a preferred zone, which was approximated by an ellipse with the center
| 11 |
and probability n/N, where i is a variable contributing to the zone, p is an index of a point, n is a number of points in the region, and N is a total number of points.
It should be emphasized that the low-populated areas, which are not explicitly represented by any zone, may be still accessed by the BPMC procedure from the neighboring zones because of the tails of the Gaussian probability distributions of the random step.
The BPMC global optimization method employed in this work consists of the following steps repeated iteratively: (1) random conformational change, (2) local energy minimization of the ICMFF41 energy function using analytical derivatives, (3) evaluation of additional energy terms weakly dependent on the local conformational changes (solvation), and (4) acceptance decision based on the total energy using the Metropolis criterion.59 Temperature parameter for the Metropolis criterion in MC was set to 600 K. Up to 300 + 20n (where n is the number of glycan residues) steps of local gradient minimization were allowed after each random step. A simple empiric rule was used to determine the total length of the BPMC simulation: the simulation was terminated after (50 000 + 40 000n3) energy evaluations. We evaluated convergence to the global minimum by performing five independent runs of the full protocol in parallel. Whenever no further progress was detected in the current run, a different conformation was chosen from the ensemble of already generated conformations to start a new trajectory. Lack of progress was determined using a visit count mechanism.46
We used the BPMC method to locate the global minimum of the energy function, which consists of the ICMFF energy supplemented by the SA-based solvation energy term (eq 9). To account for solvent screening of electrostatic interactions, a simple distance-dependent dielectric constant model, ε = ε0r with initial dielectric constant ε0 = 2, was used.
II.J. Experimental Data Used for Deriving BP Zones
To derive BP zones for different combinations of glycan residues, ϕ/ψ/ω torsional angles of glycans in glycoprotein crystal structures were collected from PDB using the glycosciences.de Web site60 (data collected in December 2012). We considered only structures solved by X-ray diffraction at 2.5 Å or better resolution. All of the obtained data pertaining to glycan–glycan linkages were grouped into four sets corresponding to four possible stereoisomers formed by the two glycans (Figure 4). For protein–glycan linkages, we selected structures containing at least one protein–glycan linkage of the following type: α/β-*-Ser, α/β-*-Thr, or α/β-*-Asn, where * stands for any saccharide from Table 1.
The following definitions of the torsional angles (Figure 4) were adopted for analysis of the glycan–glycan and protein–glycan linkage conformations
It should be mentioned that the quality of the glycan portions of glycoprotein structures is often much lower than that of its protein part. For many crystal structures in PDB, glycan units do not fit the corresponding electron density maps well or the electron density is absent for the glycan parts of the glycoprotein structure. It is also quite common for pyran rings of some glycan residues to deviate significantly from the two enantiomeric chair forms (4C1 and 1C4). All of these types of problems occur even in high-resolution X-ray structures deposited in PDB.
The large amount of the experimental data available for glycoproteins precludes detailed inspection of all glycan residues. To eliminate erroneous information, we compared ϕ/ψ/ω angular distributions describing protein–glycan and intraglycan linkages with the corresponding QM energy maps. Structures corresponding to the high-energy regions were subjected to visual inspection. Linkages involving monosaccharides with conformations of the pyran ring other than 4C1 and/or unrealistically large (>125°) C1–O–C angles were excluded.
A wide range of values of the ψN angle in the Asn–glycan linkage can be found in X-ray structures, with some of them close to 90°. Because amide torsion is well-known to possess a high (∼20 kcal/mol) rotation barrier, only linkages with ψN = 180 ± 20° were analyzed.
Finally, to study the influence of glycosylation on conformational preferences of the Asn, Thr, and Ser side chains, we analyzed distributions of χ1 and χ1/χ2 angles of nonglycosylated Thr/Ser and Asn, respectively. The analyzed data set consisted of ∼33 000 protein crystal structures solved by X-ray diffraction at resolution below 2 Å and containing nonglycosylated Asn, Ser, and Thr. Because glycosylation takes place mostly on the protein surface, only the residues with nonzero solvent-accessible surface area were considered.
II.K. Evaluation of ICMFF for Oligosaccharides and Glycoproteins
Although glycans are highly flexible systems, it was shown that their structures display a high degree of variation, within well-defined limits, with the overall topology of the molecule being relatively conserved.61 An extensive reorganization of solvent and inter-residue hydrogen bonds is required for significant conformational changes to occur. Flexibility is reduced even further when an oligosaccharide is considered in the context of glycoprotein. These considerations provided a basis for using molecular mechanics (BPMC) simulations for evaluation of the new force field. Two types of tests were carried out to assess the new force field: one for free oligosaccharides in solution and another one for glycoproteins containing glycan chains of different length.
Results of the conformational search for free oligosaccharides were compared with the available NMR data and results of MD simulations. Oligosaccharides considered in this work contain from 2 to 5 residues and are listed in Tables S3 and S4, Supporting Information.
X-ray structures of 15 glycoproteins containing glycan chains with lengths ranging from 1 to 12 residues and that are covalently bound to a protein were also used in this work (Table 2). All structures were solved at high resolution (2 Å or better) and contain most of the glycan residues from Table 1.
Table 2. Structure Prediction Results for Glycan Chains of Different Length Obtained Using ICMFF.
| simpleb |
neighbors
and waterc |
side-chains
sampling (SC)a,d |
||||||
|---|---|---|---|---|---|---|---|---|
| chain length | PDB ID | residue no. | predicted RMSD (Å) | best RMSD sampled (Å) | predicted RMSD (Å) | best RMSD sampled (Å) | predicted RMSD (Å) | best RMSD sampled (Å) |
| 1 | 1kcc | N92 | 1.04 | 0.01 | 0.73 | 0.64 | 5.38 | 0.74 |
| 1kcc | N161 | 0.47 | 0.44 | 1.49 | 1.48 | 4.47 | 0.60 | |
| 1a7s | N114 | 0.68 | 0.25 | 0.67 | 0.17 | |||
| 1gpe | N392 | 0.86 | 0.60 | 0.89 | 0.53 | 1.13 | 0.64 | |
| 1gpe | N165 | 0.91 | 0.86 | 0.44 | 0.37 | 0.92 | 0.60 | |
| 2q9o | N39b | 0.30 | 0.24 | 0.64 | 0.26 | |||
| 2q9o | N396b | 1.99 | 0.70 | 0.68 | 0.24 | 2.92 | 0.71 | |
| 2q9o | N39a | 0.37 | 0.35 | 0.87 | 0.41 | |||
| 2q9o | N244a | 1.56 | 0.31 | 0.67 | 0.20 | 6.14 | 1.32 | |
| 2q9o | N396a | 0.33 | 0.18 | 0.33 | 0.28 | |||
| 3og2 | N709 | 2.07 | 0.28 | 0.66 | 0.49 | 2.19 | 0.26 | |
| 3pxl | N333 | 0.24 | 0.23 | 0.59 | 0.13 | |||
| 3pfz | N431 | 0.35 | 0.33 | 0.32 | 0.23 | |||
| 3clu | N104 | 0.65 | 0.30 | 0.82 | 0.77 | |||
| 3clu | N182 | 0.25 | 0.22 | 0.72 | 0.60 | |||
| 1k7c | N104 | 0.22 | 0.11 | 0.63 | 0.43 | 0.73 | 0.46 | |
| 1myr | N21 | 1.36 | 0.27 | 0.72 | 0.33 | 0.77 | 0.41 | |
| 1myr | N482 | 0.39 | 0.30 | 0.25 | 0.25 | 5.10 | 0.26 | |
| 1myr | N244 | 0.73 | 0.36 | 0.72 | 0.34 | 5.95 | 0.52 | |
| 1myr | N90 | 0.71 | 0.20 | 0.65 | 0.10 | 5.99 | 0.87 | |
| 3m5q | S336 | 0.30 | 0.30 | 1.01 | 0.11 | 0.28 | 0.25 | |
| 1bxo | S3 | 1.40 | 0.42 | 1.03 | 0.38 | 1.00 | 0.39 | |
| 1bxo | T7 | 0.86 | 0.12 | 0.84 | 0.12 | 1.91 | 0.07 | |
| 1rmg | S380 | 1.91 | 0.10 | 1.26 | 0.14 | |||
| 1rmg | S418 | 0.39 | 0.15 | 0.28 | 0.10 | 0.87 | 0.14 | |
| 2 | 3m5q | N131 | 0.58 | 0.14 | 1.08 | 0.15 | ||
| 1a7s | N145 | 0.99 | 0.93 | 0.79 | 0.40 | 3.13 | 0.62 | |
| 2q9o | N216 | 0.88 | 0.75 | 0.93 | 0.51 | |||
| 2q9o | N289 | 0.52 | 0.31 | 0.50 | 0.50 | |||
| 2q9o | N376 | 0.79 | 0.46 | 1.17 | 0.97 | |||
| 2q9o | N216 | 0.82 | 0.52 | 1.08 | 0.79 | |||
| 3og2 | N434 | 1.55 | 0.64 | 0.98 | 0.34 | 1.62 | 0.53 | |
| 1gpe | N357 | 1.00 | 0.64 | 0.99 | 0.68 | |||
| 3pxl | N436 | 0.71 | 0.68 | 1.12 | 0.80 | |||
| 1myr | N218 | 1.23 | 0.62 | 1.26 | 0.66 | 5.58 | 0.46 | |
| 3 | 2q9o | N88 | 1.49 | 0.37 | 0.66 | 0.41 | 4.57 | 0.46 |
| 2q9o | N289 | 0.43 | 0.39 | 0.69 | 0.43 | 1.05 | 0.47 | |
| 3pxl | N217 | 1.47 | 0.48 | 1.23 | 1.10 | 0.93 | 0.55 | |
| 2ciw | N93 | 0.84 | 0.49 | 1.11 | 0.45 | |||
| 1rmg | N299 | 2.36 | 2.20 | 2.40 | 2.11 | 2.57 | 2.01 | |
| 4 | 3pfz | N267 | 1.57 | 0.92 | 0.81 | 0.55 | 1.29 | 1.13 |
| 5 | 1gpe | N93 | 0.95 | 0.62 | 0.99 | 0.65 | 0.97 | 0.55 |
| 2q9o | N201 | 7.56 | 2.88 | 7.91 | 1.28 | 5.93 | 2.73 | |
| 1gai | N171 | 1.24 | 0.87 | 1.67 | 0.71 | |||
| 1ioo | N28 | 3.54 | 2.32 | 3.56 | 1.35 | 4.97 | 3.17 | |
| 6 | 1k7c | N182 | 5.14 | 2.77 | 0.40 | 0.31 | 0.77 | 0.77 |
| 7 | 3og2 | N267 | 1.25 | 0.76 | 0.92 | 0.52 | 1.43 | 1.04 |
| 3pxl | N54 | 5.90 | 0.48 | 2.41 | 0.54 | 9.91 | 8.04 | |
| 4dz8 | N297 | 3.92 | 1.21 | 1.43 | 0.86 | 4.67 | 0.93 | |
| 8 | 3gly | N395 | 11.70 | 1.66 | 2.65 | 0.54 | 5.45 | 2.87 |
| 9 | 1gai | N395 | 4.20 | 2.75 | 1.53 | 0.60 | 4.78 | 4.29 |
| 10 | 4fqc | N105 | 6.14 | 1.74 | 12.96 | 3.78 | ||
| 12 | 3og2 | N930 | 1.53 | 1.35 | 2.54 | 1.77 | ||
Torsional angles of the protein side chains in contact with the glycan were allowed to vary during the simulations.
The simulation system consisted of the glycoprotein only, i.e., glycan chain and the protein chain to which it is bound.
The simulation system included the glycan and protein chains plus water molecules and all other protein chains (crystallographic neighbors) in direct contact with the glycan.
The simulations system was the same as in footnote c except for water molecules.
If a given glycan chain of a protein in its native conformation does not have any direct interactions with any other glycan chains from the same protein, then the conformation of this chain was optimized while keeping the rest of the glycoprotein structure fixed. If two or more glycan chains are in direct contact in the experimental structure, then the internal degrees of freedom of all of them were allowed to vary during the conformational search.
Due to the inherent flexibility of glycans, accurate prediction of their conformations requires not only their interactions with the proteins they are attached to but also those with the neighboring protein chains to be taken into account. Moreover, many glycoproteins display water-mediated protein–glycan interactions. Omitting those water molecules in the simulations may lead to incorrect prediction of glycan conformations. Therefore, some simulations described in this work (Results and Discussion) were carried out by considering all protein chains within a 5 Å distance from a given glycan chain and all water molecules that are within a 5 Å distance of the glycan chain and are in contact with both the glycan chain and a protein.
Since the goal of this work is to evaluate the new glycoprotein force field, use of the experimental information about protein crystal packing and the number and positions of water molecules is appropriate. In contrast, fully ab initio prediction of glycan conformations is a much more challenging task, and it will be a subject of future research.
The standard protonation state at pH 7.0 was assigned to all titratable groups (histidine and tyrosine residues were considered to be uncharged). Only the δ tautomer of histidine was used.
Accuracy of the glycan modeling results was assessed using the heavy-atom root-mean-square deviation (RMSD) computed after superimposing the body (i.e., all of the residues except those of the glycan chains) of the protein.
The BPMC method was applied to a system containing a glycoprotein with the glycan chain of interest, neighboring protein chains, and water molecules. The starting system was obtained by optimizing the native structure by conversion to the standard ICM covalent geometry (which included rebuilding of all hydrogens) by carrying out a systematic search for torsional angles defining positions of polar hydrogens and by setting all glycan ϕ, ψ, and ω angles to 180°.
III. Results and Discussion
III.A. Statistical Analysis of Local Conformational Preferences of Glycans
III.A.1. Glycan–Glycan Linkages
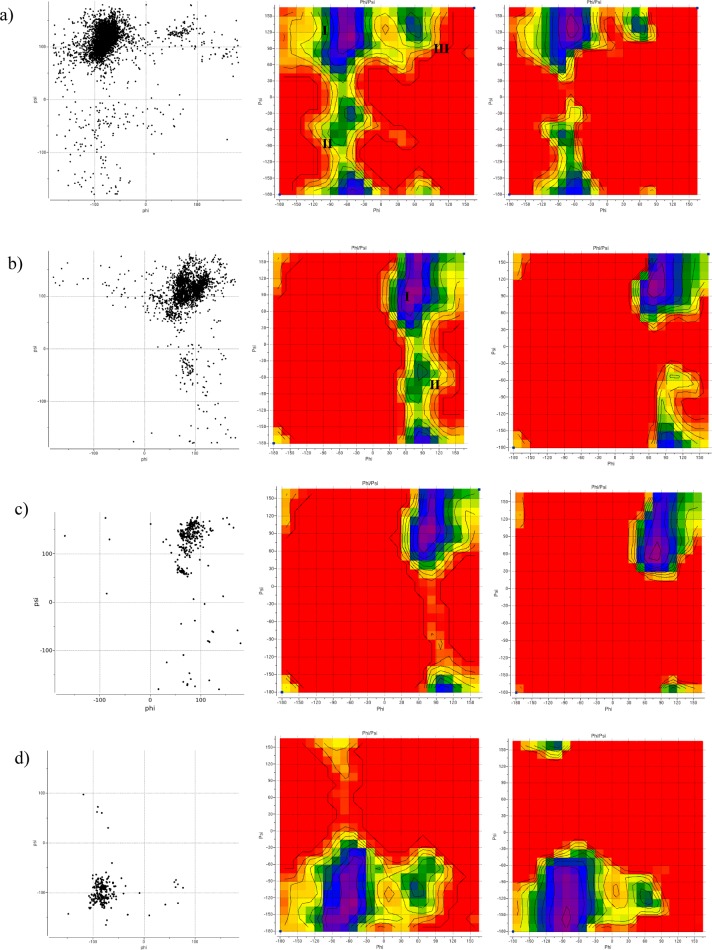
All C–O–C glycan–glycan linkages retrieved from PDB were divided into four groups corresponding to the model molecules shown in Figure 4. The ϕ/ψ distribution for the most common C1–O–C linkage type, namely, eq–eq, is shown in Figure 6a (left). It corresponds roughly to the three minima of the eq–eq energy map (Figure 6a, middle), with the lowest-energy minimum (ϕ ∼ −80°; ψ ∼ 120°) being the most populated one. Conformations of the eq–eq model molecule corresponding to the three energy minima are shown in Figure 7. Table S5 shows the breakdown of eq–eq ϕ/ψ distribution according to the different linkage types. ϕ/ψ angles for the majority of linkages have values in the lowest-energy region (minimum I, Figure 6a) with insignificant (<0.05) contributions from minima II and III. The β-d-GlcpNAc-(1–4)-α-d-GlcpNAc, β-d-GlcpNAc-(1–3)-β-d-Gal, and β-d-Man-(1–3)-β-d-Man linkages are the only exceptions with β-d-GlcpNAc-(1–4)-α-d-GlcpNAc displaying two populated regions (minima I and III), β-d-GlcpNAc-(1–3)-β-d-Gal has one well-defined cluster around −80/–130°, and β-d-Manp-(1–3)-β-d-Manp has no well-defined minimum, with ϕ/ψ values scattered in ϕ < 0, ψ < 0 region.
Figure 6.
Conformational preferences of different C–O–C disaccharide linkages: (a–d) eq–eq, ax–eq, ax–ax, and eq–ax C–O–C disaccharide linkages, respectively. (Left) Distribution of ϕ/ψ angles in high-resolution PDB structures of glycoproteins with each type of linkage (6319 linkages from 1810 structures for eq–eq, 2303 linkages from 920 structures for ax–eq, 434 linkages from 200 structures for ax–ax, and 239 linkages from 101 structures for eq–ax). (Middle, right) QM and total ICMFF energy surfaces, respectively, for model molecules 1–4 (Figure 4). The color code from purple to red of the energy maps corresponds to the 0–8 kcal/mol range. Contours are drawn with 1 kcal/mol step.
Figure 7.

Conformations of the eq–eq model molecule corresponding to the three minima on the ϕ/ψ energy map (Figure 6a).
The second most common (2303 hits) linkage type is ax–eq. Distribution of ϕ/ψ values for this linkage (Figure 6b, column 1) is in line with the corresponding QM energy map (Figure 6b, middle), i.e., points in Figure 6a are localized in the vicinity of two minima of the energy map. The populations of the two regions are very different, with the ϕ/ψ angles for the majority of linkages in the vicinity of minimum I (Table S6). ϕ/ψ angles of α-d-Manp-(1–3)-β-d-Manp, α-d-Manp-(1–3)-α-d-Manp, α-d-Galp-(1–3)-β-d-Galp, α-d-GalpNAc-(1–3)-β-d-Galp, and α-d-Glcp-(1–3)-α-d-Manp populate exclusively minimum II (Table S6).
There is a significantly smaller amount of experimental data for the ax–ax (Figure 6c, left) and eq–ax (Figure 6d, left) linkages (434 and 239 hits, respectively). The corresponding QM energy maps (middle of Figure 6c,d) display only one minimum that is in agreement with the observed ϕ/ψ distributions. Description of the corresponding probability zones is reported in Tables S7 and S8.
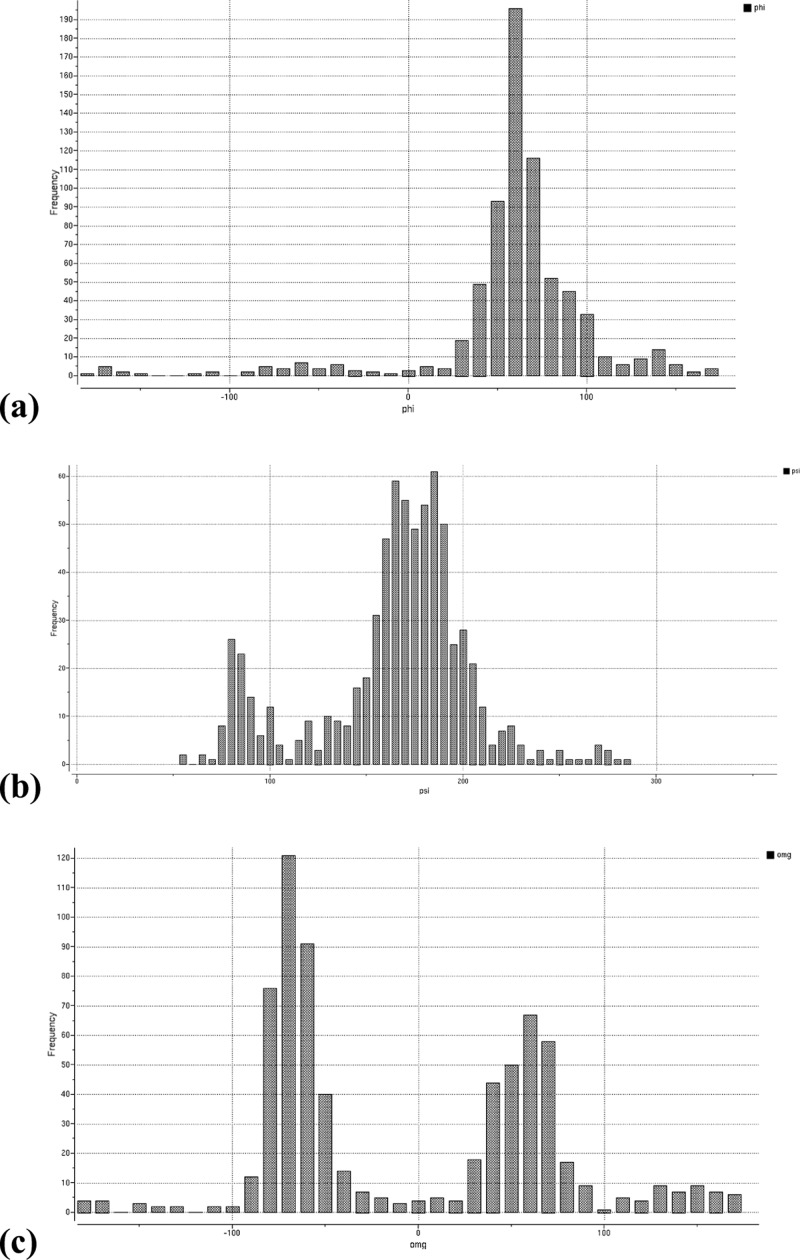
Analysis of the glycoproteins containing 1–6 linkages shows that the majority (87%) of them involve α-glycans (Table S9). As can be seen from Figure 8, the α-(1–6) linkage adopts two significantly populated conformations with ϕ ∼ 70° and ψ ∼ 180° that differ only in the value of ω (180° and 60°). The β-(1–6) linkage has two almost equally populated states at ϕ ∼ −100°, ψ ∼ −165°, and ω = 10° and 160°.
Figure 8.
Distribution of (a) ϕ, (b) ψ, and (c) ω torsional angles in PDB structures of glycoproteins with 1–6 disaccharide linkages. ψ histogram is offset into the 0 to 360° range rather than −180 to 180° to better show the major peak at 180°.
ϕ/ψ values and their standard deviations reported in Tables S5–S9 were used to define biased probability zones for glycoproteins.
III.A.2. Protein–Glycan Linkages
N-Linkage
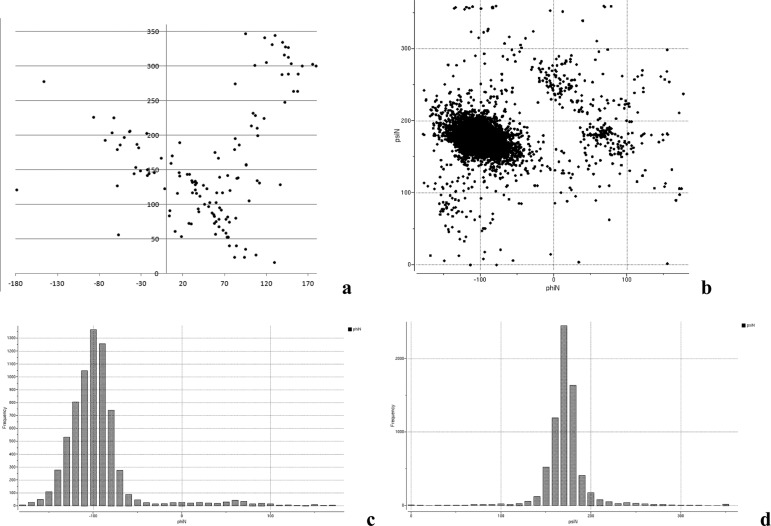
Search carried out for α-glycans connected to Asn residues of glycoproteins yielded 301 linkages from 204 crystal structures. Distribution of the ϕN/ψN angles for α-*-Asn (where * is exclusively α-d-GlcNAc) is shown in Figure 9a. As seen from Figure 9a, both ϕN and ψN angles can assume a wide range of values with no preferred conformations. If we consider only highly accurate experimental structures (selected according to the presence of electron density at the locations of all ring atoms of the first glycan monosaccharide), then the majority of the remaining points will be located in the ϕN > 0°, ψN < 150° region without a well-defined preferred conformation. Small amount of the available experimental data coupled with the wide dispersion of the ϕN/ψN values did not allow us to define BP zones for α-*-Asn linkage.
Figure 9.
Distribution of ϕ/ψ torsional angles in PDB structures of proteins with N-linkages: (a) α-d-GlcNAc-ASN and (b–d) β-d-GlcNAc-ASN.
More data is available for β-*-Asn linkages (7030 linkages from 1887 structures), including 7025 β-d-GlcpNAc-(1–4)-Asn, 2 β-d-Man-(1–4)-Asn, 2 β-d-Glc-(1–4)-Asn, and 1 β-d-GalNAc-(1–4)-Asn linkages. As can be seen from Figure 9b, the β-*-Asn linkage adopts only one significantly populated conformation at ϕN = −97.9 ± 20.8° and ψN = 176.3 ± 15.6°, which is in line with the results reported by Petrescu et al.62 According to Figure 9d, ψN, which corresponds to the rotation about the amide double bond, can assume values close to ±90°. If these energetically unfavorable conformations are excluded from the analysis, i.e., only the points with ψN = 180 ± 20° are considered, then two unequally populated clusters remain: one at ϕN ∼ −100°, ψN ∼ 180° and much smaller one at ϕN ∼ 60°, ψN ∼ 180°. Description of the BP zones corresponding to these two clusters is given in Table S10.
To study whether the presence of glycans affects conformational preferences of asparagine, we also analyzed distribution of χ1 and χ2 angles of Asn with bound glycans (Figure S2) and compared it with the side chain torsional angles of nonglycosylated Asn (data not shown). The side chains of glycosylated Asn can exist in three rotameric states with χ1 = −60, +60, or 180° and χ2 ≈ 0° (χ2 is defined relative to Oδ). Occupancies of the three χ1 rotamers are 47, 33, and 20% for χ1 = 180, −60, and +60°, respectively. The range of χ2 values (∼±45°) is significantly wider than that of χ1 (±10°). In comparison, side chains of nonglycosylated asparagines fall into the same three conformations, but populations of the three states are different from those of glycosylated Asn. Thus, χ1 = −60° is by far the most populated conformation (60%) with χ1 = 180 and 60° observed in only 27 and 13% of asparagine residues, respectively. The χ1 distribution widths for both glycosylated and nonglycosylated asparagins are roughly the same (±11°). It should be mentioned that the χ1 angular distributions obtained for glycosylated and nonglycosylated asparagines are in very good agreement with the results reported by Petrescu et al.,62 who used much smaller data set for their analysis.
Differences in conformational preferences found for glycosylated and nonglycosylated asparagine mean that the BP zones for Asn that are currently used in ICM should be supplemented by the χ1/χ2 zones for glycosylated Asn.
O-Glycan–Protein Linkage
O-Linkages are much less numerous than N-linkages. Search in PDB yielded the total of 260 linkages, with 158 of them for α-glycans connected to Ser and 88 for α-glycans bound to Thr. There is not enough experimental data (14 linkages only) to carry out conformational analysis for β-glycans connected to either Ser or Thr.
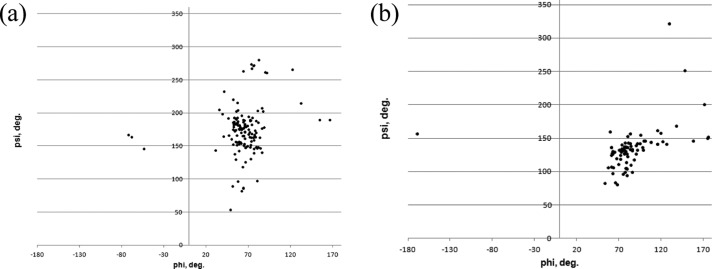
α-d-Mannose is the most common monosaccharide found in O-linkages with protein (245 out of 260 analyzed linkages). Distributions of ϕO/ψO angles for glycan–Ser and glycan–Thr are shown in Figure 10. Both distributions display a single well-defined cluster of conformations. Parameters of the corresponding BP zones are given in Table S10.
Figure 10.
Distribution of ϕ/ψ torsional angles in PDB structures of glycoproteins with O-linkages: (a) α-*-Ser and (b) α-*-Thr structures.
χ1 values for glycosylated Ser and Thr belong to three main conformations, i.e., 180°/–60°/60° with relative populations of 37, 43, 15% and 7, 53, 40%, respectively (Figure S3). Comparison of the χ1 values for glycosylated and nonglycosylated Ser and Thr demonstrates that glycosylation changes conformational preferences of both Ser and Thr. Thus, χ1 = 60° is the most populated rotameric state for nonglycosylated residues (∼55% for Thr and Ser), in contrast with χ1 = −60° for the glycosylated ones. Populations for nonglycosylated Ser and Thr are 18, 26, 56% and 5, 40, 55%, respectively.
III.A.3. ω Angle in CH2OH Exocyclic Groups
Three stable staggered conformations are possible for the exocyclic CH2OH group: gauche–trans (gt), trans–gauche (tg), and gauche–gauche (gg), referring to the configuration of the O6–C6–C5–O5 and the O6–C6–C5–C4 torsion angles, respectively (Figure 11). Experimental studies have shown63 that in glycopyranosides the ω torsional angles (O6–C6–C5–O5) display a preference for the gauche conformation, in disagreement with predictions based on gas-phase QM calculations. The ω angle in galactopyranosides displays a high proportion of the anti orientation. It is recognized that the gauche effect in carbohydrates is a solvent-dependent phenomenon.34 Kirschner and Woods34 demonstrated that the experimental rotamer distributions about the ω angle can be reproduced only if explicit water is included in simulations. The main role of water appears to be to disrupt the hydrogen bonding within the carbohydrate, allowing the rotamer populations to be determined by internal electronic and steric repulsions between oxygen atoms.34 These findings indicate that QM calculations used in this work for parametrizing torsional potentials cannot be applied to obtaining torsional parameters of the ω angle. As an alternative, we adopted an approach based on rotamer populations for the ω angle derived from the experimental NMR J coupling constants.63 Thibaudeau et all.63 presented data for rotameric populations of ω angle in saccharide hydroxymethyl groups. Their results also showed that the anomeric and C4 configurations affect the distribution of ω rotamers. Thus, α-anomers with equatorial C4 configuration are characterized by the 45/45/10% distribution of gg/gt/tg, respectively. β-anomers, on the other hand, have higher population of gt rotamers (60%), with tg still representing ∼10% of the population. The anomeric configuration has no noticeable effect on ω rotameric populations of saccharides with axial C4 configuration. Seventy percent of the observed rotamers for these saccharides were gt, with 30% being tg rotamers. Virtually no gg rotamer was observed. We used these experimental populations to compute relative stabilities of gg, gt, and tt conformations for the two model molecules (Figure 11) representing glycopyranoside and galactopyranoside fragments. We found that a three-term torsional potential (eq 4) is not sufficient for reproducing the observed conformations of glycans with either an axial or equatorial C4 configuration. An additional cosine term shifted by −60° was introduced to avoid overstabilizing the gg conformation. Parameters of the torsional potential were adjusted manually to achieve relative stabilities of gg, gt, and tg conformations observed from the experiment, i.e., 0.0/0.0/1.93 kcal/mol and 0.0/0.19/1.79 kcal/mol for gg/gt/tg conformations for molecules 1 and 2 (Figure 11), respectively. The resulting torsional parameters are given in Table S11, Supporting Information.
Figure 11.
Model molecules used for parametrization of ω torsional potential in (a) glucopyranoside and (b) galactopyranoside fragments.
III.B. Evaluation of Nonbonded Parameters
Although the ICMFF nonbonded parameters used in this work have already been evaluated in ref (41), we considered eight crystal structures of monosaccharides from the Cambridge Database (Table S12) to make sure that those parameters are indeed transferable to saccharides and glycoproteins. Each of the eight experimental structures was energy-minimized using the GRYSTALG program (see ref (41) for details). Partial atomic charges derived in this work for hexose residues were used. Results of the crystal computations, including changes in unit cell parameters after energy minimization with ICMFF, are reported in Table S12, Supporting Information. To assess the energetic aspect of the force field’s performance, a literature search of experimental enthalpies of sublimation was carried out for the monosaccharides from Table S12. α-d-Glucose is the only molecule for which sublimation enthalpy is available (column 7 of Table S12). As seen from Table S12, energy minimizations with ICMFF led to small (less than 5%) changes in unit cell parameters, whereas the lattice energy obtained for α-d-glucose (−40 kcal/mol) is between the two experimental values (33.2 and 46.5 kcal/mol) available for this molecule. These results indicate that nonbonded parameters in ICMFF are accurate enough to reproduce crystal structures of most common monosaccharides. Although the two experimental values of sublimation enthalpy reported in literature differ by ∼13 kcal/mol, the fact that the computed lattice energy of the α-d-glucose crystal is close to both of them suggests that ICMFF describes energetic aspect of intermolecular interaction reasonably well.
III.C. Parameterization of the ϕ/ψ Torsional Potential
III.C.1. C–O–C Glycan–Glycan Linkage
The accuracy of the force field energy function with respect to ϕ/ψ angles is of extraordinary importance in glycans and glycoproteins because relatively small ϕ/ψ angular deviations can result in large movements as they propagate along the glycan chain. As in the case of the protein backbone, we paid special attention to the parameters and choice of the functional form for glycan ϕ/ψ torsional potentials. The same empirical approach that was used for parametrization of protein backbone torsional potential41 was applied to glycans. It was designed to reproduce main features of the QM ϕ/ψ map (such as shape and relative stability of the low-energy regions) while focusing on the low-energy regions that are also the most populated areas of the ϕ/ψ map obtained from the analysis of the experimental glycoprotein structures from PDB.
QM computation of energy as a function of all torsional degrees of freedom is unfeasible even for the simplest disaccharides; therefore, we used simplified model molecules shown in Figure 4 to produce ϕ/ψ energy maps for glycan–glycan linkages. These molecules lack hydroxyl group and, therefore, their energy maps may somewhat differ from the ϕ/ψ maps of real disaccharides. To verify whether the energy maps from Figure 6 (middle) are sufficiently similar to those of disacchirides, we compared them with the distributions of experimental values of ϕ/ψ angles from the data collected for the same four types of glycan–glycan linkages PDB (Figure 6, left). In general, the most populated, according to the statistics from PDB, areas of the ϕ/ψ maps agree well with the low-energy regions of the corresponding QM maps. It should be mentioned that the distributions in Figure 6 display a large number of outliers, which can be attributed to the low quality of the glycan segments of some experimental structures. Therefore, we considered the QM energy maps as our target data.
First, we calculated ϕ/ψ energy maps for the nonbonded terms (van der Waals and electrostatics) of the ICMFF force field energy function using the model molecules shown in Figure 4 and then compared them to the corresponding QM energy maps.
Molecule 1 (eq–eq)
The experimental ϕ/ψ distribution for this linkage type displays three populated regions, which correspond roughly to the three energy minima of the QM map (Figure 6a, middle). The deepest energy minimum (and the largest cluster) is at ϕ ∼ −60° and ψ ∼ 120°. Other, much smaller, minima are located at ϕ = −60°, ψ = −30° and ϕ = 45°, ψ = 150° with energies of 2.5 and 2.3 kcal/mol, respectively. There is no well-defined cluster around ϕ = −60°, ψ = −30° (Figure 6a, left). These three minima are also present on the nonbonded energy map; however, all of them are more extended along the ϕ axis. Three-term torsional potentials, fitted by optimizing target function in eqs 5 and 6, for both ϕ and ψ angles were found to be necessary to correct the nonbonded energy map. The resulting MM map shown in Figure 6a (right) agrees well with the QM map except for the region around ϕ = −60°, ψ = −30°. Thus, the ϕ = 45°, ψ = 150° minimum is 2.5 kcal/mol higher than the one at ϕ ∼ −60°, ψ ∼ 120°, which is close to the QM value of 2.3 kcal/mol. The depth of the third minimum (ϕ = −60°, ψ = −30°) of the QM map is reproduced well on the MM map (2.5 kcal/mol); on the other hand, it is position is shifted to ϕ = −90°, ψ = −75°. Since there is no well-defined cluster of experimental conformations in the vicinity of this minimum, we did not attempt to improve further the agreement with the QM map.
Molecule 2 (ax–eq)
The experimental ϕ/ψ distribution (Figure 6b, left) for molecule 2 has one densely populated region around ϕ = 60°, ψ = 90° corresponding to the lowest minimum of the QM energy map. A significantly smaller number of points are also present in the other regions of the map, in particular, around ϕ ∼ 70°, ψ ∼ 50°. This region coincides with the second minimum (2.9 kcal/mol higher than the first one) of the QM map. Both of these minima appear to be significantly wider on the nonbonded energy map as compared to the QM one, but the positions of the two minima along the ψ axis are very similar. Therefore, a ϕ-only torsional potential was fitted as above and used to compensate the differences between the QM and nonbonded energy maps. The resulting MM map agrees well with the QM one (right and middle of Figure 6b), especially around the main minimum at ϕ = 60°, ψ = 90°. The second minimum of the MM map is ∼1.5 kcal/mol higher than the corresponding QM minimum (4.6 vs 2.9 kcal/mol). Considering the low probability of conformations corresponding to this minimum, the obtained energy difference is acceptable.
Molecule 3 (ax–ax)
The QM energy map computed for molecule 1 (Figure 6c, middle) displays a single minimum centered at ϕ ∼ 75°, ψ ∼ 90°, which is in agreement with the experimental ϕ/ψ distribution (Figure 6c, left). The corresponding nonbonded energy map also has a single minimum, but it is broader along the ϕ axis, extending all the way to ϕ = 180°. Its lowest point is also shifted along the ψ axis (ψ ∼ 165°). To bring the MM energy map close to the QM one, it was found to be sufficient to add a three-term ϕ torsional potential to the nonbonded energy. Parameters of the potential were optimized by minimizing the target function from eq 5. The MM energy map calculated with the optimized parameters is shown in Figure 6c, right. The width, along the ϕ axis, of the minimum is now very similar for the QM and MM maps, i.e., the QM and MM energies for ϕ = 60°/90° (ψ = −135°) are 0.8/1.4 and 0.3/1.0 kcal/mol, respectively.
Molecule 4 (eq–ax)
The QM map computed for this molecule has two minima (Figure 6d). The lowest-energy minimum is much broader and located at ϕ = −60°, ψ = −135°. The second minimum at ϕ = 45°, ψ = −105° is ∼2.5 kcal/mol higher and separated from the first one by relatively high energy barrier (∼6 kcal/mol). At the same time, the experimental ϕ/ψ distribution for disaccharides occupies mainly one region around ϕ ∼ −80°, ψ ∼ −100° with only few points located in the vicinity of ϕ ∼ 60°, ψ ∼ −100° (Figure 6d, left). The MM ϕ/ψ nonbonded energy map also has two minima, but they are much broader and more similar in energy. There is also virtually no barrier between these two minima. Fitting using the Fourier expansion from eq 4 carried out for ϕ torsional potential alone yielded parameters that reproduce well the general shape of the two minima, their energy difference (2.9 kcal/mol for the MM map), and the energy barrier between them (6.4 kcal/mol for the MM map).
The resulting ϕ/ψ torsional parameters are listed in Table S11 and were used for predicting conformations of glycan chains in glycoproteins (see discussion below).
III.C.2. Side Chain Torsional Potentials
Table S2, Supporting Information, contains the list of small molecules used for parametrization of the torsional energy terms for glycan side chains. Ab initio and ICMFF energies of different conformations are in excellent agreement, i.e., the average difference between them is less than 0.3 kcal/mol. The two largest deviations between the QM and MM energies were obtained for the gauche+ conformation of propylene glycol (0.80 kcal/mol) and for the gauche– conformation of N-(1-methylethyl)-ethanamide (0.86 kcal/mol). As indicated by the results in Tables S2, accuracy of the model is high enough to reproduce well the details of the QM results.
The torsional parameters for glycan side chains are given in Table S11.
III.D. Structure Prediction for Nine-Residue Glycan Chain (PDB ID 1gai)
To investigate the efficiency of the BPMC procedure as a global optimization method for glycoproteins, we chose a nine-residue glycan chain from the crystal structure of glucoamylase-471 (PDB ID 1gai) solved at 1.7 Å resolution. The chain is composed of 2 β-GlcNAc and 7 α/β-Man residues connected via different types of linkages (1–2, 1–3, 1–4, and 1–6). Global energy optimization was carried out for the system including chain A of 1gai plus 17 water molecules forming a layer between the protein and glycan (Figure 12). Positions of the water molecules were taken as those in the experimental structure and were kept fixed. All glycan dihedral angles, C–O–C bond angles, and rotational degrees of freedom of the water molecules were used as variables in local energy minimization, whereas internal coordinates of the protein chain were fixed.
Figure 12.
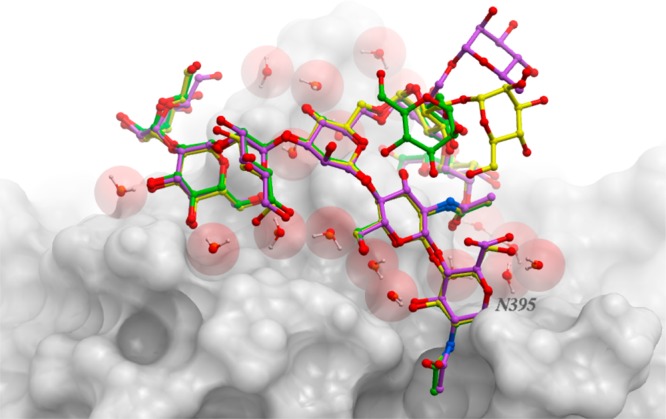
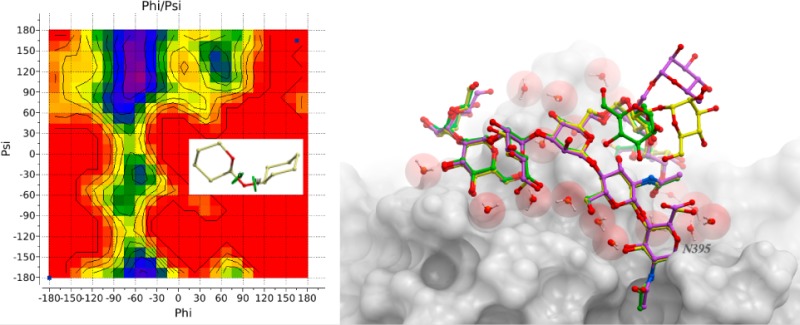
Overlay of the experimental (magenta), the lowest-energy BPMC (green), and the lowest-energy no BPMC (yellow) conformations of the nine-residue glycan chain of PDB 1gai.
The BPMC simulation started from a conformation in which all variable torsional angles were set to 180°. The preferred angular zones used to modify the probability distribution of a random step are those listed in Tables S5–S9. An unbiased (evenly distributed) random step was applied to angles not included in the preferred variable zones. Up to 150 low-energy conformations with a pairwise ϕ−ψ RMSD deviation greater than 30° were accumulated in a so-called conformational stack.42 The maximum number of energy evaluations in every local minimization was set to 480 (300 + 20 × number of residues). The simulation temperature was set to 600 K.
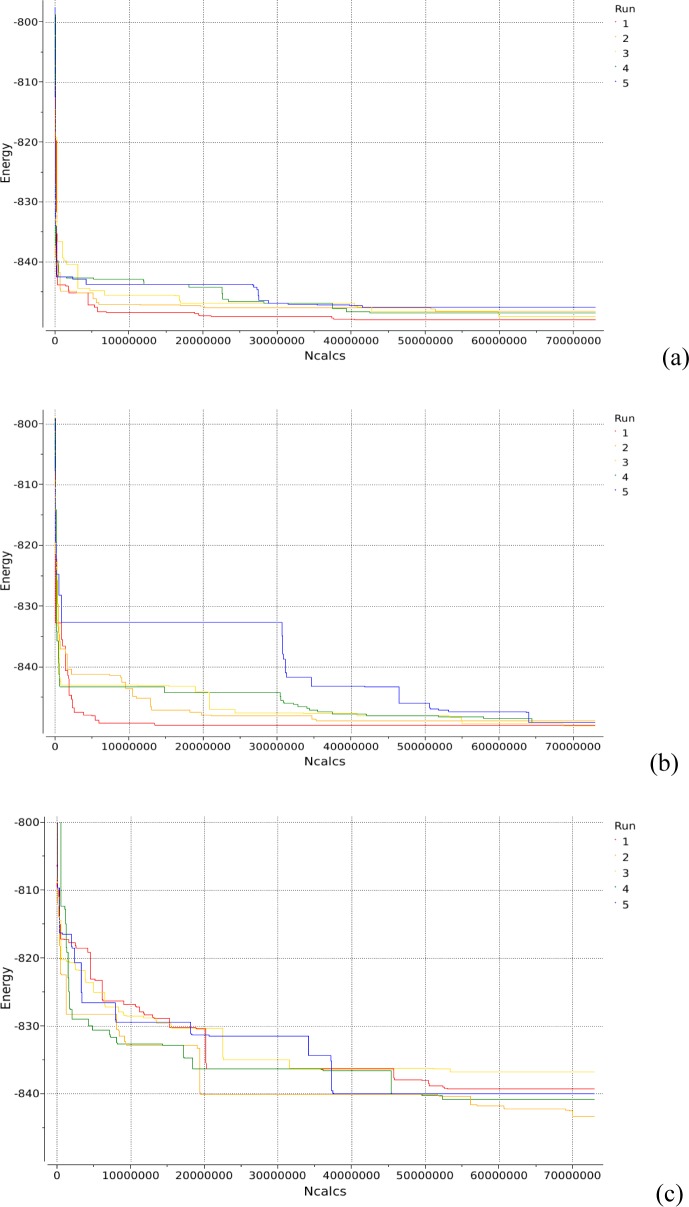
To compare the efficiency of the BPMC procedure with the unbiased MC minimization procedure,64 we performed five simulations of each type starting from different random conformations. Each simulation was limited to ∼12 800 Monte Carlo steps (72 900 000 energy evaluations).
Figure 13 shows the progression of the best energy achieved with the time of simulation for both evenly distributed random steps and the biased ones. All BPMC simulations converged to low-energy conformations much faster than the unbiased runs. Thus, after 30 000 000 energy evaluations, lowest energies from the five BPMC runs were all below −845 kcal/mol (Figure 13a), whereas only three out of five unbiased runs reached such a low energy (Figure 13b).
Figure 13.
Progression of the lowest energy achieved with the time of simulation for PDB 1gai using (a) BPMC steps and ϕ, ψ, ω, and side chain torsional angles as search variables, (b) evenly distributed MC steps and ϕ, ψ, ω, and side chain torsional angles as search variables, and (c) BPMC steps with only ϕ, ψ, and ω angles as search variables.
Although the lowest energies yielded by the two sets of runs are similar, i.e., −850 kcal/mol, they correspond to slightly different conformations. The lowest-energy conformations have RMSD from the native structure of 1.53 and 1.31 Å for the BPMC and unbiased runs, respectively. The superposition of the lowest-energy conformations produced by these two types of simulations and the experimental structure of 1gai is shown in Figure 12. As seen from Figure 12, the two structures located as lowest-energy minima by the BPMC and unbiased runs differ in the orientation of the Man497 residue.
It should be mentioned that the most native-like conformation found by both search methods had RMSD of only 0.6 Å but a higher energy.
Because ϕ, ψ, and ω (in 1–6 linkages) torsional angles in glycans define the overall conformation of a glycan chain, it is possible that efficient coverage of the conformational space in MC simulations could be achieved through random steps for ϕ, ψ, and ω angles only, with the rest of the variables optimized during local energy minimizations. To verify this assumption, we carried out five BPMC runs with only ϕ, ψ, and ω torsional angles as MC variables. Results of these simulations (Figure 13c) show that use of only ϕ, ψ, and ω angles leads to dramatically worse results both in terms of lowest energy found and simulation convergence. For example, the lowest energy reached in these simulations never fell below −845 kcal/mol, in contrast with the lowest energy of ∼−850 kcal/mol reached in the two sets of runs discussed above. This result underscores the role of hydroxyl groups in defining glycan conformation. Interestingly, even though subjecting hydroxyl rotations to MC steps significantly increases the search space, it leads to faster convergence of the simulations.
III.E. Free Oligosaccharides in Solution
The simulation protocol described in the Computational Details and previous sections was applied to locate low-energy conformations of several small oligosaccharides (Tables S3 and S4, Supporting Information) in solution. One-hundred fifty structures generated by each of the five independent runs were combined, structures with energies more than 7 kcal/mol above lowest-energy conformation were removed, and the remaining conformations were grouped into clusters using a pairwise ϕ/ψ RMSD deviation of less than 30°. Each cluster is characterized by the energy of its most stable member and average ϕ/ψ values. Tables S3 and S4 contain information available from NMR, X-ray, and MD studies for the selected oligosaccharides as well as results obtained in this work.
Sattelle and Almond65 applied aqueous MD simulations to study conformational equilibria of mannosyl cores, sialyl Lewis (sLe) antennae, and constituent subsequences (Figure S1, Supporting Information) and compared their results with corresponding NMR and X-ray data. Results of the simulations carried out using our new force field along with those of Sattelle and Almond and the experimental data are given in Table S3. Conformations predicted in this work are listed according to their energies (from lowest to highest). Results in Table S3 show that lowest-energy clusters of conformations are in good agreement with the most populated NMR and MD generated linkage conformations as well as with X-ray data. Thus, differences between ϕ/ψ angles of the experimental and predicted conformations are less than 20° and can be attributed to the static nature of MC simulations used in this work.
A number of di- and trisaccharides have been used66−70 to study conformational flexibility of oligosaccharides with a combination of NMR experiments and MD simulations. It is well-accepted that a syn conformation, in which the H′1–C′1–Ox–Cx and C′1–Ox–Cx–Hx linkage angles are close to 0° (i.e., ϕ and ψ torsional angles according to the NMR definition), is the most stable conformation in solution. However, recent experiments demonstrated that anti conformations at the ϕ or/and ψ torsional angles, although much less populated, are present to a considerable degree. The presence of such conformations is important because it indicates flexibility of oligosaccharide molecules in solution. After reviewing literature on experimental studies of small oligisaccharide, we selected two disaccharides, β-d-Glcp-(1→4)-α-d-Glcp-OMe66 and β-d-Galp-(1→3)-β-d-Glcp-OMe,71 and three trisaccharides, α-d-Glcp-(1→2)-β-d-Glcp-(1→3)-α-d-Glcp-OMe,68 α-d-Glcp-(1→3)-[β-d-Glcp-(1→4)]-α-d-Glcp-OMe,68 and β-d-Glcp-(1→2)-β-d-Glcp-(1→3)-α-d-Glcp-OMe,69,70 as model molecules for assessing accuracy of our newly developed force field. Results of the conformational search carried out for each of the molecules are reported in Table S4, Supporting Information.
For both disaccharides in Table S4, our method finds all three conformations reported in the corresponding experimental works. Relative energies, ΔE’s, indicate that anti conformations are significantly less stable than syn conformation for both disaccharides, which is in agreement with the population values, p, derived from the experimental data.
Clusters of conformations similar to those obtained using a combination of NMR and MD methods for trisaccharides from Table S4 were also found by our method. Average ϕ/ψ values are reasonably close to the ones reported in the literature. Although no experimental populations are available for two out of three trisaccharides from Table S4, high relative energies of anti conformations predicted by our force field are in line with the experimental evidence that these conformations are significantly less populated. ΔE values reported for the last trisaccharide in Table S4 correlate well with the experimental populations observed for this molecule in solution.
Comparison of the results obtained in this work with the NMR/MD and X-ray data shows that the new force field is accurate enough to reproduce oligosaccharide conformations observed in experiment while predicting the most populated of them as those with the lowest energy.
III.F. Structure Prediction for Glycan Chains of Different Length
Accuracy of the new ICM force field for glycoproteins was also evaluated based on RMSD of the lowest-energy conformations generated using ICM from the corresponding PDB structures. The BPMC conformational search was carried out for glycan chains with lengths ranging from 1 to 12 glycan residues (Table 2). Due to the inherent flexibility of glycans, their conformations can be influenced by the presence of crystal neighbors and water molecules. Therefore, two types of BPMC runs were carried out for each glycan chain: (a) one for a simple system containing just the glycan and a protein chain it is bound to (“simple” columns in Table 2) and (b) another one for a system (“neighbors and water” in Table 2) that also contains crystallographic neighbors (protein chains) and water molecules within a 5 Å radius of the glycan chain. Only the water molecules located on the interface between a protein and the glycan were taken into account. It should be mentioned that the “simple” runs were not carried out for the longest glycans, 4fqc (10 residues) and 3og2 (12 residues), because they have extensive contacts with the neighboring protein chains and, therefore, their observed conformations cannot be reproduced without taking the neighboring proteins into account.
Results from Table 2 show that, in general, there is a correlation between the accuracy of the glycan structure prediction (RMSD) and the length of glycan chain. Thus, RMSDs for the majority of the lowest-energy one-residue glycan chains obtained from the “simple” runs are below 1 Å (average and median RMSDs are 0.81 and 0.68 Å, respectively), whereas the average/median RMSD for the two- and three-residue chains are 0.91/0.85 and 1.32/1.47 Å, respectively. It is difficult to draw any general conclusions about the accuracy of the predictions for the longer glycan chains because of the small number of structures considered, which, in turn, related to the much smaller number of high-resolution experimental structures available for glycoproteins containing long glycan chains.
As indicated by the similar values of the lowest-energy RMSDs and best RMSDs sampled, the new force field coupled with the BPMC search located near-native conformations as the lowest energy minima of the potential for the majority of the one-residue glycan chains.
The list of the one-residue glycan chains in Table 2 includes five O-linked glycans. The amount of experimental data available for the O-glycosidic linkages is lower than that for N-linkages, supposedly due to their increased flexibility. The number of O-linkages in our test set is too small to make any meaningful comparison between the accuracy of predictions for N- and O-linked glycans.
More than half of the one-residue glycans are in contact with neighboring protein chains and water molecules. Taking the crystallographic neighbors into account led to lower RMSD values for all of the glycoproteins with crystallographic neighbors except 1kcc (N92, lowest-energy RMSD of 1.49 Å), 1k7c (N104, lowest-energy RMSD of 0.63 Å), and 3m5q (S336, lowest-energy RMSD of 1.01 Å). For 1kcc, both the new lowest-energy RMSD and the best sampled RMSD were much higher than the ones obtained without crystallographic neighbors, suggesting that conformations of the surrounding protein side chains or positions of the water molecules may not be determined accurately enough, leading to an unfavorable glycan–protein interaction in the experimental structure.
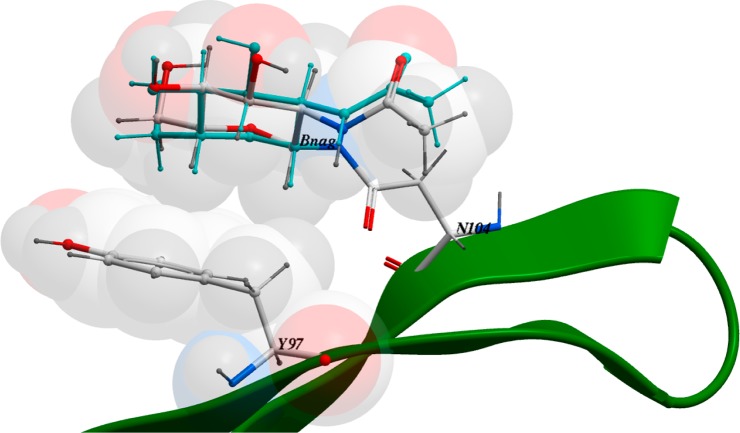
Protein–carbohydrate recognition is generally established through networks of hydrogen bonds and complementary contact between nonpolar surfaces.72−74 While polar side chain groups and main chain amides are used for hydrogen bonding, nonpolar surfaces of carbohydrates often display stacking with aromatic residues. 3c1u (N104) represents the latter case with a β-GlcNAc residue packed against the aromatic ring of Y97 (Figure 14). The ICMFF lowest-energy conformation is in excellent agreement with the experimental structure, indicating that the new force field describes accurately both polar and nonpolar interatomic interactions.
Figure 14.
CH-pi stacking in PDB 3c1u. The experimental BNag conformation is shown in cyan.
The experimental conformations of the two- and three-residue glycans are reproduced well by the new force field (as indicated by RMSD in Table 2). As in the case of the shortest glycan chains, taking crystallogtaphic neighbors into account leads to lower RMSD.
BPMC simulations carried out for 4–10-residue glycans yielded mixed results. Thus, very good agreement with the experimental structure (RMSD < 1.57 Å) was obtained for 3pfz (four residues), 1gpe (five residues), 1gai (five residues), and 3og2 (seven residues) from “simple” BPMC runs. The RMSD was even lower when neighboring protein chains and water molecules were considered. Results obtained for the nine-residue glycan chain of 1gai have been discussed in detail in the previous section. They show that ICMFF can reproduce accurately the native structure as the lowest-energy conformation (RMSD of 1.24 Å) if all crystallographic neighbors are taken into account.
The lowest-energy conformation found for the longest (12 residues, 3og2) glycan chain considered in this work is in very good agreement with the corresponding experimental structure (RMSD of 1.77 Å). Such a low RMSD values obtained for the longest glycan chain can be explained by the good accuracy of the force field used and the relatively restricted space between protein chains available for the glycan (Figure 15).
Figure 15.
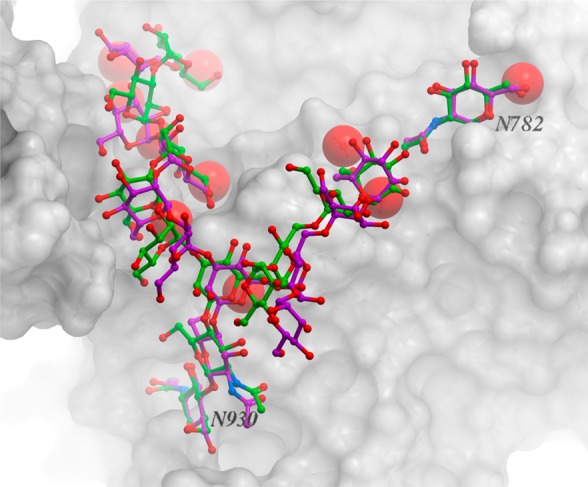
Overlay of the experimental (magenta) and the lowest-energy (green) conformations of the 12-residue glycan chain in PDB 3og2. Heavy-atom RMSD between the two structures is 1.76 Å.
Additionally, we carried out simulations where, in addition to the glycan itself, torsional angles of the protein side chains with the heavy atoms within a 5 Å distance from the glycan heavy atoms (including χ angles of the amino acid directly connected to a given glycan chain) were allowed to vary (“SC” in Table 2). Crystallographic neighbors were included in these simulations, but without any water molecules. These simulations represent a more stringent and more realistic test for a force field. The side chain flexibility also allows possible atomic clashes to be relieved that may be caused by uncertainties in the experimental side chain conformations that, otherwise, would render the observed glycan conformations energetically unfavorable. For the majority of glycan chains from Table 2, side chain flexibility does not lead to lower accuracy of the predictions, which indicates that the new glycan force field is well-matched with its protein counterpart. Thus, conformational search with flexible side chains carried out for 12-residue glycan chain in 3og2 yielded a lowest-energy structure with RMSD of only 2.5 Å from the native conformation, which is close to the RMSD obtained as a results of the “neighbor and water” search (1.77 Å).
According to Table 2, there are a number of cases where RMSD values for the “SC” simulations are quite high. For some of them, such as one-residue glycan chains in 1kcc (N92, N161), 2q9o (N396b), and 3og2 (N709), seven-residue chain in 3pxl (N54), and nine-residue chain in 1gai (N395), the observed glycan conformations are defined by interactions with both the protein and the water molecules located at the glycan–protein interface as indicated by higher RMSD values for the “simple” search and low values for the “neighbors and water” simulations.
It should be mentioned that high RMSD values for the lowest-energy conformations of a given protein obtained as a results of both “simple” and “neighbor and water” simulations may also be a sign of problems with the experimental structure (e.g., close atomic contacts). Some of the close contacts can be eliminated by using flexible side chains, as is the case for the three-residue glycan in 3pxl (N217) (Table 2). For other structures, such as the five-residue glycan chains in 2q9o (N201) and 1ioo (N28) and 10-residue chain in 4fqc (N105), high RMSD’s for all three types of runs may indicate both suboptimal side chain orientations and positions of water molecules.
Although a number of papers describing parametrization and evaluation of force fields for carbohydrates and glycoproteins have been published, it is not easy to compare performance of ICMFF to that of other force fields. Some of the evaluations were based on comparison with QM data for small model systems31 that have limited similarity with the actual biological systems of interest. While certain other studies were carried out using molecular dynamics simulations for large systems (e.g., glycan chains in proteins) and their results are often in reasonable agreement with some experimental data (such as NMR J coupling and NOE values), it is hard to predict how those methods would behave when applied to real-life problems, for example, drug design. To our knowledge, the benchmark set of glycan structures that we have compiled and used to evaluate ICMFF represents the first systematic test for the ability of a glycan force field and simulation method to reproduce experimentally observed three-dimensional glycan structures on glycoproteins.
IV. Conclusions
This work describes the derivation of a parameter set for an internal coordinate all-atom force field that accurately models carbohydrates and glycoproteins. QM calculations were employed to compute properties such as partial atomic charges, torsional parameters, and valence angle deformation force constants. Special attention was paid to torsional parameters because they can have a pronounced effect on the predicted structure of glycans. Thus, QM energy maps were computed for a set of model molecules representing possible glycan–glycan linkages. Standard geometries for the most common monosaccharides were taken from experimental X-ray and neutron diffraction data. A biased probability Monte Carlo search method was adapted for predicting conformations of glycan chains in glycoproteins. First, statistical analysis of the experimental data available for glycans enabled us to determine the high-probability zones for torsional angles of most of the common types of glycan–glycan linkages. Second, these zones were used in conjunction with the BPMC method to predict conformations of glycan chains containing 1–12 residues. Comparison of the performance of a nonbiased Monte Carlo-with-minimization algorithm and BPMC indicates that the latter method is significantly more efficient in locating lowest-energy conformations. As indicated by low RMSDs obtained for the majority of the test glycoproteins, from the shortest to the longest glycan chains, the new ICMFF glycoprotein force field provides accurate description of these complex systems.
Results of our simulations also highlight the importance of solvent–solute interactions in defining native conformations of glycans and suggest that implicit solvent models may not always be adequate for modeling water-mediated protein–glycan interactions. Determining how to address this problem within the framework of MM simulations is a topic of our ongoing research.
Acknowledgments
We thank Eugene Raush for technical assistance.
Supporting Information Available
Table S1: Partial atomic charges for monosaccharides. Table S2: Relative energies for conformations of model molecules used for deriving torsional parameters. Table S3: Conformational information available for selected di- and trisaccharides from experimental and theoretical studies. Table S4: Glycosidic linkage conformers for model oligosaccharides 1–6 from Figure S1. Tables S6–S8: Probabilities, average positions, and sizes of the most populated zones for ϕ/ψ torsional angles in disaccharide eq–eq, ax–eq, ax–ax, and eq–ax linkages. Table S 9: Probabilities, average positions, and sizes of the most populated zones for ϕ/ψ torsional angles in *-6 disaccharide linkages. Table S10: Probabilities, average positions, and sizes of the most populated zones for ϕ/ψ torsional angles in N- and O-protein–glycan linkages. Table S11: Parameters of the torsional potential for mono- and disaccharides. Table S12: Results of local energy minimizations carried out for crystals of monosaccharides with the ICMFF nonbonded parameters. Figure S1: Model oligosaccharides. Figure S2: Distribution of χ1/χ2 angles in high-resolution PDB structures of glycoproteins with β*-Asn linkages. Figure S3: Distribution of χ1 torsional angles in high-resolution PDB structures of glycoproteins with O-linkages. This material is available free of charge via the Internet at http://pubs.acs.org.
This work was funded by NIH grant 5R43 GM090418, Glycoprotein Modeling System for Internal Coordinate Mechanics.
The authors declare no competing financial interest.
Funding Statement
National Institutes of Health, United States
Supplementary Material
References
- Weinhold B.; Seidenfaden R.; Rockle I.; Muhlenhoff M.; Schertzinger F.; Conzelmann S.; Marth J. D.; Gerardy-Schahn R.; Hildebrandt H. J. Biol. Chem. 2005, 280, 42971. [DOI] [PubMed] [Google Scholar]
- Jin L.; Abrahams J. P.; Skinner R.; Petitou M.; Pike R. N.; Carrell R. W. Proc. Natl. Acad. Sci. U.S.A. 1997, 94, 14683. [DOI] [PMC free article] [PubMed] [Google Scholar]
- Haltiwanger R. S.; Lowe J. B. Annu. Rev. Biochem. 2004, 73, 491. [DOI] [PubMed] [Google Scholar]
- Sanders R. W.; Venturi M.; Schiffner L.; Kalyanaraman R.; Katinger H.; Lloyd K. O.; Kwong P. D.; Moore J. P. J. Virol. 2002, 76, 7293. [DOI] [PMC free article] [PubMed] [Google Scholar]
- Arnold J. N.; Wormald M. R.; Sim R. B.; Rudd P. M.; Dwek R. A. Annu. Rev. Immunol. 2007, 25, 21. [DOI] [PubMed] [Google Scholar]
- Almond A.; Sheehan J. K. Glycobiology 2000, 10, 329. [DOI] [PubMed] [Google Scholar]
- Karaveg K.; Siriwardena A.; Tempel W.; Liu Z. J.; Glushka J.; Wang B. C.; Moremen K. W. J. Biol. Chem. 2005, 280, 16197. [DOI] [PubMed] [Google Scholar]
- Varki A. Glycobiology 1993, 3, 97. [DOI] [PMC free article] [PubMed] [Google Scholar]
- Dwek R. A. Chem. Rev. 1996, 96, 683. [DOI] [PubMed] [Google Scholar]
- Lerouxel O.; Cavalier D. M.; Liepman A. H.; Keegstra K. Curr. Opin. Plant Biol. 2006, 9, 621. [DOI] [PubMed] [Google Scholar]
- Berman H. M.; Westbrook J.; Feng Z.; Gilliland G.; Bhat T. N.; Weissig H.; Shindyalov I. N.; Bourne P. E. Nucleic Acids Res. 2000, 28, 235. [DOI] [PMC free article] [PubMed] [Google Scholar]
- Wlodek S.; Skillman A. G.; Nicholls A. Acta Crystallogr., Sect. D: Biol. Crystallogr. 2006, 62, 741. [DOI] [PubMed] [Google Scholar]
- Woods R. J.; Tessier M. B. Curr. Opin. Struct. Biol. 2010, 20, 575. [DOI] [PMC free article] [PubMed] [Google Scholar]
- Wyss D. F.; Choi J. S.; Li J.; Knoppers M. H.; Willis K. J.; Arulanandam A. R.; Smolyar A.; Reinherz E. L.; Wagner G. Science 1995, 269, 1273. [DOI] [PubMed] [Google Scholar]
- Slynko V.; Schubert M.; Numao S.; Kowarik M.; Aebi M.; Allain F. H. J. Am. Chem. Soc. 2009, 131, 1274. [DOI] [PubMed] [Google Scholar]
- Almond A.; Petersen B. O.; Duus J. O. Biochemistry 2004, 43, 5853. [DOI] [PubMed] [Google Scholar]
- Glennon T. M.; Zheng Y. J.; Legrand S. M.; Shutzberg B. A.; Merz K. M. J. Comput. Chem. 1994, 15, 1019. [Google Scholar]
- Kirschner K. N.; Yongye A. B.; Tschampel S. M.; Gonzalez-Outeirino J.; Daniels C. R.; Foley B. L.; Woods R. J. J. Comput. Chem. 2008, 29, 622. [DOI] [PMC free article] [PubMed] [Google Scholar]
- Ott K.-H.; Meyer B. J. Comput. Chem. 1996, 17, 1068. [Google Scholar]
- Momany F. A.; Willett J. L. Carbohydr. Res. 2000, 326, 210. [DOI] [PubMed] [Google Scholar]
- Momany F. A.; Willett J. L. Carbohydr. Res. 2000, 326, 194. [DOI] [PubMed] [Google Scholar]
- Kuttel M.; Brady J. W.; Naidoo K. J. J. Comput. Chem. 2002, 23, 1236. [DOI] [PubMed] [Google Scholar]
- Lii J. H.; Chen K. H.; Allinger N. L. J. Comput. Chem. 2003, 24, 1504. [DOI] [PubMed] [Google Scholar]
- Damm W.; Frontera A.; Tirado-Rives J.; Jorgensen W. L. J. Comput. Chem. 1997, 18, 1955. [Google Scholar]
- Kony D.; Damm W.; Stoll S.; van Gunsteren W. F. J. Comput. Chem. 2002, 23, 1416. [DOI] [PubMed] [Google Scholar]
- Reiling S.; Schlenkrich M.; Brickmann J. J. Comput. Chem. 1996, 17, 450. [Google Scholar]
- Guvench O.; Mallajosyula S. S.; Raman E. P.; Hatcher E.; Vanommeslaeghe K.; Foster T. J.; Jamison F. W. II; Mackerell A. D. Jr. J. Chem. Theory Comput 2011, 7, 3162. [DOI] [PMC free article] [PubMed] [Google Scholar]
- Mallajosyula S. S.; Guvench O.; Hatcher E.; Mackerell A. D. Jr. J. Chem. Theory Comput 2012, 8, 759. [DOI] [PMC free article] [PubMed] [Google Scholar]
- Foley B. L.; Tessier M. B.; Woods R. J. Wiley Interdiscip. Rev.: Comput. Mol. Sci. 2012, 2, 652. [DOI] [PMC free article] [PubMed] [Google Scholar]
- Hemmingsen L.; Madsen D. E.; Esbensen A. L.; Olsen L.; Engelsen S. B. Carbohydr. Res. 2004, 339, 937. [DOI] [PubMed] [Google Scholar]
- Stortz C. A.; Johnson G. P.; French A. D.; Csonka G. I. Carbohydr. Res. 2009, 344, 2217. [DOI] [PubMed] [Google Scholar]
- Sattelle B. M.; Almond A. J. Comput. Chem. 2010, 31, 2932. [DOI] [PubMed] [Google Scholar]
- Corzana F.; Motawia M. S.; Du Penhoat C. H.; Perez S.; Tschampel S. M.; Woods R. J.; Engelsen S. B. J. Comput. Chem. 2004, 25, 573. [DOI] [PMC free article] [PubMed] [Google Scholar]
- Kirschner K. N.; Woods R. J. Proc. Natl. Acad. Sci. U.S.A. 2001, 98, 10541. [DOI] [PMC free article] [PubMed] [Google Scholar]
- Totrov M.; Abagyan R. Proteins: Struct., Funct., Genet. 1997, Suppl 1, 215. [DOI] [PubMed] [Google Scholar]
- Scheraga H. A. Adv. Phys. Org. Chem. 1971, 71, 195. [Google Scholar]
- Vila J. A.; Ripoll D. R.; Scheraga H. A. Proc. Natl. Acad. Sci. U.S.A. 2003, 100, 14812. [DOI] [PMC free article] [PubMed] [Google Scholar]
- Ripoll D. R.; Vila J. A.; Scheraga H. A. J. Mol. Biol. 2004, 339, 915. [DOI] [PubMed] [Google Scholar]
- Vila J. A.; Ripoll D. R.; Arnautova Y. A.; Vorobjev Y. N.; Scheraga H. A. Proteins: Struct., Funct., Bioinf. 2005, 61, 56. [DOI] [PubMed] [Google Scholar]
- Abagyan R.; Totrov M. Curr. Opin. Chem. Biol. 2001, 5, 375. [DOI] [PubMed] [Google Scholar]
- Arnautova Y. A.; Abagyan R. A.; Totrov M. Proteins: Struct., Funct., Bioinf. 2010, 79, 477. [DOI] [PMC free article] [PubMed] [Google Scholar]
- Abagyan R.; Totrov M. J. Mol. Biol. 1994, 235, 983. [DOI] [PubMed] [Google Scholar]
- Cardozo T.; Totrov M.; Abagyan R. Proteins: Struct., Funct., Genet. 1995, 23, 403. [DOI] [PubMed] [Google Scholar]
- Abagyan R.; Batalov S.; Cardozo T.; Totrov M.; Webber J.; Zhou Y. Proteins: Struct., Funct., Genet. 1997, 29. [DOI] [PubMed] [Google Scholar]
- Totrov M.; Abagyan R. Biopolymers 2001, 60, 124. [DOI] [PubMed] [Google Scholar]
- Abagyan R. A.; Totrov M. J. Comput. Phys. 1999, 151, 402. [Google Scholar]
- Wormald M. R.; Petrescu A. J.; Pao Y. L.; Glithero A.; Elliott T.; Dwek R. A. Chem. Rev. 2002, 102, 371. [DOI] [PubMed] [Google Scholar]
- Guvench O.; Hatcher E. R.; Venable R. M.; Pastor R. W.; Mackerell A. D. J. Chem. Theory Comput 2009, 5, 2353. [DOI] [PMC free article] [PubMed] [Google Scholar]
- Palmer K. A.; Scheraga H. A. J. Comput. Chem. 1992, 13, 329. [Google Scholar]
- Némethy G.; Gibson K. D.; Palmer K. A.; Yoon C. N.; Paterlini G.; Zagari A.; Rumsey S.; Scheraga H. A. J. Phys. Chem. 1992, 96, 6472. [Google Scholar]
- Head-Gordon M.; Pople J. A.; Frisch M. J. Chem. Phys. Lett. 1988, 153, 503. [Google Scholar]
- Frisch M. J.; Head-Gordon M.; Pople J. A. Chem. Phys. Lett. 1990, 166, 275. [Google Scholar]
- Schmidt M. W.; Baldridge K. K.; Boatz J. A.; Elbert S. T.; Gordon M. S.; Jensen J. H.; Koseki S.; Matsunaga N.; Nguyen K. A.; Su S.; Windus T. L.; Dupuis M.; Montgomery J. A. Journal of computational chemistry 1993, 14, 1347. [Google Scholar]
- Gordon M. S.; Schmidt M. W.. ″Theory and Applications of Computational Chemistry: the first forty years″; Dykstra C. E., Frenking G., Kim K. S., Scuseria G. E. (editors), Elsevier, Amsterdam, 2005, 1167. [Google Scholar]
- Abagyan R.; Totrov M.; Kuznetsov D. J. Comput. Chem. 1994, 15, 488. [Google Scholar]
- Allen F. H.; Fortier S. Acta Crystallogr., Sect. B: Struct. Sci. 1993, 49, 1021. [Google Scholar]
- Allen F. H.; Doyle M. J.; Taylor R. Acta Crystallogr., Sect. B: Struct. Sci. 1991, 47, 50. [Google Scholar]
- Allen F. H. Acta Crystallogr., Sect. B 2002, 58, 380. [DOI] [PubMed] [Google Scholar]
- Metropolis N. A.; Rosenbluth A. W.; Rosenbluth N. M.; Teller A. H.; Teller E. J. Chem. Phys. 1953, 21, 1087. [Google Scholar]
- Lutteke T.; Frank M.; von der Lieth C. W. Nucleic Acids Res. 2005, 33, D242. [DOI] [PMC free article] [PubMed] [Google Scholar]
- Woods R. J.; Pathiaseril A.; Wormald M. R.; Edge C. J.; Dwek R. A. Eur. J. Biochem. 1998, 258, 372. [DOI] [PubMed] [Google Scholar]
- Petrescu A. J.; Milac A. L.; Petrescu S. M.; Dwek R. A.; Wormald M. R. Glycobiology 2004, 14, 103. [DOI] [PubMed] [Google Scholar]
- Thibaudeau C.; Stenutz R.; Hertz B.; Klepach T.; Zhao S.; Wu Q.; Carmichael I.; Serianni A. S. J. Am. Chem. Soc. 2004, 126, 15668. [DOI] [PubMed] [Google Scholar]
- Li Z.; Scheraga H. A. Proc. Natl. Acad. Sci. U.S.A. 1987, 84, 6611. [DOI] [PMC free article] [PubMed] [Google Scholar]
- Sattelle B. M.; Almond A. Carbohydr. Res. 2014, 383, 34. [DOI] [PMC free article] [PubMed] [Google Scholar]
- Larsson E. A.; Staaf M.; Söderman P.; Höög C.; Widmalm G. J. Phys. Chem. A 2004, 108, 3932. [Google Scholar]
- Dabrowski J.; K T.; Grosskurth H.; Nifant’ev N. E. J. Am. Chem. Soc. 1995, 117, 5534. [Google Scholar]
- Dixon A. M.; Venable R.; Widmalm G.; Bull T. E.; Pastor R. W. Biopolymers 2003, 69, 448. [DOI] [PubMed] [Google Scholar]
- Hoog C.; Landersjo C.; Widmalm G. Chemistry 2001, 7, 3069. [DOI] [PubMed] [Google Scholar]
- Landersjö C.; Stenutz R.; Widmalm G. J. Am. Chem. Soc. 1997, 119, 8695. [Google Scholar]
- Dabrowski J.; Kozar T.; Grosskurth H.; Nifant’ev N. E. J. Am. Chem. Soc. 1995, 117, 5534. [Google Scholar]
- Davis A. P.; Wareham R. S. Angew. Chem., Int. Ed. 1999, 38, 2978. [PubMed] [Google Scholar]
- Boraston A. B.; Bolam D. N.; Gilbert H. J.; Davies G. J. Biochem. J. 2004, 382, 769. [DOI] [PMC free article] [PubMed] [Google Scholar]
- Sorme P.; Arnoux P.; Kahl-Knutsson B.; Leffler H.; Rini J. M.; Nilsson U. J. J. Am. Chem. Soc. 2005, 127, 1737. [DOI] [PubMed] [Google Scholar]
Associated Data
This section collects any data citations, data availability statements, or supplementary materials included in this article.


