

Abstract
Cadmium (Cd) is a non-essential heavy metal, which is classified as a “known human carcinogen” by the International Agency for Research on Cancer (IARC). Understanding the mechanisms controlling Cd distribution in planta is essential to develop phytoremediation approaches as well as for food safety. Unlike most other plants, tobacco (Nicotiana tabacum) plants translocate most of the Cd taken up from the soil, out of the roots and into the shoots, leading to high Cd accumulation in tobacco shoots. Two orthologs to the Arabidopsis thaliana HMA2 and HMA4 Zn and Cd ATPases that are responsible for zinc (Zn) and Cd translocation from roots to shoots were identified in tobacco and sequenced. These genes, named NtHMAα and NtHMAβ, were more highly expressed in roots than in shoots. NtHMAα was expressed in the vascular tissues of both roots and leaves as well as in anthers. No visual difference was observed between wild-type plants and plants in which the NtHMAα and NtHMAβ genes were either mutated or silenced. These mutants showed reduced Zn and Cd accumulation in shoots as well as increased Cd tolerance. When both NtHMA genes were silenced, plant development was altered and pollen germination was severely impaired due to Zn deficiency. Interestingly, seeds from these lines also showed decreased Zn concentration but increased iron (Fe) concentration.
Keywords: amiRNA, biotechnology, Cadmium, EMS-mutagenized lines, GUS staining, Heavy metal, Heavy Metal ATPAses, metal repartition, NtHMAα, NtHMAβ, pollen, pollen germination, seed, seed metal concentration, silencing, SXRF, tolerance, toxicity, zinc
Introduction
Many metals and metalloids are essential for plant and animal development. For example, zinc (Zn) is a cofactor in more than 300 plant enzymes, including carbonic anhydrase, RNA polymerase, Zn-superoxide dismutase and alcohol dehydrogenase, all of which are key enzymes for plant survival.1 However, both metals and metalloids are toxic in excess.
Cadmium (Cd) is one of the few metals for which there is no reported beneficial effect for plant or human development. It is classified in Group 1 (known human carcinogen) by the International Agency for Research on Cancer (IARC). It has been hypothesized that Cd circulates in plants by co-opting transporters of other divalent metals.2 Accumulated in excess, Cd triggers many deleterious effects on plants such as a reduction in leaf surface, dry weight, water content, chlorophyll content, and carotenoid content, as well as an increase in protease activity.3 Cd toxicity is also due to the similarity (in terms of size and charge) between this element and other metals such as Zn, iron (Fe) and calcium (Ca). Cd causes toxicity by mimicking these elements, and replacing them in compartments that normally do not contain Cd. Another explanation for Cd toxicity could be the association of Cd with proteins which are essential for plant survival.4 Cd can be accumulated in plants at levels that do not trigger any symptom of toxicity in the plant but can be toxic upon human consumption.
One way Cd enters the human body is by ingestion of Cd-contaminated food. However, inhalation of smoke from cigarettes is a far more effective uptake route than absorption through the gastrointestinal tract. Smoker’s blood-Cd content is 4 to 5 times higher than non-smokers.5 Exposure to Cd induces damage in bones, lungs and liver. Cd has also been reported to deregulate hormone balance leading to spontaneous abortion.6 It is thus of interest that tobacco plants accumulate less cadmium in the leaves so that less cadmium would be found in the smoke of cigarettes. Tobacco is a plant species characterized by an ability to accumulate four times higher levels of Cd in the shoots than in the roots.7 By comparison, Cd concentration in Arabidopsis thaliana is approximately two fold higher in roots compared to shoots8 and Cd concentration in the cadmium hyper accumulator species Arabidopsis halleri is similar in roots and in shoots.9
Previous attempts to reduce the Cd concentration of tobacco leaves were based on the expression of transgenes. For example, reducing the accumulation of Cd in shoots has been achieved by sequestering Cd in root vacuoles. This was accomplished by over-expressing the A. thaliana CAX2 and CAX4 Ca and manganese (Mn) vacuolar transporters in tobacco roots10. The same result had previously been reported with transgenic tobacco plants expressing a human metallothionein.11,12 The role of plant metallothioneins is still unclear but animal metallothioneins were shown to chelate Cd and modify its distribution within cells and organs.13
The recent knowledge gained about the transport of metals between organs, cells or subcellular compartments in model plants opens an avenue to develop a non-GMO approach to reduce Cd accumulation in tobacco leaves. In A. thaliana only one transporter, IRT1, has to-date been identified as responsible for Cd uptake into roots. IRT1 is a Fe transporter also responsible for the uptake of many other essential metals such as Zn or Mn.14 In the roots, Cd diffuses through the symplasm to reach the vascular tissue. There, it can be loaded into the xylem by HMA2 and HMA4, two Zn and Cd ATPases.15,16,8 Transpiration then drives the translocation of Cd from the roots to the shoots. In shoot and root cells, Cd can be transported to the vacuole by the CAX2 and CAX4 Mn and Ca transporters17 or the HMA3 Cd and lead (Pb) transporter.18 In addition to Fe and Mn, NRAMP3, NRAMP4 and NRAMP6 can transport Cd out of the vacuole.19,20 Phytochelatins also play an important role in Cd distribution. They are capable of chelating Cd and facilitating its transport into cell vacuoles.21
Several of the above-mentioned transporters could be good targets to develop tobacco lines with reduced Cd accumulation in the shoots through gene inactivation. However, the genome of tobacco is still unavailable and tobacco orthologues to these transporters cannot be easily identified from the tobacco raw sequences available in public databases.
Working on orthologues of AtHMA2 and AtHMA4 seems particularly wise since the inactivation of these genes led to an almost complete suppression of Cd translocation from the roots to the shoot in Arabidopsis thaliana8. The athma2 athma4 double mutant also showed enhanced sensitivity to cadmium whereas lines overexpressing AtHMA4 were more resistant to cadmium and zinc and translocated both metals more efficiently from roots to shoots.16 Interestingly, Arabidopsis plants mutated in either AtHMA2 or AtHMA4 present normal development, but when both genes are mutated development is impaired and fertility is reduced.15
Orthologs of AtHMA2 and AtHMA4 have already been identified and characterized in a crop, namely rice. In rice, OsHMA2 has been shown to be particularly important for Zn and Cd transport to the shoot and for Zn distribution to the reproductive tissues.22 Reducing the accumulation of HMA protein has recently been proposed as a strategy to reduce Cd content in rice grain.23 No similar information has to-date been available concerning the tobacco orthologs of AtHMA2 or AtHMA4.
The goal of the present work was thus to investigate the effects of altering the expression of the tobacco orthologs of AtHMA2 and AtHMA4 and test the possibility of using this approach to obtain tobacco lines with reduced Cd levels in the leaves. The genome of tobacco has not been fully sequenced yet. Tobacco is an allopolyploid (2n = 4x = 48) whose genome originates from the fusion of the ancestral genomes of Nicotiana tomentosiformis (2n = 2x = 24) and Nicotiana sylvestris (2n = 2x = 24).24 The genome of tobacco is 0.2 Myr old; most genes are still present in 2 copies, originating each from one of the two ancestors.25 Two NtHMA genes were identified from the screening of a bacterial artificial chromosome (BAC) library that we constructed from N. tabacum genomic DNA. The role of the two newly identified NtHMA genes was investigated using plants harboring stop or missense mutations in these genes, as well as using plants expressing artificial microRNA (amiRNA) constructs. Contributions of the NtHMA genes to Cd and Zn accumulation in the shoots, to Cd and Zn tolerance and to plant development and fertility were examined.
Results
Identification of tobacco homologs to AtHMA2 and AtHMA4
Using Southern hybridization Tobacco homologs of AtHMA2 and AtHMA4 were identified by screening a tobacco genomic BAC library that we constructed for that purpose. This BAC clone library represents 4 times the N. tabacum genome. Positive BAC clones were sequenced. Only two different members of the heavy metal ATPase family were identified and named NtHMAα and NtHMAβ. Their cDNAs were also cloned, indicating that the two genes are expressed. The sequences that we obtained were used as baits to screen for similar sequences among the available tobacco database. No other similar sequence was found. We thus consider that NtHMAα and NtHMAβ are the only two N. tabacum orthologs to AtHMA2 and AtHMA4.
The two genes are very long, the ATG initiation codon and the stop codon being separated by approximately 16.5 kb in the genome. The encoded proteins have 1402 amino acids (a.a.) for NtHMAα and 1444 a.a. for NtHMAβ, compared to 1172 a.a. for AtHMA4. They are very similar to each other, showing 93% a.a. identity over the whole protein. The promoter regions of NtHMAα and NtHMAβ were also very similar (~90% sequence identity on 1.75kb), except for the insertion/deletion of a defective 700bp transposable element 200bp upstream of the ATG initiation codon of NtHMAβ. Major differences were in contrast observed within the introns mainly due to numerous large insertions/deletions.
The genome sequences of N. sylvestris, N. tomentosiformis and N. benthamiana have very recently been released in public databases.26,27 Comparisons between the NtHMAα and NtHMAβ genomic sequences and the genomic sequences of these Nicotianeae clearly revealed that there is only one ortholog to the NtHMA genes in each of their genomes. Focussing on N. sylvestris and N. tomentosiformis, which are the two ancestors of tobacco, we observed that NtHMAα is more closely related to the N. sylvestris copy (99% nucleic acid identity, including in non-coding sequences) and NtHMAβ to the N. tomentosiformis one (98% nucleic acid identity, including in non-coding sequences).
NtHMAα and NtHMAβ are not highly similar to their A. thaliana homologs. The intron-exon organization is similar in the first part of the gene. However, the last exon of the AtHMAs is split into three separate exons in the tobacco HMAs (Sup. fig. 1A). The NtHMAα and NtHMAβ proteins only show approximately 65% amino acid similarity with their A. thaliana homologs, and this similarity is only found in the first part of the protein, which correspond the transmembrane domain (Sup. fig. 1B). In the second part of the protein, which encodes a cytosolic C-terminal tail, the similarity between the tobacco and the AtHMAs decreases to less than 40%. Previous publications have shown that this cytoplasmic tail plays an important role for the activity of the protein.8,28 Interestingly, the C-terminal tails of NtHMAα and NtHMAβ are much longer (704 and 746 a.a., respectively) than those of AtHMA2 and AtHMA4 (267 and 470 a.a., respectively) and possess 11 and 13 cysteines present in tandem, respectively. The stretch of histidines located at the C-terminal end of the AtHMA2 and AtHMA4 proteins (3 and 11 histidines, respectively) is lacking in NtHMAα and NtHMAβ. The long C-terminal tails of NtHMAα and NtHMAβ are also found, with >99.5% amino acid identity, in the N. sylvestris and N. tomentosiformis respective homologs (711 and 728 a.a., respectively). Interestingly, a long C-terminal tail was also found in the N. benthamiana (788 a.a. and 13 cystein tandems) ortholog of NtHMAs and to a lesser extent as well as with much greater sequence divergence in the single Solanum lycopersicum ortholog of NtHMAs (601 a.a., 9 cysteine tandems).
Zn and Cd HMA transporters are also characterized by specific amino acid motifs, which include the GICCTSE metal binding domain present on the N-terminal tail of the protein, the DKTGT P-domain motif located in the third cytosolic loop and the CPx/SPC motif located in the sixth transmembrane domain.29,30 All these motifs are present in AtHMA2, AtHMA4, NtHMAα and NtHMAβ (Sup. fig. 2).
A phylogenetic analysis performed with several HMA proteins, considering their entire N-terminal moiety which comprises all the transmembrane domains (Fig. 1), clearly showed that NtHMAα and NtHMAβ belong to the P1B ATPase clade gathering Zn, Cd and Pb ATPases. Within this clade, they belong to a sub-clade gathering Solanaceae sequences, which is distinct from subclades gathering Brassicaceae or Poaceae sequences. Thus no clear and direct orthologous relationship could at this stage be established between NtHMAα and NtHMAβ and the A. thaliana or rice HMAs for which functions have already been ascribed. Within the Solanaceae sub-clade only tobacco has two members of the Zn, Cd and Pb ATPases family. Analyses of sequence similarities revealed that the S. lycopersicum copy was closer to NtHMAα and NsylHMA4 than to NtHMAβ and NtomHMA4 while the N. benthamiana copy was closer to NtHMAβ and NtomHMA4 than to NtHMAα and NsylHMA4.
Figure 1. Phylogenetic analysis of HMA genes.
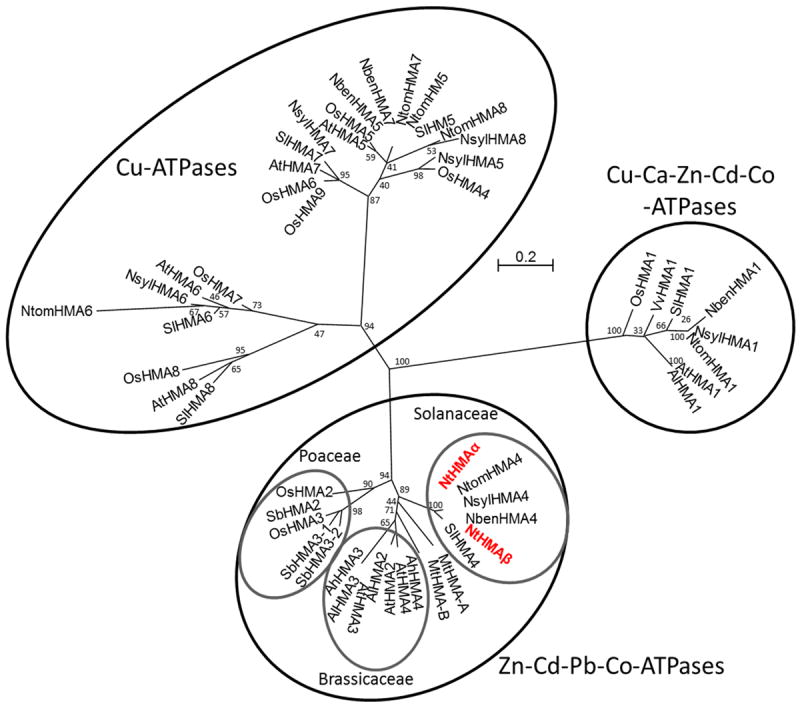
Protein sequences encoded by the first 8 exons were aligned using the Muscle algorithm and the phylogenetic tree was constructed using the Maximum Likelihood method from G-blocks distributed along the sequence. Bootstrap values were obtained using 1000 replicates and are indicated before each embranchment of the phylogenetic tree. The tree is drawn to scale, with branch length corresponding to the number of amino acid substitutions per site. Ah = Aribopsis halleri; Al = Arabidopsis lyrata; At = Arabidopsis thaliana; Mt = Medicago truncatula; Nben = Nicotiana benthamiana; Nsyl = Nicotiana sylvestris; Ntom = Nicotiana tomentosiformis; Os = Oryza sativa; Sb = Solanum tuberosum; Sl = Solanum lycopersicum; Vv = Vitis vinifera. HMA protein sequences from Arabidopsis and their identified orthologs in other species were retrieved from online databases: AhHMA3 (AJ556182) and AhHMA4 (EU382072), AlHMA1 (XM_002866914), AlHMA2 (XM_002867321), AlHMA3 (XM_002867320), AtHMA1 (NM_119890), AtHMA2 (AY434728), AtHMA3 (AY055217), AtHMA4 (AF412407), AtHMA5 (Q9SH30), AtHMA6 (Q9SZC9), AtHMA7 (Q9S7J8), AtHMA8 (B9DFX7), MtHMA-A (AC130275), MtHMA-B(135313) NbenHMA4 (Nbv3K585727037), OsHMA1 (NM_001064952), OsHMA2 (HQ646362), OsHMA3 (AB557931), SbHMA2 (XM_002438908), SbHMA3-1 (XM_002459533), SbHMA3-2 (XM_002459534), SlHMA4 (XP_004242843), VvHMA1 (XM_002278513). TBLASTX analysis led to the identification of the sequences of the SlHMA (AEKE02004109), NsylHMA (ASAF01121754), NtomHMA (ASAG01036389 and ASAG01036390) and NbenHMA homologs.
NtHMAα and NtHMAβ are mainly expressed in roots and their level of expression is stable over a wide range of Cd and Zn concentrations in the culture medium
Using quantitative PCR analysis, transcripts of both NtHMAα and NtHMAβ were shown to be mainly accumulated in roots, although they could also be detected in shoots (Fig. 2A). This was a similar situation as for AtHMA2 and AtHMA416 or AhHMA4-2.9 The NtHMAα and NtHMAβ transcript levels were comparable to each other, both in roots and shoots.
Figure 2. Accumulation of NtHMAα and NtHMAβ transcripts.
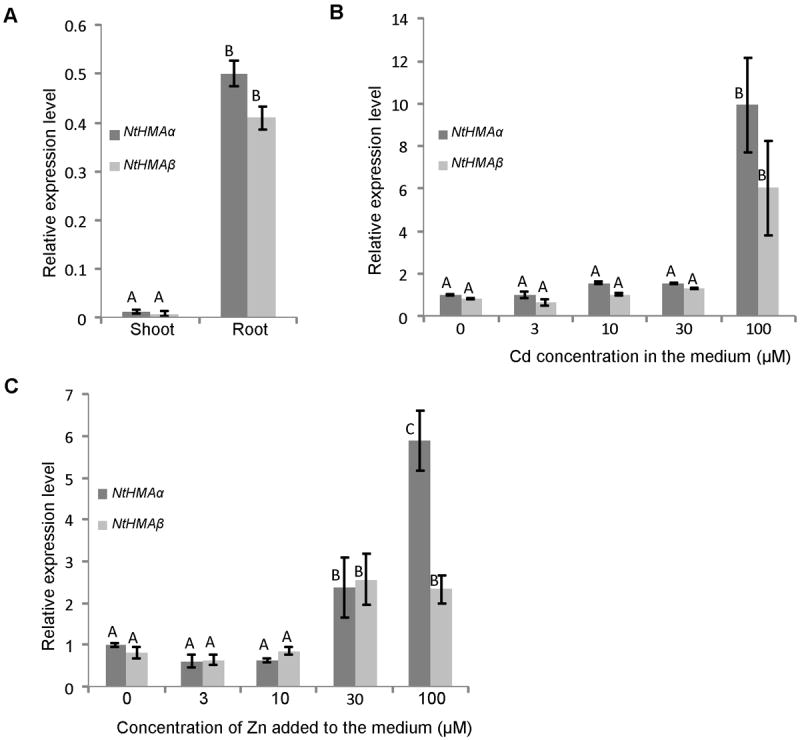
Transcript accumulation in roots and shoots of plants grown for five weeks in hydroponics in control conditions (A) or in roots of plants treated one week before sample collection with different CdCl2 (B) or ZnCl2 (C) supplementation. Transcript accumulation was determined for at least three independent plants using quantitative PCR with three technical replicates for each plant. NtHMAα and NtHMAβ transcript levels were normalized by comparison with transcripts of the ribosomic protein L2 and cyclophilin. Error bars represent standard error and the letters represent different statistical groups based on a Student t test.
When plants were exposed to moderate concentrations of Cd or Zn (0 to 10 μM) no visible impact on the growth of the plants and no modification of NtHMAα and NtHMAβ transcript accumulation could be observed (Fig. 2B, 2C). The accumulation of the transcripts of both genes was increased only when much higher concentrations of Cd or Zn (100 μM of Cd or 30-100 μM of Zn) were applied. Applying these high Zn or Cd treatments in hydroponic conditions was toxic for the plants. The 100 μM Cd treatment induced necroses in the leaf lamina while the 30-100 μM Zn treatments induced chlorosis around the main vein (data not shown).
NtHMAα is expressed in root vascular cells, leaf veins and anthers
To further analyze the expression pattern of NtHMAα, a promoter∷GUS fusion was constructed. A 3-kb-long region upstream the NtHMAα ATG initiation codon was cloned immediately upstream of the GUS coding sequence and introduced in wild-type tobacco. NtHMAα appeared to be expressed in the vascular tissues in roots, more precisely in xylem parenchyma cells (Fig. 3A to 3D). Interestingly, expression of NtHMAα could be detected in young roots but not in older ones. Expression of NtHMAα could also be detected around the primary, secondary and tertiary veins in leaves (Fig. 3E). This pattern was however only observed in young leaves (about 4 cm in length). Two- to four-week-old leaves only showed NtHMAα expression in tertiary veins (Fig. 3F) and even older leaves did not show any detectable level of NtHMAα expression (data not shown). Finally, expression of NtHMAα could also be observed in anthers (Fig. 3G). According to the analysis of transversal sections, the coloration was specific to the anther itself and was not found in the pollen (Fig. 3H).
Figure 3. Spatial localization of the expression of NtHMAα.
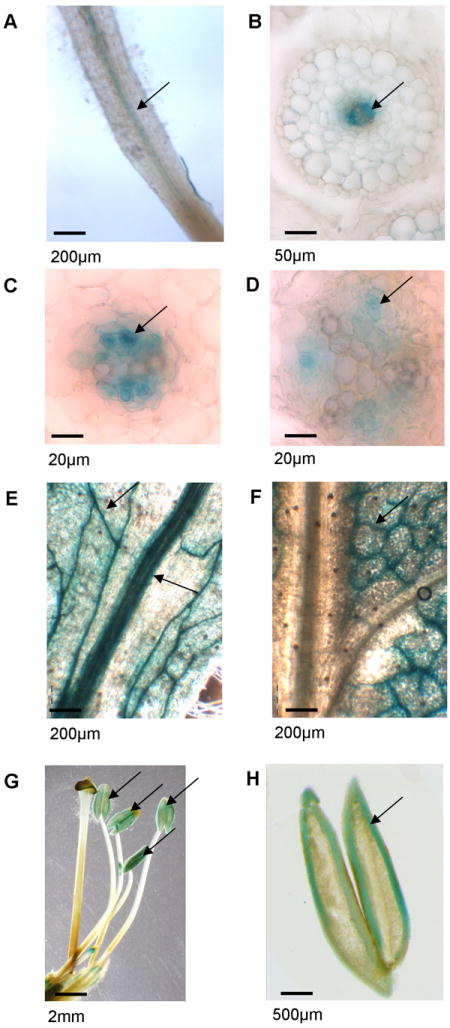
GUS expression was monitored in transgenic plants expressing the GUS reporter gene under the control of a sequence corresponding to a 3kb region upstream of the start codon of NtHMAα. Arrows point to where the staining was observed. (A-B-C-D) Blue staining observed in the root stele (A), and more precisely in the xylem parenchyma cells (B-C-D). (E-F) Blue staining observed in leaf veins. The staining was observed in the primary vein when the leaves were young (~3 cm in length) (E) but it was only visible in tertiary veins when the leaves were getting older (F). (G-H) blue staining was also observed in anthers (G) but not in the pollen as shown in the longitudinal section (H). The bar present at the bottom left corner of each picture represents the scale. The images correspond to three-week-old plants cultivated on solidified MS media in Petri dishes except for anthers, which were obtained from plants grown in the greenhouse.
This localization of the expression of NtHMAα is similar to what has been obtained for AtHMA416 and AhHMA49, at least as far as roots and leaves are concerned.
Assessing the role of NtHMAα and NtHMAβ in planta
In order to assess the role of the NtHMA genes in tobacco, two strategies were employed to either silence or reduce the activity of NtHMAs. The first strategy aimed at identifying tobacco lines harboring a mutation in either one of the NtHMA genes. This was achieved by screening an EMS (Ethyl methanesulfonate)-mutagenized mutant collection using CE-SSCP (Capillary Electrophoresis-Single Strand Conformation Polymorphism)31, a PCR-based technique. Several missense mutations as well as one nonsense mutation were detected in each of the two genes (Supplementary Table S1). All these mutations altered amino acids present in the third cytosolic loop of the HMA protein. The second strategy aimed at silencing the NtHMA genes by expressing artificial micro RNAs (amiRNAs)32 in transgenic tobacco plants. The constructs were designed either to specifically inactivate one of the NtHMA transcripts, or to simultaneously inactivate the two transcripts (Sup Table S1). Up to 10 independent transformants were regenerated for each of the amiRNA constructs. For each construct, the three transgenic lines showing the highest and most specific reduction of NtHMA transcript level in roots were selected using quantitative PCR. None of the transgenic lines showed a complete silencing of the NtHMA genes. The transgenic plants expressing the amiRNA construct designed to target both NtHMAα and NtHMAβ displayed a high degree of silencing of both genes (Sup. Fig. S3). With the amiRNA construct designed to specifically target one of the NtHMA (e.g. NtHMAα), it was possible to reduce the level of the targeted transcripts without significantly altering the level of the other transcripts (in the case of NtHMAβ, P=0.35).
The growth and development of all the mutant and silenced lines in which only one of the NtHMA genes was targeted was comparable to that of the wild type. In contrast, the lines in which the two NtHMA genes were silenced displayed top leaves that were slightly distorted and capsules that were significantly smaller (Sup. fig. S4A and S4B). Lines with a nonsense mutation in both NtHMAα and NtHMAβ were obtained by crossing. In the F2 progeny, a shift in the segregation was observed with fewer double homozygous mutants than expected (data not shown). In addition, plants harboring a nonsense mutation in both NtHMA genes displayed a dwarf phenotype and could not complete their life cycle (Sup. fig. S4C). This shows that a minimum level of NtHMA activity is needed for plant survival and that NtHMAα and NtHMAβ are functionally redundant.
NtHMAα and NtHMAβ are redundantly involved in the translocation of Cd from the roots to the shoots
When grown on MS plates in the presence of 1 μM Cd, both the HMA-silenced lines and the mutant lines exhibited ~50% reduction in Cd accumulation in the shoots (Fig. 4A) suggesting that the missense and nonsense mutations had a similar impact on the function of the protein. The greatest reduction of shoots Cd concentration (~80%) was obtained when the two NtHMA genes were silenced. These results clearly indicate that the two NtHMA genes play a role in Cd accumulation in the shoots and that they are at least partially redundant for this function.
Figure 4. Cadmium and zinc accumulation in shoots.
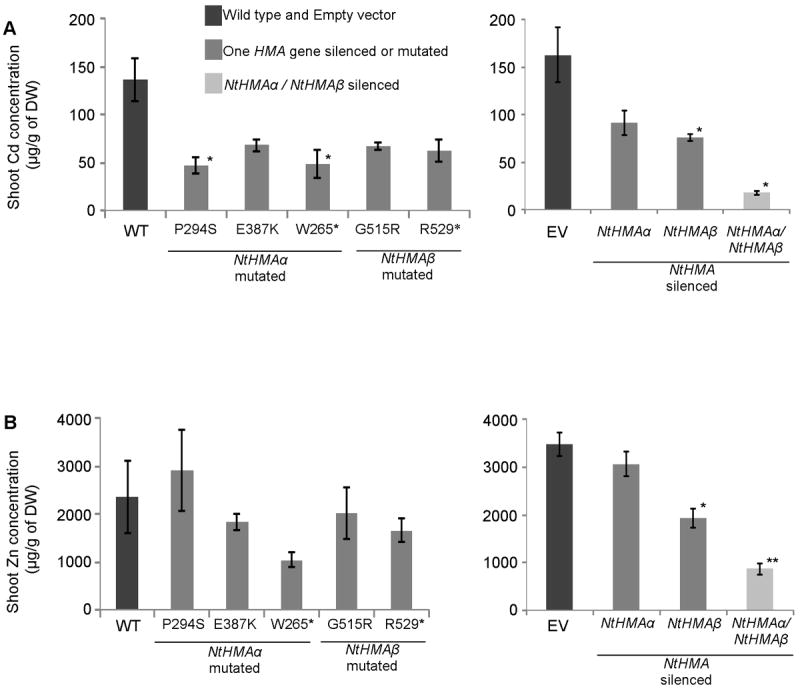
Cd (A) and Zn (B) accumulation in the shoot of five-week-old plants was measured by ICP-MS. Mutants (left) and silenced lines (right) with their corresponding control were grown on MS media in the presence of CdCl2 at the final concentration of 1 μM in the culture medium. At least 3 independent plants were analyzed for each genotype. Error bars represent standard error. * : P < 0.05, compared to the wild type. WT = wild type; EV = transgenic plants harboring an empty vector.
NtHMA-silenced lines and Nthma mutant lines are more tolerant to Cd than the wild type
The contribution of the NtHMA genes to Cd and Zn tolerance was assessed by growing the silenced lines as well as the EMS-induced mutant lines on plates in MS media supplemented by up to 400μM of Cd or Zn. The silenced and mutant lines responded as the wild type to the presence of high concentrations of Zn in the medium (data not shown). In contrast, they were more tolerant to Cd than the wild type, as deduced from the analysis of root growth (Fig. 5). Interestingly, lines in which both of the NtHMA genes were silenced displayed even longer roots than lines in which only one of the NtHMA genes was inactivated (Fig. 5A). This again suggests a partial functional redundancy between NtHMAα and NtHMAβ. In response to Cd, leaves of the silenced and mutant plants were less chlorotic than leaves of wild-type plants. This was particularly clear for the line in which the two NtHMA genes were silenced (Fig. 5B) thus suggesting that protecting the shoots from Cd over-accumulation increased Cd tolerance in tobacco.
Figure 5. Cadmium tolerance analysis.
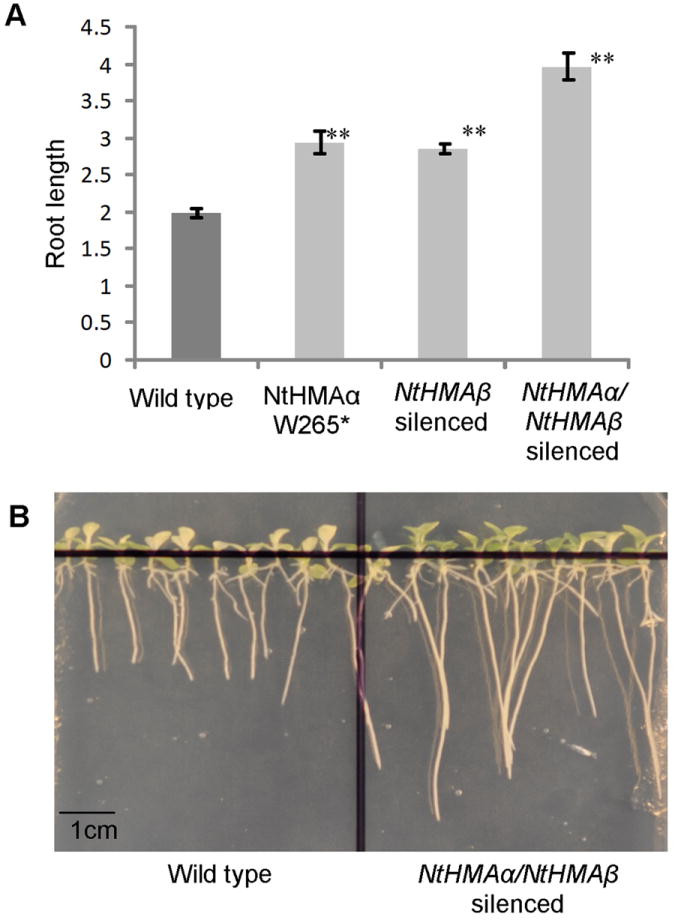
(A) Root length of four-week-old plants grown on plates on MS media in the presence of a CdCl2 concentration of 100 μM. At least 5 plants were used for each genotype. Error bars represent standard error. ** = P < 0.005 compared to the wild type. (B) Picture of four-week-old wild-type and NtHMAα/NtHMAβ-silenced plants grown on a plate in the presence of 100 μM of CdCl2.
Contribution of NtHMAα and NtHMAβ to the accumulation of Zn and Fe
Zn concentration was analyzed in the NtHMA-silenced plants. Silencing each of the NtHMA genes as well as silencing both copies resulted in decreased Zn concentration in the shoots (Fig. 4B).
The NtHMAα/NtHMAβ-silenced lines exhibited a reduced number of seeds per capsule and a reduced ability of the seeds to germinate (Fig. 6A and 6B). To check whether this difference was correlated with metal concentration and/or metal compartmentalization changes in the seed, elemental composition was analyzed using synchrotron X-ray fluorescence mapping (SXRF) and Inductively coupled plasma-mass spectroscopy (ICP-MS) (Sup. fig. S5).
Figure 6. Effect of silencing the NtHMA genes on seeds.
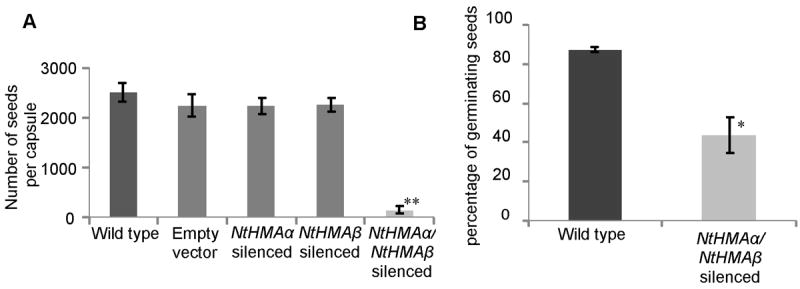
(A) Number of seeds per capsule obtained after selfing. Wild-type plants and plants transformed with an empty vector are shown as controls in comparison to plants expressing an amiRNA construct targeting either NtHMAα or NtHMAβ or both genes. For plants in which both NtHMA genes were silenced, self-pollination was performed manually using the pollen of 3 different flowers from the same plant for no seed could be obtained with natural self-pollination. Five capsules from 5 different plants were used (B) Efficiency of germination of seeds originating from wild-type and NtHMAα/NtHMAβ-silenced plants (n=3). Error bars represent standard error.
For the SXRF analysis, two sets of seeds originating from two different capsules were analysed. Only the first set of seeds appeared to contain mature embryos (Sup. fig. S5A) suggesting that part of the seeds expressing the amiRNA construct targeting both NtHMA genes are unable to mature properly. From the SXRF analysis of mature seeds, the distribution of Zn and Fe within the seed seemed to be comparable for the NtHMAα/NtHMAβ-silenced seeds and the wild type. In particular, Fe was distributed mainly in the cotyledons (66% of total embryo Fe concentration) compared to in the radicle (34% of total embryo Fe concentration). This distribution differs from what had been observed for Arabidopsis seeds in which approximately 60% of the seed Fe is found within organelles of the endodermal cells of the radicle and around the vasculature of the cotyledons.33
Quantification of the fluorescence signal from the SXRF analysis indicated that zinc concentration is reduced in the silenced line compared to wild type whereas iron concentration is increased (Sup. fig. S5B). We were able to confirm the increase in iron concentration using ICP-MS analysis (Sup. fig. S5C) but results were inconsistent for zinc as ICP-MS analysis suggested an increase in zinc concentration (Sup. fig. S5D). One possible explanation could be that SXRF allowed us to selectively analyse mature seeds expressing the amiRNA construct whereas ICP-MS analysis was performed on approximately 100mg of a mix of mature and aborted seeds, some of the latter being able to accumulate very high amounts of zinc with respect to their reduced mass (Sup. fig. S5A, S5B).
Pollen germination is reduced in NtHMA-silenced lines
As mentioned above, plants harboring nonsense mutations in both NtHMAα and NtHMAβ were dwarf when grown on soil (Sup. fig. S4A) and were unable to produce seed. In contrast, transgenic plants expressing amiRNA constructs leading to a reduction of the expression of both NtHMA genes were still able to grow and produce seed, although the seed production was very low and occurred only when pistils were hand-pollinated (Fig. 6A). The phenotypic difference between the Nthmaα/Nthmaβ double mutant lines and the NtHMAα/NtHMAβ-silenced lines is likely due to the fact that the function of the NtHMA genes is most likely entirely lost in the double mutant lines, whereas expression of NtHMAα and NtHMAβ was not completely abolished in the HMA-silenced lines (Sup. fig. S3). Partial expression of functional HMA gene is therefore required and sufficient for plant development.
The number of seeds in capsules of the NtHMAα/NtHMAβ-silenced lines was greatly reduced compared to the wild type or to lines in which only one of the two NtHMA genes was silenced (Fig. 6A). This was caused by a defect of the pollen. Indeed, pollinating the NtHMAα/NtHMAβ-silenced lines with wild-type pollen led to the production of capsules of a normal size harboring a normal quantity of seeds while pollinating wild-type pistils with pollen from NtHMAα/NtHMAβ-silenced lines resulted in the production of capsules of very small size harboring a reduced number of seeds (Sup fig S4B). The origin of the pollen defect was neither the amount of pollen nor its viability, which were both similar for the NtHMAα/NtHMAβ-silenced lines and the wild type (Fig. 7A).
Figure 7. Effect of NtHMA gene silencing on pollen.
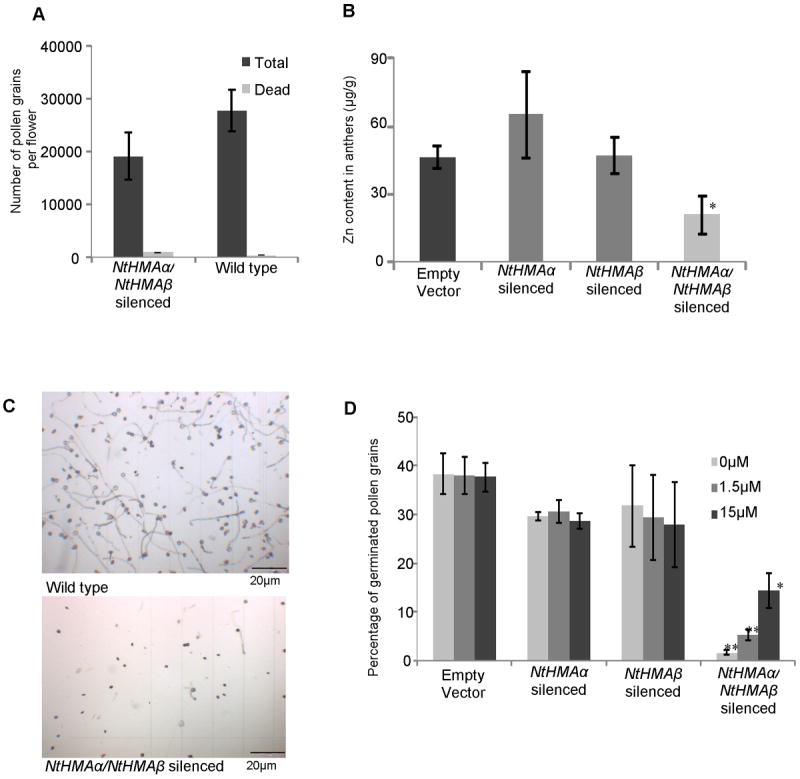
(A) Total number of pollen grains and number of dead pollen grains (as determined by Alexander’s staining) per flower. (B) Zinc concentration in anthers of plants originating from different genotypes. (C) Pictures of pollen isolated from wild-type and NtHMAα/NtHMAβ-silenced plants taken after 5 hours of incubation in germination solution. (D) Pollen germination in media supplemented with 0 to 15 μM of ZnCl2. (A-B-D) At least 3 different plants were analyzed for each line. For each plant, the anthers from 3 different flowers were collected. Error bars represent standard errors. *: P < 0.05 ; ** : P < 0.005, compared to the wild type.
Zn concentration was reduced in the anthers of NtHMAα/NtHMAβ-silenced lines (Fig. 7B) and the pollen exhibited a reduced ability to germinate compared to the wild-type pollen (Fig. 7C). This reduced ability to germinate could at least partially be alleviated when Zn was added to the germination medium (Fig. 7D), thus indicating that Zn is required for pollen germination. These results can be connected to the observation that Zn accumulation was reduced in anthers of the NtHMAα/NtHMAβ-silenced lines compared to in wild-type anthers (Fig. 7B), which may explain the Zn deficiency of pollen produced by NtHMAα/NtHMAβ-silenced lines.
Discussion
In this work, we were interested in identifying and characterizing genes controlling Cd accumulation in leaves of tobacco plants. Attention was drawn to Zn-Cd Heavy Metal ATPases, which have previously been shown to control this character in A. thaliana and rice.8,34,35 Two tobacco orthologs to AtHMA2 and AtHMA4, NtHMAα and NtHMAβ, were newly identified. As detailed above, our results strongly suggest that NtHMAα and NtHMAβ are the only two N. tabacum orthologs to AtHMA2 and AtHMA4. This is not surprising since only one ortholog to the sub-cluster formed by AtHMA2, AtHMA3 and AtHMA4 has been found in the sequenced genomes of diploid Solanaceae such as S. lycopersicum, N. benthamiana, N. sylvestris and N. tomentosiformis, the latter two being the parents of the N. tabacum amphiploid. Interestingly, the NtHMAα and NtHMAβ copies could be tracked back in the N. sylvestris and N. tomentosiformis genomes, clearly supporting the hypothesis that each of them was originating from one of these parents.
NtHMAα and NtHMAβ are likely to share similar functions as AtHMA2 and AtHMA4
Although the phylogenetic analysis showed that the tobacco HMAs were located in a different phylogenetic clade compared to the A. thaliana or rice HMAs, phenotypic data indicated that their role is similar to the role of AtHMA2, AtHMA4 or OsHMA2. Nthmaα/Nthmaβ double mutant plants displayed a similar dwarf phenotype as Athma2/Athma4 double mutant plants. The expression pattern of the tobacco genes was very similar to that of the A. thaliana ones. More importantly, mutations in NtHMAα or NtHMAβ led to reduced accumulations of Cd in shoots in a similar manner to what has been described for AtHMA2, AtHMA4 or OsHMA2. Altogether, these results suggest that NtHMAα and NtHMAβ control Cd (and Zn) translocation from the roots to the shoot in tobacco and that this function would be a result of their contribution to the loading/unloading of Cd (and Zn) in the xylem vessels. It has already been proposed that in tobacco, roots control the amount of Cd translocated to the shoot and that xylem loading is the limiting step in this regard.36
NtHMAα and NtHMAβ share partially redundant functions
N. tabacum is a 0.2-Myr-old allopolyploid (2n = 4x = 48) resulting from the fusion of N. sylvestris (2n = 2x = 24) and N. tomentosiformis (2n = 2x = 24) and most of its genes are still present in two copies.25 The discovery that two orthologs to AtHMA2 and AtHMA4 are present in the genome of tobacco was therefore not surprising. It was however not obvious that those two genes would share the same function. Evolution may have modified or suppressed the function of one or both NtHMA genes. This was especially relevant in our case considering for instance that the footprint of a transposable element was present in the promoter region of NtHMAβ. However, our results showed a high degree of functional redundancy between the two genes. The most striking phenotype illustrating a complete functional redundancy was that single mutant plants grew and produced seeds like normal plants, while plants harboring nonsense mutation in each of the two NtHMA genes could neither develop nor survive. When the expression of both NtHMA genes was strongly reduced but not completely abolished, plant development and reproduction could occur, but pollen germination was significantly reduced. Functional redundancy could also be observed for other traits, but in these cases, the redundancy was partial. For example, mutation in only one of the NtHMA genes already resulted in reduced Cd concentrations in leaves. Partial functional redundancy was also evidenced while studying Cd tolerance of the NtHMA mutant plants. Altogether, it is therefore clear that the two NtHMA genes share partially redundant functions, showing additive effect for the traits for which they are not fully redundant. In particular, inactivating only one of the two genes is not detrimental for the appropriate development of the plant. This is a very similar situation as for the redundancy existing between AtHMA2 and AtHMA4.
Development of tobacco lines with reduced Cd accumulation in the leaves
One of the objectives of this work was to develop tobacco lines with reduced Cd concentration in shoots by inactivating HMA genes. Due to the difficulties of growing and commercializing genetically modified crops in Europe, we chose to work with mutants featuring single nucleotide polymorphisms obtained by ethyl methansulfonate treatment.31 A similar approach targeting OsNramp5 recently permitted the development of non-transgenic rice plants with reduced Cd accumulation in the shoots.37 Here we have demonstrated the successful creation of non-GMO tobacco lines that accumulate less Cd in the shoots than wild-type plants do.
Given the severe phenotypes of the plants harboring nonsense mutations in each of the two NtHMA genes or in which both genes are silenced, it is clear that the function of NtHMAα/β needs to be at least partially preserved for normal growth and development. This indicates that engineering commercially valuable tobacco plants with no Cd in the shoots cannot be achieved through the sole inactivation of the two NtHMA genes. However, inactivating only one of the NtHMA genes could lead to commercially valuable plants that display a 50% reduction of Cd concentration in shoots. To further decrease the ability of the plant to accumulate Cd in the leaves, an appropriate strategy could be to combine different mutations in NtHMA genes together. For example, one could combine a nonsense mutation in one NtHMA gene with the use of a leaky mutation in the other NtHMA gene. The aim would be to screen for the appropriate combination that would lead to plants displaying the lowest ability to accumulate Cd in the leaves but which would still develop like wild-type plants. Another and maybe more fruitful solution could be to combine mutations in NtHMA genes with mutations in other genes such as NRAMP5 or IRT1, which play a role in Cd transport at different steps than NtHMAs.36 Finally, as Cd is mainly transported by proteins, which main function is to transport essential metals such as Zn or Fe, the best solution to develop low-cadmium accumulating crops would be to identify mutations that would selectively reduce the transport of Cd without altering the transport of other elements. To-date, this kind of mutation has still not been reported.
NtHMA genes play a role in pollen germination and seed development
To date, Zn and Cd ATPases have been mainly described for their role in Zn/Cd loading into the xylem or for their role in Cd/Pb loading into root vacuoles.38 We have shown here that NtHMAα and NtHMAβ are also important for pollen development, seed number and seed viability. NtHMAα/NtHMAβ-silenced plants produce pollen that cannot germinate unless Zn is added to the germination media suggesting that NtHMAα and NtHMAβ play a role in zinc uptake. Interestingly, NtHMAα was shown to be expressed in anthers and might thus be responsible for the loading of zinc into the pollen sac. The importance of Zn for the pollen has already been reported in lentil.39 Indeed, when grown with low levels of Zn lentils had a reduced number of seeds and showed reduced pollen and seed viability as well as inhibition of pollen tube growth. However, no gene/mechanism underlying this phenotypic observation had been uncovered. In A. thaliana, inactivating AtHMA2 and AtHMA4 resulted in reduced fertility15 but again no precise mechanism was proposed to explain this phenotype. In this context, our results clearly demonstrate the direct impact of Zn on pollen germination and propose NtHMA genes as being important contributors to the feeding of pollen with zinc.
NtHMA genes were also shown to be important for seed quality and germination. This is likely due to a modified concentration of metals in seeds but additional experiments are needed to analyse this phenotype in detail.
NtHMAα and NtHMAβ possess special cytoplasmic tails
Plant Cd2+/Zn2+-ATPases have long C-terminal sequences rich in cysteines and histidines. Work performed on AtHMA2 showed that its C-terminal tail plays a role in the turn-over and enzyme velocity of the ATPase and that cysteines and histidines are important for the binding of zinc and cadmium8,26. The C-terminal ends of the newly identified NtHMAα and NtHMAβ are different from those of AtHMA2 and AtHMA4. They have twice more cysteines present in tandem, but lack the stretch of histidines. They are also between 2 and 3 times longer than the cytoplasmic tails of AtHMA2 and AtHMA4. Interestingly, these characteristics are also shared by the cytoplasmic tails of the orthologs of NtHMAs in Solanaceae. An exciting working hypothesis would be that the longer cytoplasmic tail of NtHMA proteins may enhance the capacity of plant to load cadmium into the xylem and explain why tobacco, unlike most other plant species, translocates most of the cadmium to its shoots instead of storing it in roots.7
Conclusion
Our study is a good example of how the fundamental work performed on Arabidopsis thaliana can be used for crops with agronomic or industrial interest. Using the sequences of AtHMA2 and AtHMA4, two HMA genes could be identified in tobacco. These genes have proven to be good targets to reduce Cd accumulation in shoots. Non-GMO lines with significantly reduced Cd accumulation in shoots were obtained. Like AtHMA2 and AtHMA4, NtHMAα and NtHMAβ are involved in both Cd and Zn distribution in the plant. In this regard, the function of NtHMAα and NtHMAβ seems to be redundant. A particularly novel result is that the NtHMAα/β genes seem to be essential for the transport of Zn into the pollen grain and for its germination.
Material and methods
Plant material and growth conditions
The wild-type tobacco plants BB16NN and BY212 as well as the mutated lines were provided by the tobacco institute of Bergerac (France). BB16NN and BY212 are two modern accessions of Burley tobacco and have both been used to generate the collection of mutagenized lines. To identify lines harboring EMS-induced mutations in the NtHMA genes, regions encoding the third cytosolic loop of the HMA protein were amplified by PCR from genomic DNA extracted from pools of the EMS-mutagenized lines using gene specific primers (Supplementary table S1). Mutations present in these amplified products were identified by CE-SSCP (Capillary Electrophoresis-Single Strand Conformation Polymorphism).31 To select mutant lines, only missense mutations occurring at highly conserved positions among HMA genes were considered and the CODDLE40 and SIFT41 bioinformatics prediction softwares were used to determine which of those mutations were the most likely to alter the function of the protein. For NtHMAα the selected missense mutations were P294S and E387K and the non-sense mutation was W265*. For NtHMAβ the selected missense mutation was G515R and the non-sense mutation was R529* (Supplementary table S1). All the mutant lines were backcrossed twice with their respective wild type (BB16NN or BY212) except the line harboring the non-sense mutation in NtHMAβ which was only backcrossed once.
In the greenhouse plants were grown in 1.5 liter pots. Light was controlled for a minimum of 16 hours a day; artificial light was used when natural luminosity was below 700 lux.
In hydroponics plants were grown at 20°C, 70% relative humidity and a 16:8 h light:dark cycle with a light intensity of 150 mol.m-2.s-1 in 2.5 mM KNO3, 0.5 mM NaH2PO4, 2.5 mM Ca(NO3)2, 0.5 mM MgSO4, 0.1 mM FeIIINaEDTA, 0.05 mM H3BO3, 0.05 mM MnSO4, 15 μM ZnSO4, 3 μM Na2MoO4, 2.5 μM KI, 0.05 μM CuSO4 and 0.044 μM CoCl2. Nutrient solutions were renewed every 3 to 4 days over the course of the entire experiment.
Plants were also grown in sterile conditions on plates containing Murashige and Skoog medium (MS, Duchefa) solidified with 1% (w/v) agar and buffered with 0.5 g.L-1 MES-KOH pH 5.7. The media were supplemented with various Cd (CdCl2) or Zn (ZnCl2) concentrations. Growing conditions were 21°C and 16 hours of light. Root lengths were measured with ImageJ using the NeuronJ plugin.
Cloning and sequencing of NtHMAα and NtHMAβ genes
Tobacco sequences similar to the Arabidopsis thaliana AtHMA2 and AtHMA4 sequences were identified in a library of tobacco BAC end sequences (compsysbio.achs.virginia.edu/tobfac). These sequences corresponded to short fragments of the NtHMAα and NtHMAβ genes. From these sequences primers were designed to amplify the NtHMAα and NtHMAβ genes from the BB16NN genomic DNA. Amplified fragments were used as probes to screen by Southern analysis a tobacco genomic BAC library that was made at CNRGV (reference NTA-B-BB16NN available at http://cnrgv.toulouse.inra.fr/library/genomic_resource/Nta-B-BB16NN). The presence of either NtHMAα or NtHMAβ was assessed using PCR on the different BAC clones that were identified. For each of the NtHMA genes one BAC clone was sequenced (accession numbers HF675180 and HF937053 for the BAC clones harboring NtHMAα and NtHMAβ, respectively). RT-PCR amplification was performed from BB16NN root cDNA and sequencing of the corresponding fragments led to the identification of the complete coding sequences of the NtHMA genes (accession numbers HF675181 and HF937054 for the cDNAs encoding NtHMAα and NtHMAβ, respectively). The primers used during this work are listed in supplementary table S2.
Phylogenetic analysis
Phylogenetic analyses were performed using Seaview (pbil.univlyon1.fr/software/seaview.html.42 HMA protein sequences from Arabidopsis and their identified orthologs in other species (rice, grape, A. lyrata, sorghum, A. halleri, tomato and N. benthamiana) were retrieved from online databases: AhHMA3 (AJ556182) and AhHMA4 (EU382072), AlHMA1 (XM_002866914), AlHMA2 (XM_002867321), AlHMA3 (XM_002867320), AtHMA1 (NM_119890), AtHMA2 (AY434728), AtHMA3 (AY055217), AtHMA4 (AF412407), AtHMA5 (Q9SH30), AtHMA6 (Q9SZC9), AtHMA7 (Q9S7J8), AtHMA8 (B9DFX7), MtHMA-A (AC130275), MtHMA-B(135313) NbenHMA4 (Nbv3K585727037), OsHMA1 (NM_001064952), OsHMA2 (HQ646362), OsHMA3 (AB557931), SbHMA2 (XM_002438908), SbHMA3-1 (XM_002459533), SbHMA3-2 (XM_002459534), SlHMA4 (XP_004242843), VvHMA1 (XM_002278513). TBLASTX analysis led to the identification of the sequences of the SlHMA (AEKE02004109), NsylHMA (ASAF01121754), NtomHMA (ASAG01036389 and ASAG01036390) and NbHMA homologs. The 9 OsHMA protein sequences were obtained from the supplementary data of Baxter et al.43 The first parts of the proteins, containing all the transmembrane domains, were aligned using the muscle algorithm and the phylogenetic tree was constructed using the Maximum Likelihood method from G-blocks distributed along the corresponding sequence of the proteins. Bootstrap values were obtained using 1000 replicates.
Obtention of N. tabacum lines harbouring amiRNA constructs targeting the NtHMA genes
AmiRNA constructs were made according to the guidelines detailed in Ossowski et al32, using the online resource associated to this publication (wmd3.weigelworld.org). Two constructs were designed to silence specifically NtHMAα, two constructs were designed to silence specifically NtHMAβ and one construct was designed to silence both genes (Supplementary Table S1 and Supplementary Table S2). The amiRNA sequences were compared with the available tobacco sequences to check that they could not target any other sequence than the NtHMA sequences. The amiRNA constructs were introduced into the pGREEN44 vector and then in the GV3101 Agrobacterium strain, together with the pSOUP plasmid. Transgenic tobacco lines harboring the amiRNA constructs were produced in the BB16NN background using a standard leaf disk transformation procedure.45 Quantitative PCR was used on homozygous lines to select the transgenic lines in which NtHMA genes were the most specifically and efficiently silenced. At least 3 independent transgenic plants were selected for each construct.
RNA Preparation and Quantitative RT-PCR
Total RNA was extracted using the RNeasy kit (Qiagen). The cDNAs were prepared from 1 μg of total RNA using M-MLV Reverse Transcriptase RNAse H minus (Promega) and oligo(dT) 15 primers (Promega) following manufacturer’s instructions. To analyze transcript accumulation in wild-type and HMA-silenced plants gene-specific primers were designed for real time quantitative PCR (Supplementary Table S2). To warrant the gene copy specificity of the amplification, plasmids containing either NtHMAα or NtHMAβ were used as controls in every experiment. Real-time quantitative RT-PCR was performed using a LightCycler480 with Fast-Start DNA MasterPLUS SYBER GREEN I (Roche Applied Science, www.roche-applied-science.com). Analysis of relative transcript accumulation was done using LightCycler480 SW1.5. The purity of the amplicons was assessed for every sample by analyzing the amplicon dissociation during the gradual increase of the temperature from 72°C to 95°C at the rate of 0.11°C/sec, using the Tm calling method proposed by the LightCycler480 software. Expression level of NtHMAα and NtHMAβ was determined relative to the already described housekeeping genes cyclophilin and ribosomal protein L2 (accession numbers X62500 and Z14081, respectively).46 Real time quantitative RT-PCR was performed using at least three independent biological replicates and three technical replicates of each biological sample. The student t test used to determine different statistical groups was performed with the open software R (R Development Core Team).
Metal concentration measurements
Preliminary tests showed that metal extraction in HCl and mineralization gave similar results to assess metal concentration (data not shown). We therefor used the former, less hazardous, procedure. Plant samples were dried at 75°C for 48 h before measurement of dry weight. Dried plant samples were incubated in 1N HCl at 80°C for 30 min to extract cations. Concentrations of Cd, Zn or Fe were determined by ICP-MS (ICP-MS 7500cx, agilent technologies, reporting limit of 0.2 ng/ml and standard recovery of 5 μg/L). Analyses were performed on individual plants using at least 3 plants per genotype.
GUS staining experiments
A 3-kb-long PCR-amplified (for primer see Supplementary Table S2) fragment corresponding to the promoter of NtHMAα was fused upstream the gusA coding sequence into the pCambia1391 vector. This construct was introduced into the A. tumefaciens GV3101 strain and then into tobacco as described above. GUS staining was performed as described.47 The staining solution contained 50 mM NaPO4 pH7, 0.5 mM ferricyanide, 0.5 mM ferrocyanide, 0.05 % triton, 1 mM X-Gluc. Coloration appeared after two hours of incubation at 37°C in the staining solution. Chlorophyll was removed from leaf explants by successive 10-min-long incubations in solutions with increasing EtOH concentrations (50%, 70%, 90% and 100%). After complete chlorophyll removal, tissues were rehydrated thanks to successive 10-min-long incubations in solutions with decreasing EtOH concentrations (90%, 70% and 50%).
Analyses of pollen
For each plant, pollen grains were collected only from the first three opening flowers. Pollen was collected while flowers were opening for the first time, to avoid pollen loss or dehiscence. Pollen grains were suspended in water and counted using the Nageotte hemocytometer (Grosseron, ref. 0703614). Pollen viability was assessed using the Alexander stain48. Pollen germination was performed as described47 using a buffer containing 1.6 mM H3BO3, 200 μM CaCl2, 6 % sucrose and 1 mM morpholine ethanesulfonic acid, pH 5.7. Pollen was incubated at 20°C over 3 hours under weak agitation in the dark before the reaction was stopped. Pollen germination rate was calculated using 100 pollen grains from each flower.
Seed germination
For each genotype, the capsules of at least three plants were collected and at least three capsules per plants were harvested. To determine the number of seeds per capsules, 200 seeds per genotype were weighted. The total number of seeds in a given capsule was then deduced from the weight of all the seeds in this capsule.
Plants were sown on plates containing MS media to determine the germination efficiency (number of germinated plants divided by total number of seeds ×100).
SXRF Microspectroscopy of Intact Seed
Elemental maps of dry, mature seed were collected at the bending magnet beamline BL2-3 at the Stanford Synchrotron Radiation Lightsource (Palo Alto, CA). This beamline uses Kirkpatrick-Baez optics to achieve optimized beam dimensions of 2 μm in both horizontal and vertical planes. Detailed SXRF mapping of tobacco seeds was performed with a 7 μm × 7 μm step size and a 50 ms dwell time using a silicon (111) monochromator for energy selection, and a Vortex (SII) detector. The rapid flyscanning capabilities of this beam line preclude the need for intrusive sample preservation. Elemental maps were collected at an energy of 11 keV. SXRF images were quantified and analyzed using Microanalysis Toolkit.50 Reference fluorescence maps were collected from a suite of known-abundance thin-film standards for fluorescence count quantification. Arrays of seed were placed on metal-free Kapton™ double-sided tape, maintaining identical orientation for each. Four replicate seeds of each line were included in the analysis, with same-batch wild type seeds included in the array. During quantification the effect of sample thickness on fluorescence yield was accounted for by measuring X-ray absorption with the p-type n-type intrinsic diode downstream of the sample. Region-of-interest analysis (masking) isolated individual seeds for statistical analysis (mean intensity, total intensity and area) and subtraction of background fluorescence.
Supplementary Material
(A) Intron-exon organization of NtHMAα, NtHMAβ, AtHMA2, AtHMA3 and AtHMA4. Exons are represented by rectangles and are numbered. Introns are not to scale. Shaded rectangles are well-conserved exons among the 5 HMA genes (identity higher than 50% at the amino acid level). White rectangles represent the remaining exons and correspond to the part of the proteins, which encodes the C-terminal cytoplasmic loop and is less conserved (identity lower than 50% at the amino acid level). (B) Percentage of amino acid identity between the first 8 exons of NtHMAα, NtHMAβ, AtHMA2, AtHMA3 and AtHMA4.
Focus on the protein sequence alignments corresponding to the regions harboring the GICCTSE (metal binding domain, MBD), DKTGT (P-domain) and CPx/SPC motifs, which are the signatures of the clade gathering Zn, Cd and Pb P1B-ATPases. Alignments were performed using Clustalw (www.ebi.ac.uk/Tools/msa/clustalw2/). Black arrows indicate where the motifs are in the alignements and red arrows indicate the two HMAs from tobacco.
Transcript accumulation was determined in five-week-old plants grown in vitro. Three independent transgenic lines were analyzed for each construct and three plants were used for each transgenic line. Transcript accumulation was determined using quantitative PCR with three technical replicates. NtHMAα and NtHMAβ transcript levels were normalized by comparison with transcripts of the ribosomic protein L2 and cyclophilin. Error bars represent standard. * : P < 0.05 ; ** : P < 0.005, compared to the transcript level of the same gene in the wild type.
(A) Picture of a set of F2 plants issued from the cross between two parents harboring each a nonsense mutation in one of the NtHMA genes. Dwarf plants (circled in red) are the only plants that harbor homozygous nonsense mutations in both NtHMAα and NtHMAβ. The development of the other plants does not differ from the development of wild-type plants. (B) Leaves of plants in which the two NtHMA genes are silenced (top) are compared to leaves of plants transformed with the empty vector (bottom). The main differences between the two lines concern the secondary veins organization and the shape of the leaves. (C) Representative mature capsules collected from different combinations of reciprocal crosses between wild-type plants and NtHMAα/NtHMAβ-silenced plants.
(A) Iron and zinc distribution in the seed as visualized by SXRF. Scales on the right side correspond to Fe and Zn signal intensities (normalized fluorescence counts) analyzed using Microanalysis Toolkit49. (B) Quantification of the signal visualized in panel A using Microanalysis Toolkit. (C) Fe and (D) Zn content quantified by ICP-MS analysis. Error bars represent standard errors (n = 3). * : P < 0.05 ; ** : P < 0.005.
The “*” indicate the apparition of a new stop codon.
Acknowledgments
We thank A. Adiveze, H. Afonso, C. Ausseil, C. Baracco, H. Baudot, C. Dasen, T. Dessup, X. Dumont, C. Fizames, J. Garcia, S. Gélin, F. Lecocq, C. Muller, V. Papy, V. Rafin, G. Ruiz and C. Zicler, for technical and administrative supports as well as J. Danku and D. Salt for ICP-MS analysis of seed metal content. Portions of this research were carried out at the Stanford Synchrotron Radiation Lightsource, a Directorate of SLAC National Accelerator Laboratory and an Office of Science User Facility operated for the U.S. Department of Energy Office of Science by Stanford University.
Fundings
This work was supported by an INRA fellowship to VH. Part of this work was also supported by grants from l’Association de Recherche sur les Nicotianées and from the National Institute of Environmental Health Sciences and the Environmental Protection Agency: Superfund Research Program (grant No. P42 ES007373-14), Children’s Environmental Health and Disease Prevention (EPA RD-83459901 and P20 ES018175) to TP.
References
- 1.Broadley MR, White PJ, Hammond P, Zelko I, Lux A. The New Pyhtologist. 2007;173:677–702. doi: 10.1111/j.1469-8137.2007.01996.x. [DOI] [PubMed] [Google Scholar]
- 2.Clemens S, Palmgren MG, Krämer U. Trends in Plant Science. 2002;7:309–315. doi: 10.1016/s1360-1385(02)02295-1. [DOI] [PubMed] [Google Scholar]
- 3.Dguimi HM, Debouba M, Ghorbel MH, Gouia H. Comptes Rendus de Biologies. 2008;332:58–68. doi: 10.1016/j.crvi.2008.08.021. [DOI] [PubMed] [Google Scholar]
- 4.Verbruggen N, Hermans C, Schat H. Current Opinion in Plant Biology. 2009;12:364–372. doi: 10.1016/j.pbi.2009.05.001. [DOI] [PubMed] [Google Scholar]
- 5.Järup L, Akesson A. Current status of Cd as an environmental health problem. Toxicology and Applied Pharmacology. 2009;238:201–208. doi: 10.1016/j.taap.2009.04.020. [DOI] [PubMed] [Google Scholar]
- 6.Godt J, Scheidig F, Grosse-Siestrup C, Esche V, Brandenburg P, Reich, Groneberg D. Journal of Occupational Medicine and Toxicology. 2006;1:22–27. doi: 10.1186/1745-6673-1-22. [DOI] [PMC free article] [PubMed] [Google Scholar]
- 7.Maaroufi Dguimi H, Debouba M, Ghorbel MH, Gouia H. Comptes rendus de l’Académie des sciences. 2009;332:58–68. doi: 10.1016/j.crvi.2008.08.021. [DOI] [PubMed] [Google Scholar]
- 8.Wong CK, Jarvis RS, Sherson SM, Cobbett CS. The New Phytologist. 2009;181:79–88. doi: 10.1111/j.1469-8137.2008.02637.x. [DOI] [PubMed] [Google Scholar]
- 9.Hanikenne M, Talke IN, Haydon MJ, Lanz C, Nolte A, Motte P, Kroymann J, Weigel D, Kramer U. Nature. 2008;453:391–395. doi: 10.1038/nature06877. [DOI] [PubMed] [Google Scholar]
- 10.Korenkov V, King B, Hirschi K, Wagner GJ. Plant Biotechnology Journal. 2009;7:1–8. doi: 10.1111/j.1467-7652.2008.00390.x. [DOI] [PubMed] [Google Scholar]
- 11.Elmayan T, Tepfer M. The Plant Journal. 1994;6:433–440. doi: 10.1046/j.1365-313x.1994.06030433.x. [DOI] [PubMed] [Google Scholar]
- 12.Dorlhac de Borne F, Elmayan T, de Roton C, de Hys L, Tepfer M. Molecular Breeding. 1998;4:83–90. [Google Scholar]
- 13.Gonzalez P, Baudrimont M, Boudou A, Bourdineaud JP. Biometals. 2006;3:225–235. doi: 10.1007/s10534-005-5670-x. [DOI] [PubMed] [Google Scholar]
- 14.Connolly EL, Fett JP, Guerinot ML. Plant Cell. 2002;14:1347–1357. doi: 10.1105/tpc.001263. [DOI] [PMC free article] [PubMed] [Google Scholar]
- 15.Hussain D, Haydon MJ, Wang Y, Wong E, Sherson SM, Young J, Camakaris J, Harper JF, Cobbett CS. Plant Cell. 2004;16:1327–1339. doi: 10.1105/tpc.020487. [DOI] [PMC free article] [PubMed] [Google Scholar]
- 16.Verret F, Gravot A, Auroy P, Leonhardt N, David P, Nussaume L, Vavasseur A, Richaud P. FEBS Letters. 2004;576:306–312. doi: 10.1016/j.febslet.2004.09.023. [DOI] [PubMed] [Google Scholar]
- 17.Korenkov V, Hirschi K, Crutchfield JD, Wagner GJ. Planta. 2007;226:1379–1387. doi: 10.1007/s00425-007-0577-0. [DOI] [PubMed] [Google Scholar]
- 18.Morel M, Crouzet J, Gravot A, Auroy P, Leonhardt N, Vavasseur A, Richaud P. Plant physiology. 2009;149:894–904. doi: 10.1104/pp.108.130294. [DOI] [PMC free article] [PubMed] [Google Scholar]
- 19.Thomine S, Wang R, Ward JM, Crawford NM, Schroeder JI. Proceedings of the National Academy of Sciences of the USA. 2000;97:4991–4996. doi: 10.1073/pnas.97.9.4991. [DOI] [PMC free article] [PubMed] [Google Scholar]
- 20.Oomen RJ, Wu J, Lelievre F, Blanchet S, Richaud P, Barbier-Brygoo H, Aarts MG, Thomine S. The New Phytologist. 2009;181:637–650. doi: 10.1111/j.1469-8137.2008.02694.x. [DOI] [PubMed] [Google Scholar]
- 21.Huang J, Zhang Y, Peng JS, Zhong C, Yi HY, Ow DW, Gong JM. Plant Physiology. 2012;158:1779–1788. doi: 10.1104/pp.111.192872. [DOI] [PMC free article] [PubMed] [Google Scholar]
- 22.Takahashi R, Bashir K, Ishimaru Y, Nishizawa NK, Nakanishi H. Plant signaling and behavior. 2012;12:1605–1607. doi: 10.4161/psb.22454. [DOI] [PMC free article] [PubMed] [Google Scholar]
- 23.Yamaji N, Xia J, Mitani-Ueno N, Yokosho K, Feng Ma J. Plant physiology. 2013;162:927–939. doi: 10.1104/pp.113.216564. [DOI] [PMC free article] [PubMed] [Google Scholar]
- 24.Yukawa M, Tsudzuki T, Sugiura M. Molecular Genetics and Genomics. 2006;275:367–373. doi: 10.1007/s00438-005-0092-6. [DOI] [PubMed] [Google Scholar]
- 25.Clarkson JJ, Lim KY, Kovarik A, Chase MK, Knapp S, Leitch AR. The New Phytologist. 2005;168:241–252. doi: 10.1111/j.1469-8137.2005.01480.x. [DOI] [PubMed] [Google Scholar]
- 26.Sierro N, Battey JN, Ouadi S, Bovet L, Goepfert S, Bakaher N, Peitsch MC, Ivanov NV. Genome biology. 2013;14:1–17. doi: 10.1186/gb-2013-14-6-r60. [DOI] [PMC free article] [PubMed] [Google Scholar]
- 27.Naim F, Nakasugi K, Crowhurst RN, Hilario E, Zwart AB, Hellens RP, Taylor JM, Waterhouse PM, Wood GC. PLoS One. 2012;7:e52717. doi: 10.1371/journal.pone.0052717. [DOI] [PMC free article] [PubMed] [Google Scholar]
- 28.Eren E, Kennedy DC, Maroney MJ, Argüello JM. The Journal of Biological Chemistry. 2006;281:33881–33891. doi: 10.1074/jbc.M605218200. [DOI] [PubMed] [Google Scholar]
- 29.Bernard C, Roosens N, Czernic P, Lebrun M, Verbruggen N. FEBS letters. 2004;569:140–148. doi: 10.1016/j.febslet.2004.05.036. [DOI] [PubMed] [Google Scholar]
- 30.Williams LE, Mills RF. Trends in plant science. 2005;10:491–502. doi: 10.1016/j.tplants.2005.08.008. [DOI] [PubMed] [Google Scholar]
- 31.Julio E, Laporte F, Reis S, Rothan C, Dorlhac de Borne F. Molecular Breeding. 2008;21:369–381. [Google Scholar]
- 32.Ossowski S, Schwab R, Weigel D. The Plant journal. 2008;53:674–690. doi: 10.1111/j.1365-313X.2007.03328.x. [DOI] [PubMed] [Google Scholar]
- 33.Punshon T, Hirschi K, Yang J, Lanzirotti A, Lai B, Guerinot ML. Plant Physiology. 2012;158:352–362. doi: 10.1104/pp.111.184812. [DOI] [PMC free article] [PubMed] [Google Scholar]
- 34.Ueno D, Milner MJ, Yamaji N, Yokosho K, Koyama E, Clemencia Zambrano M, Kaskie M, Ebbs S, Kochian LV, Ma JF. The Plant journal. 2011;66:852–862. doi: 10.1111/j.1365-313X.2011.04548.x. [DOI] [PubMed] [Google Scholar]
- 35.Satoh-Nagasawa N, Mori M, Nakazawa N, Kawamoto T, Nagato Y, Sakurai K, Takahashi H, Watanabe A, Akagi H. Plant & cell physiology. 2012;53:213–224. doi: 10.1093/pcp/pcr166. [DOI] [PubMed] [Google Scholar]
- 36.Lugon-Moulin N, Zhang M, Gadani F, Rossi L, Koller D, Krauss M, Wagner GL. Advances in agronomy. 2004;83:111–180. [Google Scholar]
- 37.Ishikawa S, Ishimaru Y, Igura M, Kuramata M, Abe T, Senoura T, Hase Y, Arao T, Nishizawa NK, Nakanishi H. Proceedings of the National Academy of Sciences o the USA. 2012;109:19166–19171. doi: 10.1073/pnas.1211132109. [DOI] [PMC free article] [PubMed] [Google Scholar]
- 38.Palmer CM, Guerinot ML. Nature chemical biology. 2009;5:333–340. doi: 10.1038/nchembio.166. [DOI] [PMC free article] [PubMed] [Google Scholar]
- 39.Pandey N, Pathak GC, Sharma CP. Journal of Trace Elements in Medicine and Biology. 2006;20:89–96. doi: 10.1016/j.jtemb.2005.09.006. [DOI] [PubMed] [Google Scholar]
- 40.Till BJ, Reynolds SH, Greene EA, Codomo CA, Enns LC, Johnson JE, Burtner C, Odden AR, Young K, Taylor NE, Henikoff JG, Comai L, Henikoff S. Genome Research. 2003;13:524–530. doi: 10.1101/gr.977903. [DOI] [PMC free article] [PubMed] [Google Scholar]
- 41.Ng PC, Henikoff S. Nucleic Acid Research. 2003;31:3812–3814. doi: 10.1093/nar/gkg509. [DOI] [PMC free article] [PubMed] [Google Scholar]
- 42.Gouy M, Guindon S, Gascuel O. Molecular Biology and Evolution. 2010;27:221–224. doi: 10.1093/molbev/msp259. [DOI] [PubMed] [Google Scholar]
- 43.Baxter I, Tchieu J, Sussman MR, Boutry M, Palmgren MG, Gribskov M, Harper JF, Axelsen KB. Plant physiology. 2003;132:618–628. doi: 10.1104/pp.103.021923. [DOI] [PMC free article] [PubMed] [Google Scholar]
- 44.Hellens RP, Edwards EA, Leyland NR, Bean S, Mullineaux PM. Plant Molecular Biology. 2000;42:819–832. doi: 10.1023/a:1006496308160. [DOI] [PubMed] [Google Scholar]
- 45.Horsch RB, Fraley RT, Rogers SG, Sanders PR, Lloyd A, Hoffmann N. Science. 1984;223:496–498. doi: 10.1126/science.223.4635.496. [DOI] [PubMed] [Google Scholar]
- 46.Nicot N, Hausman JF, Hoffmann L, Evers D. Journal of Experimental Botany. 2005;56:2907–2914. doi: 10.1093/jxb/eri285. [DOI] [PubMed] [Google Scholar]
- 47.Jefferson RA, Burgess SM, Hirsh D. Proceedings of the National Academy of Sciences. 1986;83:8447–8451. doi: 10.1073/pnas.83.22.8447. [DOI] [PMC free article] [PubMed] [Google Scholar]
- 48.Alexander MP. Stain Technology. 1969;44:117–122. doi: 10.3109/10520296909063335. [DOI] [PubMed] [Google Scholar]
- 49.Thorsness MK, Kandasamy MK, Nasrallah ME, Nasrallah JB. Plant Cell. 1993;5:253–261. doi: 10.1105/tpc.5.3.253. [DOI] [PMC free article] [PubMed] [Google Scholar]
- 50.Webb SM. AIP Conference Proceeding. 2005;1365:196–199. [Google Scholar]
Associated Data
This section collects any data citations, data availability statements, or supplementary materials included in this article.
Supplementary Materials
(A) Intron-exon organization of NtHMAα, NtHMAβ, AtHMA2, AtHMA3 and AtHMA4. Exons are represented by rectangles and are numbered. Introns are not to scale. Shaded rectangles are well-conserved exons among the 5 HMA genes (identity higher than 50% at the amino acid level). White rectangles represent the remaining exons and correspond to the part of the proteins, which encodes the C-terminal cytoplasmic loop and is less conserved (identity lower than 50% at the amino acid level). (B) Percentage of amino acid identity between the first 8 exons of NtHMAα, NtHMAβ, AtHMA2, AtHMA3 and AtHMA4.
Focus on the protein sequence alignments corresponding to the regions harboring the GICCTSE (metal binding domain, MBD), DKTGT (P-domain) and CPx/SPC motifs, which are the signatures of the clade gathering Zn, Cd and Pb P1B-ATPases. Alignments were performed using Clustalw (www.ebi.ac.uk/Tools/msa/clustalw2/). Black arrows indicate where the motifs are in the alignements and red arrows indicate the two HMAs from tobacco.
Transcript accumulation was determined in five-week-old plants grown in vitro. Three independent transgenic lines were analyzed for each construct and three plants were used for each transgenic line. Transcript accumulation was determined using quantitative PCR with three technical replicates. NtHMAα and NtHMAβ transcript levels were normalized by comparison with transcripts of the ribosomic protein L2 and cyclophilin. Error bars represent standard. * : P < 0.05 ; ** : P < 0.005, compared to the transcript level of the same gene in the wild type.
(A) Picture of a set of F2 plants issued from the cross between two parents harboring each a nonsense mutation in one of the NtHMA genes. Dwarf plants (circled in red) are the only plants that harbor homozygous nonsense mutations in both NtHMAα and NtHMAβ. The development of the other plants does not differ from the development of wild-type plants. (B) Leaves of plants in which the two NtHMA genes are silenced (top) are compared to leaves of plants transformed with the empty vector (bottom). The main differences between the two lines concern the secondary veins organization and the shape of the leaves. (C) Representative mature capsules collected from different combinations of reciprocal crosses between wild-type plants and NtHMAα/NtHMAβ-silenced plants.
(A) Iron and zinc distribution in the seed as visualized by SXRF. Scales on the right side correspond to Fe and Zn signal intensities (normalized fluorescence counts) analyzed using Microanalysis Toolkit49. (B) Quantification of the signal visualized in panel A using Microanalysis Toolkit. (C) Fe and (D) Zn content quantified by ICP-MS analysis. Error bars represent standard errors (n = 3). * : P < 0.05 ; ** : P < 0.005.
The “*” indicate the apparition of a new stop codon.