

Abstract
The purpose of this research was to investigate the influence of sock addition and sock removal on residual limb fluid volume in people using prosthetic limbs. We used bioimpedance analysis to measure residual limb extracellular fluid volume on 28 transtibial amputee subjects during 30-minute test sessions. Upon addition of a 1-ply polyester sock, residual limb fluid volume changes ranged from −4.0% to 0.8% (mean −0.9% (s.d.=1.3%)) of the initial limb fluid volume. Changes for sock removal ranged from −1.2% to 2.8% (mean 0.5% (s.d.=0.8%)). Subjects who reduced in fluid volume with both addition and removal of a sock and subjects with high positive ratios between the fluid volume loss upon sock addition and the gain upon sock removal (high Add/Remove(AR) ratios) tended to have arterial disease, were obese and smokers. Subjects with low positive AR ratios, subjects who increased in fluid volume both with sock addition and removal, and a single subject who increased in fluid volume with sock addition and decreased with sock removal tended to be non-smokers and either healthy individuals without complications or individuals without arterial problems. Results are relevant towards anticipating limb volume changes during prosthetic fitting and towards the design of adjustable-socket technologies.
INTRODUCTION
For individuals using lower limb prostheses, daily changes in the volume of the residual limb can cause discomfort and pain. Changes in limb volume affect how the prosthesis fits [1] and how mechanical pressures and shear stresses are delivered to the residual limb [2]. Typically, when a patient’s residual limb decreases in volume, more stress is applied at bony prominences, such as the anterior distal tibia and the fibular head, and this elevated stress may cause pain and increase the risk of breakdown and injury. When a patient’s residual limb increases in volume, blood flow may be obstructed, limiting nutrient delivery and causing a buildup of cell waste products in the residuum. Residual limb volume changes also affect suspension and how much the limb pistons (moves up and down) in the socket during ambulation. Pistoning induces frictional stress, i.e. rubbing with slipping between the limb and socket, which induces injury faster than shear stress, rubbing without slipping [3].
Adding or removing socks is a common way for people using prostheses to accommodate daily residual limb volume changes. For many people with lower-limb amputation, their limb volume is greatest early in the day after rising. After walking with the prosthesis, they may experience a reduction in limb volume. Volume reduction can continue over the day as a result of the continual stresses applied by the prosthetic socket during ambulation. Individuals who use a shrinker (an elastic sock worn on the residuum) at night or people with venous vascular complications may experience the opposite trend, that is, an increase in limb volume (edema) during the day. These individuals may achieve their maximal limb volume in the evening. Whether experiencing limb volume increases or decreases over the day, people with limb amputation often carry extra socks with them that they add or remove in an effort to keep an adequate socket fit despite residual limb volume changes.
While adding or removing socks adjusts the fit of the socket, these adjustments cause a change in the socket pressures and shear stresses applied to the residual limb that in turn might affect the limb volume which the socks are intended to control. Adding socks may increase interstitial fluid pressure, decreasing the person’s limb volume even further. Removing socks may induce the opposite effect and increase residual limb volume. However, limb volume regulation is under a complex physiologic control, and it is unknown if adding and removing socks indeed induce these changes. It is also unknown if the residual limb fluid volume reduction from sock addition is comparable to the residual limb fluid volume increase from subsequent sock removal.
The purpose of this study was to investigate the short-term effects of adding and removing socks on residual limb fluid volume in people with trans-tibial amputation. We used bioimpedance analysis for the fluid volume assessment to answer the question: Is residual limb fluid volume affected by adding or removing socks, and are the changes for adding a sock of comparable magnitude but opposite in direction from those for removing a sock? We also investigated how the results were related to the participant’s health.
METHODS
Subjects
Human subject’s approval from a University of Washington Internal Review Board (IRB) was received and informed consent was obtained before any study procedures were initiated. Subjects were included if they had a trans-tibial amputation that was performed at least 12 months prior to enrollment in the study and their residual limb from the mid-patellar-tendon to the distal end was at least 9 cm in length. To participate, subjects were required to have a definitive prosthesis that they wore at least 5 hours per day. Their prosthesis needed to fit properly and function safely, as assessed by the research practitioner. Using a flexible probe, at the outset of the session the practitioner assessed fit and adjusted sock ply to ensure the residual limb was adequately supported in the proximal and central regions. Subjects were not included if they could not ambulate with a prosthesis for 10 minutes indoors on a level walkway, or if they could not shift from a vertical to horizontal posture within 30 seconds (necessary for vascular tests). Subjects with current skin breakdown were excluded from the study. If the subject had bilateral amputation, we used the residual limb that met the inclusion criteria. If both residual limbs met the inclusion criteria then we considered several factors in selecting the limb to monitor: limb length, amount of scar tissue, and ease of monitoring. The limb expected to produce the strongest most reliable bioimpedance signal was selected.
Instrumentation
In this study a multi-frequency bioimpedance analyzer (Hydra 4200, Xitron) that we modified for the purpose of testing people with trans-tibial amputation was used for assessing residual limb extracellular fluid volume change. To ensure minimal disruption to signal quality during subject’s ambulation, we created a custom 4-pin Delrin connector that accommodated gold-plated pins (WPI Viking) to attach four 28-gauge insulated lead wires from the Xitron instrument cable to the electrodes. To strain relieve and mechanically stabilize the wire-to-electrode connection after it was soldered together, we looped the wire onto the tab of the electrode, placed a polystyrene disk (9 mm diameter, 0.25 mm thickness) over the connection, and subsequently wrapped it with a single layer of vinyl electrical tape (Super 88, Scotch). A 9 mm × 26 mm section was cut from the adhesive part of a Band Aid (Johnson & Johnson), and its outer surface glued (Skin-Bond Cement, Smith & Nephew) onto the outside of the electrical tape over the tab so that the Band-Aid’s sticky surface was exposed to the skin. The purpose of the Band-Aid was to ensure that both the tab stuck to the skin and the tab-solder connection was not excessively strained and damaged during use. These efforts substantially enhanced signal to noise and decreased failure at the wire-to-electrode connection. The largest source of error in the bioimpedance measurement was bit quantification. The smallest fluid volume change that could be resolved depended on the subject’s limb fluid volume but was not larger than 0.2% for all subjects.
Bioimpedance has been used extensively in other areas of biomedicine including body composition/body fat analysis [4,5,6,7,8,9] and in the assessment of fluid imbalance in hemodialysis patients [10,11,12,13]. It has been shown to correlate well with other measurement techniques including deuterium oxide and bromide dilution [14,15,16,17] as well as magnetic resonance imaging [18]. In this study we defined “residual limb fluid volume change” as the extracellular fluid volume change measured using the multi-frequency bioimpedance analysis system. Only extracellular fluid was considered in the analysis here, because of its likely strong influence on short-term limb fluid volume change [19].
To conduct bioimpedance analysis on trans-tibial amputee subjects, four electrodes were placed on the residual limb (FIGURE 1). The outer pair was current-injecting while the inner pair was voltage-sensing. Current was applied at between 50μA and 700μA at 50 frequencies between 5 kHz and 1 MHz to the current-injecting electrodes, while voltage (amplitude and phase) was measured with the voltage-sensing electrodes. The system recorded resistance, reactance, impedance, and phase once per second for all 50 frequencies.
FIGURE 1. Electrode placement for bioimpedance testing.
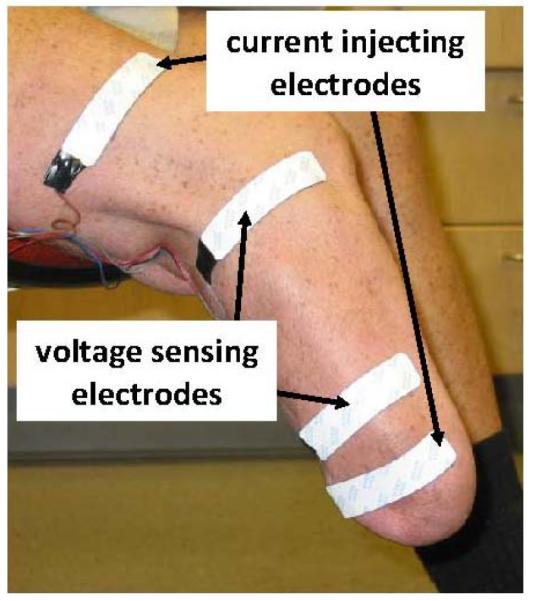
The outer two electrodes injected current while the inner two electrodes sensed voltage.
Protocol
Subjects were asked to refrain from drinking coffee or alcohol before coming to the lab on the day of testing. We started tests between the hours of 9:00 AM and 1:30 PM. After arriving at the laboratory the subject’s weight and height were recorded. Body mass index (BMI) was calculated as mass (kg)/[height (m)]2 [20]. The subject wore the prosthesis while mass was recorded to offset BMI measurement underestimates that occur when people with trans-tibial amputation do not wear their prosthesis for measurement [21]. The research practitioner queried the subjects at the outset of the test session to determine if the socket was comfortable. Sock ply was adjusted if needed. Then the subject walked briefly on a treadmill (Clubtrack, Quinton) to determine a normal self-selected walking speed, which was recorded. The subject then sat in a chair and rested comfortably for 20 minutes with the prosthesis donned while the research practitioner queried the subject on recent medical history and perceived socket comfort. Vascular and cardiovascular health and disease histories were recorded. The subject then doffed the prosthesis, and the research practitioner inspected the residual limb to ensure there were no sores or injury. The skin was prepared for bioimpedance measurement by rubbing gently with sandpaper (Red Dot™ Trace Prep 2236, 3M) the regions where the electrodes were to be placed [22]. A thin layer of coupling gel (Couplant D, Panametrics) was applied to the skin side of each electrode before affixing it to the skin. All electrodes were placed parallel to each other on the lateral posterior region of the residual limb (FIGURE 1). This region was used so that the bone did not interfere with the electrical current flow through the soft tissues of interest. In addition, when positioned on the lateral posterior surface, the electrodes were comfortable to the subjects. The voltage-sensing electrodes were positioned so as to maximize the segment measured below the knee but not to interfere with bony prominences. The proximal voltage-sensing electrode was placed at the level of the patellar tendon, proximal to the fibular head. Voltage-sensing electrodes were not placed above the level of the patellar tendon because knee flexion would have distorted the measurement of interest. The distal current-injecting electrode was placed as far distally as possible but still on the relatively cylindrical part of the limb. The distal voltage-sensing electrode was placed between 3.0 and 5.5 cm proximal to the distal current-injecting electrode. The proximal current-injecting electrode was placed on the thigh under the liner or suspension sleeve. Tegaderm (3M) was used to strain-relieve the wires extending from the electrodes out the socket brim. Once the electrodes were applied, residual limb circumference was measured at the levels of the voltage-sensing electrodes, and data collection was initiated.
The subject donned the prosthesis and sat still without talking for 2 minutes with the prosthetic foot supported on the floor. Care was taken to ensure good sitting posture, since too much knee flexion occludes blood flow, and too much extension causes a slouching posture. To achieve good sitting posture, typically the subject’s knee was in approximately 100 degrees of extension. The subject then walked on the treadmill for 3 minutes at the normal self-selected walking speed established at the outset of the session. Next the subject stood for approximately 12 seconds with equal weight-bearing on a 6.4 cm high platform with an electronic weight scale (349KLX Health-O-Meter, Pelstar) embedded within it so that the top of the scale was flush with the platform surface. The scale was monitored at a 2 Hz sampling rate. If the weight on the scale deviated by more than 10% of half the subject’s body weight, then the subject was instructed by the research practitioner to shift his or her weight to the appropriate leg so as to achieve equal weight-bearing. The subject then sat, doffed the prosthesis, and added a 1-ply sock (Knit-Rite 1SP1-RG-SH Lightweight Soft Sock), a process that typically took less than 60 seconds. According to manufacturer documentation, the sock was 90.6% polyester, 5% X-STATIC, and 4.4% Lycra Spandex (Invista). X-STATIC is a proprietary silver-based antimicrobial material (Noble Fiber Technologies, Inc.). Lycra Spandex is a synthetic fiber with high elasticity. The sock was added over other socks if other socks were worn, inside the Pelite liner if only a Pelite liner was worn, and over the outside of the elastomeric liner if only an elastomeric liner was worn. A 1-ply Soft Sock was used because it was considered thin enough to be tolerant to the subjects for the short testing period, but thick enough for its addition to be of clinical relevance. A 1-ply Soft Sock thickness is typical of what a person adds to accommodate diurnal limb volume reduction. The subject then walked on the treadmill again for 3 minutes, followed by a brief stand under equal weight-bearing (12 seconds). The subject then sat still in a chair, without talking, for 3 minutes followed by a walk on the treadmill for 3 minutes (still with the added sock). After a brief stand on the scale under equal weight-bearing (12 seconds), the subject sat, doffed the prosthesis, and removed the extra sock. Again the subject walked on the treadmill for 3 minutes, and stood on the scale with equal weight-bearing briefly (12 seconds), then sat down and doffed the prosthesis, liner, and socks. The subject sat still for 10 minutes while bioimpedance data continued to be collected.
During testing, bioimpedance data and data from the electronic scale were viewed in essentially real time (3 seconds delay) at a 0.5 Hz sampling rate using custom Matlab (v. 7.10, MathWorks) code implemented on a PC (Latitude D620, Dell). The computer acquired the data from the host bioimpedance computer via a USB connection over the internet. The custom Matlab code processed the bioimpedance data using a Cole model [23], similar to that used by the Xitron post-processing program. This display was essential during data collection to verify that the instrumentation was functioning properly, and to identify abnormalities during data collection that needed correction, for example the subject sitting in a manner that occluded a major vein in the limb (apparent as a rapid change in limb fluid volume during sitting).
After the session, all data were processed using software supplied by the manufacturer (v.2.2, Xitron). The algorithm optimized a non-linear least square error of magnitude and phase to determine extracellular fluid resistance, using the Cole model approach described in the literature [23]. The Xitron algorithm removed data points with large contributions to the least square error. Limitations ensured that less than 25% of the data were deleted and that at least one data point was retained for every set of three adjacent frequencies. We then converted the data to extracellular fluid volume using the limb circumference and segment length measurements in a well accepted geometric limb model [24], and then expressed as a percentage of the extracellular fluid volume measured at the end of the initial 2 minutes sit interval with the prosthesis donned.
Residual limb fluid volume change from sock addition was calculated as the percentage fluid volume measured after the first walk (without the sock) minus that after the second walk (with the sock). Within the 12 seconds period after each walk, the data point at which equal weight bearing was achieved, apparent by visual inspection of the mass measurement from the digital scale, was identified and used in this calculation. Residual limb fluid volume change from sock removal was calculated as the percentage fluid volume measured after the third walk (with the sock) minus that after the fourth walk (without the sock). To present graphs of limb fluid volume change vs. time, we plotted a 10-point moving mean of the percent change in fluid volume. Since there was a time delay caused by the moving mean filter, the 10-point moving mean was moved back 5 points so as to realign it with the original data. This curve was useful to observe trends over the course of the trial though it was not used in the analysis calculations described above.
To further characterize subject’s health, on a separate day from bioimpedance testing, we conducted a series of vascular assessment tests. Tests were consistent with standard clinical protocols to evaluate vascular condition and included: orthostatic blood pressure, segmental limb pressure, ankle brachial index [25], and ambulatory strain gage plethysmography (ASGP) [29]. Tests were conducted 5-10 minutes after the subject arrived at the lab and sat quietly with the prosthesis donned. The test procedures are described below:
Orthostatic Blood Pressure
The subject’s systolic and diastolic blood pressures and heart rate were measured using electronic blood pressure measurement (HEM-775, Omron). After a baseline measurement was taken with the subject sitting comfortably, additional measurements were taken after the subject rested supine for 3 minutes, after the subject sat upright for 3 minutes, and then after the subject stood for 3 minutes. Systolic blood pressures above 140 mm Hg or diastolic above 90 mm were considered indicative of high blood pressure. Blood pressure changes greater than 20 mmHg for changes in posture were considered abnormal.
Ankle Brachial Index (ABI) and Segmental Limb Pressures
The subject rested supine on a hospital bed (PACU, Stryker Renaissance) during testing. Using a commercial segmental limb pressure measurement system (TD312 Cuff Inflator, MV10 Manifold Selector, and SC12 and SC10 cuffs, Hokanson) and a Doppler flow meter (MD6 Doppler, Hokanson), we measured blood pressures on the contralateral limb, unless the subject’s contralateral limb was amputated above the ankle, and on both limbs above the knee and at the upper thigh. Brachial arm pressure was measured on both upper limbs. The research practitioner identified blood flow changes representing systolic and diastolic pressure thresholds by using the Doppler flow system. At the ankle either the posterior tibial artery or the anterior tibial artery, whichever had the strongest Doppler signal, was used. ABI was calculated as the systolic pressure at the ankle on the non-amputated limb (if the subject was not amputated bilaterally) divided by the larger of the two brachial systolic pressures. An ABI greater than 1.3 was considered indicative of a calcified vessel, in which case another vessel in the ankle was pursued and the measurement repeated. An ABI less than 0.9 was considered indicative of more than 50% stenosis and thus arterial disease [26,27].
Ambulatory Strain Gage Plethysmography (ASGP)
Measurements were taken from the contralateral limb using a commercial ASGP system (EC6 Plethysmograph, Hokanson). Only unilateral amputee subjects were tested. An elastic band with a strain gage (Indium-Gallium) was placed just above the malleolus. The subject stood with the arms extended forward holding onto a waist high rail for support and then performed 10 deep knee bends (to approximately 60 degrees of knee flexion). We reduced the number of deep knee bends from the standard 20 described in the literature for ASGP testing [28] to ten because most of our subjects could not conduct more than ten sequential deep knee bends. The subject then stood still with equal weight bearing for at least 200 seconds. A recovery time in the strain-gage data of less than 25 seconds was considered to indicate presence of venous insufficiency [29].
RESULTS
A total of 28 participants with trans-tibial amputation, 21 male and seven female, took part in this study described above. Twenty-five had unilateral amputation and three had bilateral amputations. Eight subjects were at Medicare Functional Classification Level [30] (K-level) K-2 (limited community ambulator), thirteen were at K-3 (community ambulator), and seven were at K-4 (high level user). Subjects ranged in age from 23 to 72 years, and the mean age was 50 (s.d.=13) years. Subject mass ranged from 50.0 to 126.7 kg, with a mean of 87.8 (s.d.=20.6) kg. BMI averaged 28.2 (s.d.=6.1). Eight subjects had a BMI between 25 and 30 (overweight), and nine subjects had a BMI greater than 30 (obese). Of the 28 participants, eighteen had their limb amputation as a result of traumatic injury, seven for arterial disease, one from cancer, one from Spina Bifida, and one from Larsson’s syndrome. Eight subjects currently had diabetes (two with type 1, six with type 2). Four subjects who had their limb amputation as a result of traumatic injury had developed arterial disease since their amputation. Seven of the 28 subjects were current smokers. Two subjects were on dialysis, one had heart arrhythmia, one had congestive heart failure, and one was on lifetime antibiotics due to a citrus allergy that caused lesions on his distal residual limb. Time since amputation ranged from 1 to 49 years, with a mean of 12 (s.d.=12) years. All subjects used patellar tendon bearing socket designs except for one subject who used a total surface bearing suction socket with a one-way valve at the distal end. Twenty-two participants used elastomeric liners, and of those individuals nineteen used a locking pin and four simultaneously used a Pelite liner with an elastomeric liner. Six participants used Pelite liners without an elastomeric liner. Subject sock ply at the outset of testing averaged 2.8 (s.d.=2.5) and ranged from 0 to 8 ply. We did not measure the thickness of each sock but instead used subject self reports of ply values. We began tests between 9:00 am and 12:00 noon on eighteen subjects, and between 12:01 pm and 1:30 pm on ten subjects.
An additional subject was tested who met the inclusion criteria but the protocol for her test session was modified from above because of concerns the original protocol would induce discomfort. For this subject, the first and fourth walking intervals on the protocol were conducted with an additional sock (3-ply cotton provided by the subject), while the second and third walking intervals were conducted without the additional sock. Thus the ordering of her sock addition/removal was reversed from the other subjects. The subject was a 60 year old female who had her limb amputation (unilateral) as a result of traumatic injury two years prior. She was a K-2 level ambulator, of mass 65.0 kg and BMI of 24.6. She was a former diabetic and did not smoke or have arterial disease. She used a patellar tendon bearing socket and elastomeric liner with locking pin. She put on a total of 8 sock ply in the morning and typically did not add socks during the day. Testing was conducted during morning hours. We present results from this subject as a case study at the end of the results, separate from the rest of the subjects we tested.
For the 28 subjects, when the sock was added, residual limb fluid volume decreased for 22 of the 28 subjects and increased for six of the subjects. The percent fluid volume change from sock addition ranged from −4.0% to 0.8%, and the mean change was −0.9 (s.d.=1.3)%. When the sock was removed, fluid volume increased for eighteen of the 28 subjects, decreased for eight of the subjects, and did not change for two of the subjects. The percent fluid volume change after sock removal ranged from −1.2% to 2.8%, and the mean change was 0.5 (s.d.=0.8)%. Bar graphs of percent fluid volume change for sock addition and sock removal are shown in FIGURE 2.
FIGURE 2. Bar charts of percent residual limb fluid volume change.
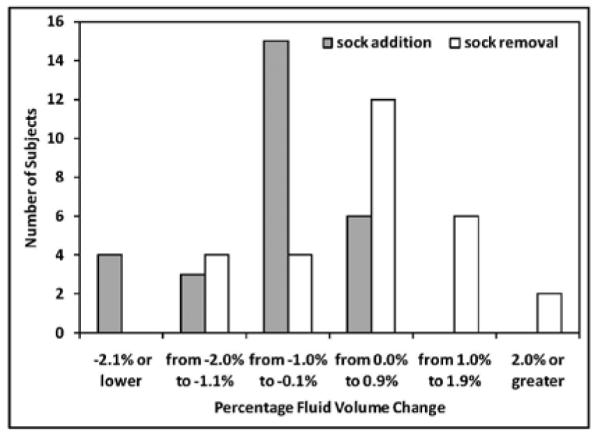
The number of subjects for different ranges of percent fluid volume change for sock addition (gray bars) and sock removal (white bars) are shown.
Linear least-squares fits to plots of percent fluid volume change vs. residual limb cross-sectional area for the 28 subjects showed a low correlation. The correlation coefficient for sock addition was 0.03, and the correlation coefficient for sock removal was 0.3. Thus even though the same size sock (Soft Sock 1-ply) was used in all trials, subjects with smaller residual limbs did not show larger percent fluid volume changes than subjects with larger limbs or vice-versa.
The percent fluid volume change for sock addition was not of comparable magnitude to that for sock removal. Eighteen of the 28 subjects experienced a greater loss of limb fluid volume after sock addition than gain after sock removal. Ten subjects experienced less loss of limb fluid volume after sock addition than gain after sock removal. The range of the ratio of percent fluid volume loss from sock addition to percent fluid volume gain from sock removal, defined here as the AR ratio (Add/Remove ratio), was −8.3 to 12.0, excluding two subjects whose fluid volume change upon sock removal was 0.0. The mean ratio was 0.0 (s.d.=3.7). The ratio was less than 0.0 for part of the population because some subjects demonstrated fluid volume loss upon both sock addition and sock removal, and some showed fluid volume gain upon both sock addition and sock removal. These two groups thus had ratios less than 0.0. The mean ratio of absolute percent fluid volume change from sock addition to that from sock removal was 2.3 (s.d.=2.7), excluding the two subjects whose fluid volume change upon sock removal was 0.0 (and thus had AR ratios less than −10.0 ).
We categorized the subjects into four groups based upon the directions of their fluid volume changes. Group 1 members (n=9) were defined as subjects who reduced or did not change in fluid volume, both when the sock was added and when it was removed. They had a gradual decrease in limb fluid volume over the data collection session (FIGURE 3a). Group 2 members (n=13) were defined as subjects who decreased in fluid volume when the sock was added and increased in fluid volume when it was removed (FIGURE 3b). These subjects demonstrated the expected directions of limb fluid volume change for sock addition and sock removal. Group 3 members (n=5) were defined as subjects who increased in fluid volume, both when the sock was added and when it was removed. They had a gradual increase in fluid volume over the session (FIGURE 3c). The Group 4 member (n=1) was defined as the subject who increased in fluid volume when the sock was added and decreased when it was removed. This subject demonstrated opposite of the expected directions of limb fluid volume change for sock addition and sock removal (FIGURE 3d).
FIGURE 3. a-d. Example results for each group.
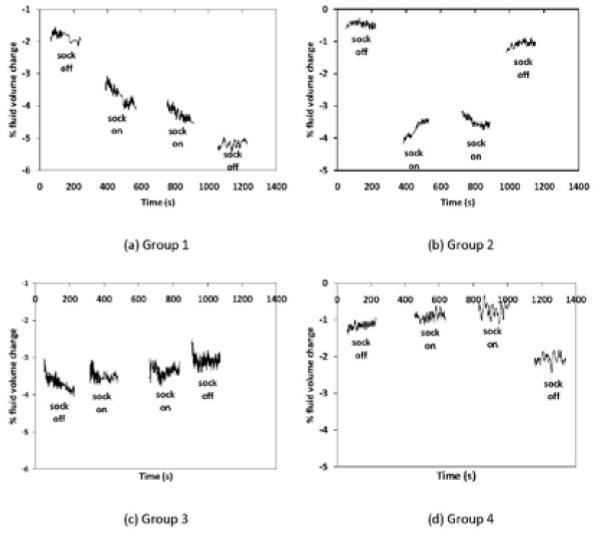
Exemplary data for one subject from each group are presented. For clarity, only data during walks are shown. 10-point moving mean plots are presented. (a) Group 1: reduction in limb fluid volume both when the sock was added and removed; (b) Group 2: reduction in limb fluid volume when the sock was added and increase in limb fluid volume when it was removed; (c) Group 3: increase in limb fluid volume both when the sock was added and removed; (d) Group 4: increase in limb fluid volume when the sock was added and decrease in limb fluid volume when it was removed.
Results from the vascular tests and subject histories showed that 11 subjects had arterial disease and 12 had high blood pressure. Nineteen of the 28 subjects underwent ASGP testing, and eight had venous insufficiency. Subjects were not tested if they had bilateral amputation (n=3), could not squat (n=1), died or had an above-knee amputation before the tests were completed (n=2), or were not available for the test (n=3). Ten subjects did not have arterial disease, high blood pressure, diabetes, or another major medical disease, thus were considered in good health. We considered subjects in good health if they had venous insufficiency but not arterial disease, high blood pressure, diabetes, or another major medical condition because the ASGP measurement might have reflected local venous obstruction induced by traumatic injury [31], ASAGP testing was conducted on the contralateral limb not the residual limb, and because we did not conduct ASGP testing on all subjects. Of those ten subjects in good health, two had BMIs between 25 and 30, one had BMI greater than 30, and one was a smoker.
We conducted an exploratory analysis to investigate how subject health status related to bioimpedance results. The percentage fluid volume changes upon sock addition and sock removal were plotted by group (FIGURE 4), with Groups 1 to 4 as defined above. Within each group subject data were ordered from highest to lowest AR ratio. The table to the right of the plot identifies if the subject was: in good health (no arterial disease, high blood pressure, diabetes, or other major disease) (g), had arterial disease (a), venous insufficiency (v), high blood pressure (h), diabetes (d), other major disease (z), a BMI between 25 and 30 (overweight) (o) or over 30 (obese) (O), or currently a smoker (s). The last column lists the reason for amputation (R): vascular disease (vd), trauma (t), spina bifida (b), Larsson’s syndrome (L), or cancer (c).
FIGURE 4. Subject groups and health status.
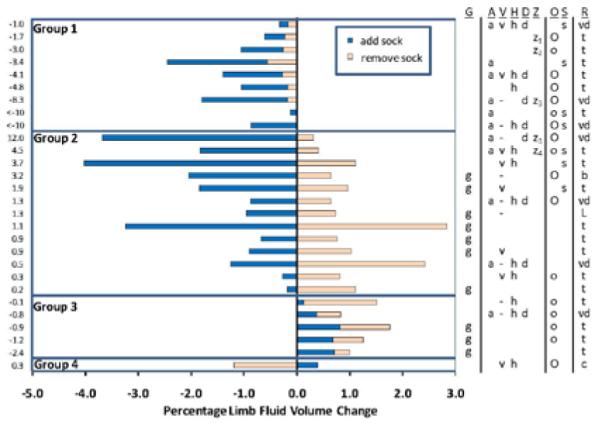
Percent limb fluid volume changes for sock addition (dark blue bars) and sock removal (light orange bars) are shown for all 28 subjects. Groups 1 to 4 were defined based on the directions of fluid volume change, as described in the text. The numbers to the left of the graph are the AR ratios, i.e. quotients of percent fluid volume change upon sock addition divided by the percent fluid volume change upon sock removal. The table to the right of the bar graph indicates: subjects in good health (g), presence of a health condition: a= arterial disease or peripheral vascular disease; v= venous insufficiency; h= high blood pressure; d= diabetic; z= other condition (z1= heart arrhythmia; z2 = lifetime antibiotics because of residual limb infection; z3= renal failure and dialysis; z4=congestive heart failure). A ‘-’ indicates that ASGP testing was not conducted. People who were overweight (25<BMI<30) (o) and obese (BMI>30) (O) are indicated in the ‘O’ column, and smokers (s) are indicated in the ‘S’ column. Reasons for amputation (R) include trauma (t), vascular (arterial) disease (vd), spina bifida (b), Larsson’s syndrome (L), cancer (c).
Results showed noteworthy trends. Subjects in Group 2 with high AR ratios (all subjects in Group 2 had AR ratios > 0) and subjects in Group 1 tended to have arterial disease (FIGURE 4), and some of them also had venous insufficiency. They also tended to be obese and smokers. Subjects in Group 2 with low AR ratios, subjects in Group 3, and the subject in Group 4 tended to be non-smokers and either healthy individuals without complications or individuals without arterial problems. Several subjects in Group 2 with low AR ratios and the subject in Group 4 had venous insufficiency but not arterial disease. Subjects in Group 3 tended to be overweight but not obese. Presence of high blood pressure did not appear to favor any group.
We did not observe trends in the results for Pelite liner users compared with elastomeric liner users. AR ratios and fluid volume changes over the session were not distinctly different for the two groups. Similarly, we did not observe a trend relating number of sock ply worn to either AR ratio or to fluid volume change over the session. Linear fits to plots of percent fluid volume change from adding socks or removing socks to percent fluid volume change over the 10-minute interval after doffing showed weak correlations. Correlation coefficients were 0.3 for sock addition and 0.3 for sock removal. The subject who was tested using a different protocol from the other subjects (see Methods) underwent a 3.4% fluid volume loss when the sock (3-ply cotton) was added and a 2.1% fluid volume gain when the sock was removed. Her AR ratio was 1.6. Her vascular tests revealed that she had high blood pressure and venous insufficiency in the contralateral limb but no other abnormalities. Her results were comparable to other individuals in the upper half of Group 2, except that her percent fluid volume changes were greater, possibly because she added a 3 ply rather than a 1 ply sock.
DISCUSSION
The purpose of this study was to determine if residual limb fluid volume was affected by adding or removing socks, and if the changes for adding a sock were of comparable magnitude but opposite in direction to those from removing the sock. We also explored how the results related to subject health.
In this study we defined residual limb fluid volume change as the measurement made with the bioimpedance analysis instrument used. Bioimpedance measures electrical resistance in soft tissue and, because fluid is such a dominant constituent and is of relatively low resistance, fluid volume dominates the measurement. Thus we considered appropriate to use the term “residual limb fluid volume change” to describe the result from the bioimpedance measurement.
Though the exact relationship between residual limb fluid volume change measured using bioimpedance analysis and total residual limb volume change is not known, we can summarize reports from the literature on total limb volume change. In eight trans-tibial amputee subjects with mature limbs, using an optical scanner, investigators reported median absolute value diurnal volume changes of 0.4% and median absolute volume changes over 5 to 25 week intervals of 1.3% [2]. For six subjects assessed at 2-week intervals, median absolute limb volume changes were 1.2% [19]. Fernie indicated in his study that transtibial amputee subjects had difficulty donning the socket when residual limb volume increased by 3% to 5% [32]. Volume reductions during the post-operative period (12-18 months after amputation [33]) have been recorded in numerous studies [32,34,35,36,37] and, as expected, were typically much larger than those measured in mature limbs listed above, ranging up to 35% over several months. Median absolute fluid volume changes measured in the present study for sock addition or sock removal were 0.8%. Thus the magnitude of fluid volume change measured with bioimpedance analysis in the present study was in the range of limb volume changes reported in the literature for diurnal and shorter term time intervals measured using other measurement modalities. However, it remains to be determined the actual quantitative correspondence between limb fluid volume and total limb volume.
Sources of error in the experiments
The electrode configuration used in this study measured only from the proximal and mid-limb region of the residual limb, between the voltage-sensing electrodes (FIGURE 1). The distal end of the limb was not monitored. Measurement from only a portion of the residual limb is a limitation of the electrode configuration used. Thus distal swelling, if it occurred during this study, was not included in the bioimpedance measurement. However, the proximal and central regions were considered of clinical relevance since for a properly fit prosthesis this is where much of the mechanical support is provided by the socket for weight bearing. Oversized sockets may cause distal end bearing and thus minimal mechanical support in the proximal and central regions. It is unknown how excessive distal end bearing would affect bioimpedance results. In the present study, through clinical examination we ensured subjects did not distal end bear excessively, i.e., greater than approximately 10% of their body weight. We did not include in our analysis bioimpedance data from time points that we expected were strongly affected by factors other than residual limb fluid volume change. For example, we did not consider fluid volume differences between sitting and standing because different tensions could have been induced in the skin between the electrodes for the two conditions. Inconsistent skin tension might have affected electrode positions and thus the bioimpedance measured. We only compared data from different time points within a session collected during a consistent posture, i.e., standing with equal weight bearing. We also calculated limb fluid volume change over the course of a 10-minute interval after the prosthesis was doffed, with the subject sitting still in a chair with the limb in a dependent (downward) position.
Application to clinical treatment
There was a lot of variability in the bioimpedance results from different subjects. Though we added the same sock thickness on each subject in the study, we did not see the same amount of fluid volume change or percentage fluid volume changes across the population. Thus we cannot set definitive quantitative rules of how a single sock (Soft Sock 1-ply) added to the residual limb affects a person’s limb fluid volume. Two possible reasons for why there was not a consistent fluid volume change across all subjects: (1) Subject initial socket fits were different. For some subjects, part of the added sock may have filled local vacant spaces within the socket, adding localized pressure not uniform pressure to limb soft tissues, while for other subjects sock addition may have caused a moderate or large pressure increase over the entire residuum. (2) Subjects had different limb soft tissue mechanical consistencies. Thus even though sock thickness was the same, the stress induced on the soft tissues and the fluid volume changes induced were not the same for all subjects.
Fluid volume change for sock addition was not equal to fluid volume change for sock removal. This result suggests that care must be taken during fitting sessions. Adding and removing socks on a patient during a fitting session might change the patient’s limb fluid volume. In other words, changes in limb fluid volume might be accentuated by the history of sock change. The practitioner needs to be mindful of these changes during fitting. Adding a very thick sock is discouraged, particularly for patients with compromised arterial drive, diabetes, or who are obese or smoke as this sock may cause much limb fluid volume reduction that will not be easily recovered.
Differences in percent fluid volume change from sock addition and sock removal seem to be linked with the subject’s vascular condition. Subjects with arterial vascular complications tended to lose fluid volume upon sock addition, and recovered minimally or tended to continue to reduce in fluid volume when the sock was removed (Group 1, Group 2 with high AR ratios, FIGURE 4). These subjects likely had reduced transport from the arterial vasculature into the interstitial space. The net effect was a loss in limb fluid volume over the course of the test session.
Because ASGP measurements were made on only nineteen of the 28 participants, we cannot determine if venous insufficiency dominated one group. Further, venous insufficiency, particularly if it results from local trauma, can be present in one limb but not the other, thus ASGP results from the contralateral limb do not necessarily reflect the residual limb. The result that some subjects in Group 2 with low AR ratios had venous insufficiency but not arterial disease is consistent with the interpretation that subjects who had poor venous flow experienced low residual limb fluid volume loss upon sock addition. However, further research is needed to verify this interpretation and to understand if presence of venous disease offsets the detrimental effects of arterial disease so as to enhance limb fluid balance.
The subject in Group 4 enlarged upon sock addition and reduced in fluid volume upon sock removal. This result is contrary to expectation. This subject may have been at high risk of venous occlusion, as supported by ASGP results indicating presence of venous insufficiency. The added sock may have increased interface pressures, particularly over the posterior vasculature, and as a result may have occluded venous return but not arterial inflow. The net effect may have been to increase limb fluid volume when a sock was added and reduce it when removed. This interpretation must be taken with caution, however, given the limitations described above in ASGP measurement. It is clear that an independent means for identifying venous insufficiency in the residual limb is needed. The reason for the limb fluid volume increase upon sock addition and decrease upon sock removal for the Group 4 subject is paradoxical.
Smoking and obesity are considered to have a detrimental effect on the vasculature, causing a loss of vessel compliance [38,39]. A loss of vascular compliance would be expected to reduce arterial drive, resulting in a reduction in arterial to interstitial fluid transport. This phenomenon might explain why smokers and people with obesity in this study, in general, underwent a reduction in limb fluid volume over the course of the test session (i.e. upper part of FIGURE 4). Similarly, presence of diabetes is expected to affect the vasculature and reduce arterial drive. Loss of pressure-induced vasodilation has been demonstrated in people with diabetes [40,41,42]. This phenomenon might explain why subjects with diabetes, in general, also underwent a reduction in limb fluid volume over the test session (FIGURE 4). A next step is to quantify severity of diabetes, for example using glycosylated hemoglobin testing (HbA1c), and investigate a correlation with residual limb fluid volume change.
High blood pressure, in general, would be expected to increase arterial to interstitial fluid transport and thus induce edema over the session, but presence of high blood pressure in our subjects did not appear to be related to bioimpedance results. Because of the many different physiologic mechanisms and factors contributing to elevated blood pressure, the manifestation of peripheral edema is not universal in people diagnosed with hypertension. Additionally, many subjects with diagnosis of hypertension are treated with medications, which might have mitigated the edema-prone effects of high blood pressure. Further, high blood pressure typically does not represent itself alone without other health issues, and these other issues might have complicated impact on limb fluid volume change.
Presence of a heart conditions and dialysis treatment would be expected to affect limb fluid transport as well. There were too few subjects with these conditions in the present study to draw meaningful conclusions about their impact on limb fluid volume control after sock addition or removal. A separate and larger study targeting subject populations with these conditions is needed.
Because of the lack of a one-to-one correlation between vascular status and bioimpedance results, it is likely that other factors besides vascular status affected limb fluid volume control. The results from the present study indicate that the subject’s vascular condition is a relevant factor, but more research is needed to identify and understand how other factors related to the subject’s characteristics affect limb fluid volume control. Socket fit might affect the results because it affects local pressure and shear stress changes induced from sock addition. The relationships between socket design, interface stress distribution, and limb fluid volume change are currently unknown. In addition, it would be important to identify the level of importance of each factor. Such an effort would help practitioners and patients to better manage the complex challenge of limb fluid volume management and its effect on socket fit.
Interestingly, three of the five subjects in the present study who demonstrated limb fluid volume increases over the session were deemed in good health as per the vascular tests and other information used here (FIGURE 4). Non-amputated limbs of healthy people also demonstrate this result [43,44,45], as did the contralateral limb of a person with unilateral amputation [46]. On normal limbs, fluid volume increases over time are considered a result of gravity pulling fluid distally towards the feet during standing and walking. At night, while supine, limb fluid volume reduces and returns back to normal. Because of the continual stress applied by the prosthetic socket on the residual limb during standing and walking and thus the increase in interstitial fluid pressure, people with limb amputation would be expected to undergo limb fluid volume decreases over time, not increases. Why then did these three healthy subjects experience limb fluid volume increases? It may be that the effects of gravity towards increasing limb fluid volume outweighed the influence of socket interface pressures to decrease it. Two of the three healthy subjects and four of the five subjects in Group 3 were overweight. People who are overweight tend to build up fluid in their lower limbs. Increased fat may increase pressure in the legs and contribute to edema. It is also possible that the subjects’ physiological control systems adapted since amputation so as to induce limb fluid volume increases during activity, consistent with normal non-amputated limbs. Neural and endocrine factors may have played a role. Whatever the source, the result that limb fluid volume increases over time overshadowed the influence of sock addition and removal for some of the healthy subjects is surprising and worthy of further investigation.
The subject who underwent a different protocol (reversed order of sock addition/removal; 3 ply cotton sock added/removed instead of 1 ply Soft Sock) demonstrated directions of volume change and AR ratio results consistent with Group 2 subjects. However, her absolute volume changes were much larger (3.4% loss upon sock addition; 2.1% gain upon sock removal) than the other subjects. We suspect this difference reflected her adding/removing a thicker sock (3 ply vs. 1 ply). Dependence of limb volume change on thickness of the added sock should be investigated.
Application to volume control devices
The results from this investigation point to caution in implementing automatic volume control systems. If material is to be added into the socket to accommodate limb volume loss, for example fluid-filled or air-filled inserts, then care must be taken to ensure that the amount of fluid or air added is not excessive such that it further reduces limb volume. Some subjects might not recover fluid that is displaced out of the residual limb. Products that adjust their size over time according to the pressure they put on the limb, e.g. the Active Volume Control System (Simbex), may be beneficial in that the fluid-filled bladders reduce in size during low activity and thus allow recovery of fluid back into the residual limb. However, this interpretation is conjecture and needs research investigation. It would also be worthwhile to investigate the long term effects of these technologies on residual limb fluid volume and compare with results using traditional sock accommodation strategies (e.g. sock changes).
Subjects who showed a decrease in limb fluid volume without recovery when the sock was removed (Group 1, Group 2 with large AR ratios) may be good candidates for elevated vacuum. Elevated vacuum applies negative pressure to the socket, unlike the positive pressure applied here by the added socks. Elevated vacuum might elevate limb fluid volume during walking [47,48,49,50,51]. If timed such that greater vacuum was applied during activity, elevated vacuum may help to stabilize limb fluid volume over time. It would be interesting to investigate the long-term effects of elevated vacuum and other compensation strategies on residual limb fluid volume measured by bioimpedance. Does elevated vacuum cause fluid volume increases over the long-term on these individuals?
Bioimpedance analysis as a diagnostic tool
Potentially the bioimpedance analysis instrumentation implemented in this research could be extended into a diagnostic tool to help a practitioner determine if an accommodation strategy or volume control algorithm is needed, and to prescribe it on a patient-by-patient basis. Who needs elevated vacuum and who does not? What volume control protocol should be used and why? We would suspect that Group 1 and Group 2 subjects with high AR ratios are good candidates for elevated vacuum, and would do better with than without it. This interpretation is still conjecture at this point, and will need to be tested in a controlled clinical study with a large sample before it is applied to clinical practice.
Subjects who showed an increase in limb fluid volume over time that outweighed the influence of sock addition and removal might be prone to edema and thus would probably not be good candidates for elevated vacuum. It is suspected that elevated vacuum would worsen their diurnal limb fluid volume increase, particularly for patients with slow overall fluid transport in their residual limb. This interpretation is conjecture as well and needs careful clinical testing.
Over time as disease progresses, subjects in Group 2 with arterial disease would be expected to increase their AR ratios and then eventually move into Group 1 (negative AR ratio). Alternatively, if they developed venous disease, these individuals would be expected to decrease their AR ratios and move towards Group 3. At this point we have not collected data over long enough time intervals to be able to determine if these trends occur or not.
Future research
In addition to the investigations suggested above, future research needs to be directed towards longer term monitoring. What are residual limb fluid volume changes over the course of a day, and does sock addition cause a long-lasting alteration in limb fluid volume? How do results relate to subject comfort and satisfaction with the prosthetic prescription? How does activity influence the results? What is the influence of patient lifestyle changes, treatments, medications, diet, or other variables on limb fluid balance? If these questions are answered and if a relationship between long-term and short-term fluid volume changes can be established then limb fluid volume change technology could be used as a tool in the clinic to help a practitioner characterize a patient’s limb fluid volume control health and facilitate prosthetic prescription.
ACKNOWLEDGEMENTS
We gratefully acknowledge research support provided by the Orthotic and Prosthetic Education and Research Foundation (OPERF) within the American Academy of Orthotists and Prosthetists (AAOP) and the National Institutes of Health (R01HD60585).
REFERENCES
- 1.Lilja M, Johansson S, Oberg T. Relaxed versus activated stump muscles during casting for tran-tibial prostheses. Prosthet Orthot Int. 1999;23:13–20. doi: 10.3109/03093649909071606. [DOI] [PubMed] [Google Scholar]
- 2.Sanders JE, Zachariah SG, Jacobsen AK, Fergason JR. Changes in interface pressures and shear stresses over time on trans-tibial amputee subjects ambulating with prosthetic limbs: comparison of diurnal and six-month differences. J Biomech. 2005;38(8):1566–1573. doi: 10.1016/j.jbiomech.2004.08.008. [DOI] [PubMed] [Google Scholar]
- 3.Goldstein B, Sanders J. Skin response to repetitive mechanical stress: A new experimental model in pig. Arch Phys Med Rehabil. 1998;79(3):265–272. doi: 10.1016/s0003-9993(98)90005-3. [DOI] [PubMed] [Google Scholar]
- 4.Van Loan MD, Withers P, Matthie J, Mayclin PL. Use of bioimpedance spectroscopy to determine extracellular fluid, intracellular fluid, total body water, and fat-free mass. Basic Life Sci. 1993;60:67–70. doi: 10.1007/978-1-4899-1268-8_13. [DOI] [PubMed] [Google Scholar]
- 5.Organ LW, Bradham GB, Gore DT, Lozier SL. Segmental bioelectrical impedance analysis: theory and application of a new technique. J Appl Physiol. 1994;77(1):98–112. doi: 10.1152/jappl.1994.77.1.98. [DOI] [PubMed] [Google Scholar]
- 6.Fuller NJ, Hardingham CR, Graves M, Screaton N, Dixon AK, Ward LC, Elia M. Predicting composition of leg sections with anthropometry and bioelectrical impedance analysis, using magnetic resonance imaging as reference. Clin Sci (Lond) 1999;96(6):647–57. [PubMed] [Google Scholar]
- 7.Salinari S, Bertuzzi A, Mingrone G, Capristo E, Scarfone A, Greco AV, Heymsfield SB. Bioimpedance analysis: a useful technique for assessing appendicular lean soft tissue mass and distribution. J Appl Physiol. 2003;94(4):1552–1556. doi: 10.1152/japplphysiol.00571.2002. [DOI] [PubMed] [Google Scholar]
- 8.Dittmar M. Reliability and variability of bioimpedance measures in normal adults: effects of age, gender, and body mass. Am J Phys Anthropol. 2003;122(4):361–370. doi: 10.1002/ajpa.10301. [DOI] [PubMed] [Google Scholar]
- 9.Andreoli A, Melchiorri G, De Lorenzo A, Caruso I, Sinibaldi Salimei P, Guerrisi M. Bioelectrical impedance measures in different position and vs dual-energy X-ray absorptiometry (DXA) J Sports Med Phys Fitness. 2002;42(2):186–89. [PubMed] [Google Scholar]
- 10.de Vries PM, Meijer JH, Vlaanderen K, Visser V, Oe PL, Donker AJ, Schneider H. Measurement of transcellular fluid shifts during haemodialysis. Part 2. In vitro and clinical evaluation. Med Biol Eng Comput. 1989;27(2):152–158. doi: 10.1007/BF02446224. [DOI] [PubMed] [Google Scholar]
- 11.Zhu F, Schneditz D, Wang E, Martin K, Morris AT, Levin NW. Validation of changes in extracellular volume measured during hemodialysis using a segmental bioimpedance technique. ASAIO J. 1998;44(5):M541–M545. doi: 10.1097/00002480-199809000-00045. [DOI] [PubMed] [Google Scholar]
- 12.Shulman T, Heidenheim AP, Kianfar C, Shulman SM, Lindsay RM. Preserving central blood volume: changes in body fluid compartments during hemodialysis. ASAIO J. 2001;47(6):615–618. doi: 10.1097/00002480-200111000-00009. [DOI] [PubMed] [Google Scholar]
- 13.Donadio C, Consani C, Ardini M, Bernabini G, Caprio F, Grassi G, Lucchesi A, Nerucci B. Estimate of body water compartments and of body composition in maintenance hemodialysis patients: comparison of single and multifrequency bioimpedance analysis. J Ren Nutr. 2005;15(3):332–344. doi: 10.1016/j.jrn.2005.04.001. [DOI] [PubMed] [Google Scholar]
- 14.Fuller NJ, Hardingham CR, Graves M, Screaton N, Dixon AK, Ward LC, Elia M. Predicting composition of leg sections with anthropometry and bioelectrical impedance analysis, using magnetic resonance imaging as reference. Clin Sci (Lond) 1999;96(6):647–657. [PubMed] [Google Scholar]
- 15.Segal KR, Burastero S, Chun A, Coronel P, Pierson RN, Jr, Wang J. Estimation of extracellular and total body water by multiple-frequency bioelectrical-impedance measurement. Am J Clin Nutr. 1991;54(1):26–29. doi: 10.1093/ajcn/54.1.26. [DOI] [PubMed] [Google Scholar]
- 16.Wotton MJ, Thomas BJ, Cornish BH, Ward LC. Comparison of whole body and segmental bioimpedance methodologies for estimating total body water. Ann N Y Acad Sci. 2000;904:181–86. doi: 10.1111/j.1749-6632.2000.tb06444.x. [DOI] [PubMed] [Google Scholar]
- 17.Armstrong LE, Kenefick RW, Castellani JW, Riebe D, Kavouras SA, Kuznicki JT, Maresh CM. Bioimpedance spectroscopy technique: intra-, extracellular, and total body water. Med Sci Sports Exerc. 1997;29(12):1657–1663. doi: 10.1097/00005768-199712000-00017. [DOI] [PubMed] [Google Scholar]
- 18.Miyatani M, Kanehisa H, Masuo Y, Ito M, Fukunaga T. Validity of estimating limb muscle volume by bioelectrical impedance. J Appl Physiol. 2001;91(1):386–394. doi: 10.1152/jappl.2001.91.1.386. [DOI] [PubMed] [Google Scholar]
- 19.Zachariah SG, Saxena R, Fergason JR, Sanders JE. Shape and volume change in the transtibial residuum over the short term: preliminary investigation of six subjects. J Rehabil Res Dev. 2004;41(5):683–694. doi: 10.1682/jrrd.2003.10.0153. [DOI] [PubMed] [Google Scholar]
- 20.Keys A, Fidanza F, Karvonen MJ, Kimura N, Taylor HL. Indices of relative weight and obesity. J Chronic Dis. 1972;25(6):329–343. doi: 10.1016/0021-9681(72)90027-6. [DOI] [PubMed] [Google Scholar]
- 21.Mozumdar A, Roy SK. Method for estimating body weight in persons with lower limb amputation and its implication for their nutritional assessment. Am J Clin Nutr. 2004;80:868–875. doi: 10.1093/ajcn/80.4.868. [DOI] [PubMed] [Google Scholar]
- 22.Grimnes S, Martinsen OG. Bioimpedance and Bioelectricity Basics. 2nd ed Elsevier Ltd; Amsterdam: 2008. [Google Scholar]
- 23.De Lorenzo A, Andreoli A, Matthie J, Withers P. Predicting body cell mass with bioimpedence by using theoretical methods: a technological review. J Appl Physiol. 1997;82(5):1542–1558. doi: 10.1152/jappl.1997.82.5.1542. [DOI] [PubMed] [Google Scholar]
- 24.Fenech M, Jaffrin MY. Extracellular and intracellular volume variations during postural change measured by segmental and wrist-ankle bioimpedance spectroscopy. IEEE Trans Biomed Eng. 2004;51(1):166–175. doi: 10.1109/TBME.2003.820338. [DOI] [PubMed] [Google Scholar]
- 25.Inter-society consensus for the management of PAD Clement D, editor. Diagnosis and evaluation of peripheral artery disease. Discovery London and TASC II. 2008 http://www.tasc-2-pad.org/upload/SSRubriqueProduit/Fichier2/963.pdf.
- 26.Adragao T, Pires A, Branco P, Castro R, Oliveira A, Nogueira C, Bordalo J, Curto JD, Prata MM. Ankle-brachial index, vascular calcifications and mortality in dialysis patients. Nephrol Dial Transplant. 2011 May 6; doi: 10.1093/ndt/gfr233. Epub. [DOI] [PubMed] [Google Scholar]
- 27.Potier L, Abi Khalil C, Mohammedi K, Roussel R. Use and utility of ankle brachial index in patients with diabetes. Eur J Vasc Endovasc Surg. 2011;41:110–116. doi: 10.1016/j.ejvs.2010.09.020. [DOI] [PubMed] [Google Scholar]
- 28.Struckmann JR. Assessment of the venous muscle pump function by ambulatory strain gauge plethysmography. Danish Medical Bulletin. 1993;40(4):460–477. [PubMed] [Google Scholar]
- 29.Nicolaides AN. Investigation of chronic venous insufficiency. A consensus statement. Circulation. 2000;102(20):E126–E163. doi: 10.1161/01.cir.102.20.e126. [DOI] [PubMed] [Google Scholar]
- 30.Medicare region C durable medical equipment prosthetics orthotic supplier (DMEPOS) manual. Palmetto GBA; Columbia (SC): 2005. pp. 53.5–53.6. [Google Scholar]
- 31.Scott TE, LaMorte WW, Gorin DR, Menzoian JO. Risk factors for chronic venous insufficiency: a dual case-control study. J Vasc Surg. 1995;22(5):622–628. doi: 10.1016/s0741-5214(95)70050-1. [DOI] [PubMed] [Google Scholar]
- 32.Fernie GR, Holliday PJ. Volume fluctuations in the residual limbs of lower limb amputees. Arch Phys Med Rehabil. 1982;63(4):162–165. [PubMed] [Google Scholar]
- 33.American Academy of Orthotists and Prosthetists Post-Operative Management of the Lower Extremity Amputee: Official Findings of the Consensus Conference; American Academy of Orthotists and Prosthetists; 2004. [Google Scholar]
- 34.Wilson AB, Jr, Schuch CM, Nitschke RO. A variable volume socket for below-knee prostheses. Clin Prosthet Orthot. 1987;11(1):11–19. [Google Scholar]
- 35.Lilja M, Oberg T. Proper time for definitive transtibial prosthetic fitting. J Prosthet Orthot. 1997;9(2):90–95. [Google Scholar]
- 36.Liedberg E, Hommerberg H, Persson BM. Tolerance of early walking with total contact among below-knee amputees - a randomized test. Prosthet Orthot Int. 1983;7(2):91–95. doi: 10.3109/03093648309166980. [DOI] [PubMed] [Google Scholar]
- 37.Golbranson FL, Wirta RW, Kuncir EJ, Lieber RL, Oishi C. Volume changes occurring in postoperative below-knee residual limbs. J Rehabil Res Dev. 1988;25(2):11–18. [PubMed] [Google Scholar]
- 38.Kool MJ, Hoeks AP, Struijker-Boudier HA, Reneman RS, Van Bortel LM. Short- and long-term effects of smoking on arterial wall properties in habitual smokers. J Am Coll Cardiol. 1993;22(7):1881–1886. doi: 10.1016/0735-1097(93)90773-t. [DOI] [PubMed] [Google Scholar]
- 39.Toto-Moukouo JJ, Achimastos A, Asmar RG, Hugues CJ, Safar ME. Pulse wave velocity in patients with obesity and hypertension. Am Heart J. 1986;112:136–140. doi: 10.1016/0002-8703(86)90691-5. [DOI] [PubMed] [Google Scholar]
- 40.Koitka A, Abraham P, Bouhanick B, Sigaudo-Roussel D, Demiot C, Saumet JL. Imaired pressure-induced vasodilation at the foot in young adults with type I diabetes. Diabetes. 2004;53:721–725. doi: 10.2337/diabetes.53.3.721. [DOI] [PubMed] [Google Scholar]
- 41.McLellan K, Petrofsky JS, Grenith Zimmerman JD, Lohman E, Prowse M, Schwab E, Lee S. The influence of environmental temperature on the response of the skin to local pressure: the impact of aging and diabetes. Diabetes Technol Therapeutics. 2009;11(12):791–798. doi: 10.1089/dia.2009.0097. [DOI] [PubMed] [Google Scholar]
- 42.Fromy B, Sigaudo-Roussel D, Gaubert-Dahan ML, Rousseau P, Abraham P, Benzoni D, Berrut G, Saumet JL. Aging-associated sensory neuropathy alters pressure-induced vasodilation in humans. J Invest Dermatol. 2010;130(3):849–855. doi: 10.1038/jid.2009.279. [DOI] [PubMed] [Google Scholar]
- 43.Ludbrook J, Loughlin J. Regulation of volume in postarteriolar vessels of the lower limb. Am Heart J. 1964;67:493–507. doi: 10.1016/0002-8703(64)90096-1. [DOI] [PubMed] [Google Scholar]
- 44.Stick C, Stöfen P, Witzleb E. On physiological edema in man’s lower extremity. Eur J Appl Physiol Occup Physiol. 1985;54(4):442–449. doi: 10.1007/BF02337192. [DOI] [PubMed] [Google Scholar]
- 45.Stick C, Jaeger H, Witzleb E. Measurements of volume changes and venous pressure in the human lower leg during walking and running. J Appl Physiol. 1992;72(6):2063–2068. doi: 10.1152/jappl.1992.72.6.2063. [DOI] [PubMed] [Google Scholar]
- 46.Sanders JE, Harrison DS, Allyn KJ, Myers TR. Clinical utility of in-socket residual limb volume change measurement: case study results. Prosthet Orthot Int. 2009;33(4):378–390. doi: 10.3109/03093640903214067. [DOI] [PMC free article] [PubMed] [Google Scholar]
- 47.Caspers CA. Hypobarically-controlled artificial limb for amputees. US patent number. :5, 549, 709.
- 48.Street GM. Vacuum suspension and its effect on the limb. Orthop Tech. 2007;4:1–4. [Google Scholar]
- 49.Board WJ, Street GM, Caspers C. A comparison of trans-tibial amputee suction and vacuum socket conditions. Prosthet Orthot Int. 2001;25(3):202–9. doi: 10.1080/03093640108726603. [DOI] [PubMed] [Google Scholar]
- 50.Goswami J, Lynn R, Street G, Harlander M. Walking in a vacuum-assisted socket shifts the stump fluid balance. Prosthet Orthot Int. 2003;27(2):107–13. doi: 10.1080/03093640308726666. [DOI] [PubMed] [Google Scholar]
- 51.Gerschutz MJ, Denune JA, Colvin JM, Schober G. Elevated vacuum suspension influence on lower limb amputee’s residual limb volume at different vacuum pressure settings. J Prosthet Orthot. 2010;22(4):252–256. [Google Scholar]