Abstract
Purpose
To determine if there is a systematic difference in central corneal thickness (CCT) measured using anterior segment optical coherence tomography (AS-OCT) as compared to ultrasound pachymetry.
Design
Prospective observational study
Methods
Consecutive subjects with clinically normal corneas underwent CCT measurement by both ultrasound and AS-OCT while participating in a population-based study in Ghana, West Africa. One eye of each subject was randomly selected for analysis. Two measurements were taken and averaged. Agreement and interobserver variability were also analysed.
Results
155 subjects of African ethnicity and average age 57 (SD 12, range 40–98) were included. Measurements by AS-OCT and US were taken a mean of 15 days (maximum 6 weeks) apart. The mean (SD) [range] US CCT was 525.3 µm (33.5) [422, 653] and 499.0 µm (32.0) [428–613] with AS-OCT. Measurements by the two modalities were strongly correlated (r2=0.82, p<0.001), a significant difference was observed between mean US and AS-OCT CCT (SD) [range] of 26.3µm (14.2) [−63, 12](p<0.001). The width of the limits of agreement was 28 µm, about 6% of the average pachymetry reading. In 50 eyes randomly remeasured with OCT by a second observer, the intraclass correlation coefficient was 0.91. There was a small but significant systematic difference between observers (mean 6.9µm, SD 10.9µ), or 1.4% (p<0.001), increasing the difference noted above.
Conclusion
There is a reproducible systematic difference between CCT measurements taken with ultrasound and OCT. It is important to note in clinical practice, that measurements acquired by these two modalities are not directly interchangeable.
Introduction
Central corneal thickness (CCT) is an important parameter in refractive surgery, in the assessment of corneal disease, and for risk profiling in ocular hypertension and glaucoma. CCT can be measured using a number of modalities including optical pachymetry, ultrasound pachymetry, scheimpflug imaging, optical coherence tomography (OCT), and even magnetic resonance imaging.1 Traditionally the gold standard has been optical pachymetry, but this has recently been supplanted by ultrasonic pachymetry mainly because of ease of use.
An extensive meta-analysis of the available literature has shown that mean measured pachymetry values are slightly higher with ultrasonic than with traditional optical pachymetry.2 CCT measured using OCT has been reported in a number of studies using retinal OCT equipment adapted for anterior segment use. Overall these suggest a similar systematic reduction in comparison with ultrasonic pachymetry, in keeping with the optical basis of OCT.3–5 However, this has not been a consistent finding and other authors have not found a significant difference,6 or have even reported thicker CCT by OCT.7
More recently, dedicated non-contact anterior segment OCT (AS-OCT) equipment has been developed that offers high resolution cross-sectional imaging of the cornea and allows both central and regional pachymetry as well as sophisticated goniometry of the irido-corneal angle and other anterior segment structures. One study using one type of dedicated AS-OCT has recently been published, supporting the existence of a systematic difference between ultrasonic and AS-OCT measurements.8
The purpose of this study is to compare CCT measurements using AS-OCT with conventional ultrasonic pachymetry in a prospective manner in subjects enrolled in a population-based survey of blindness and eye disesase in Tema, Ghana, West Africa to investigate the degree of systematic difference and the level of agreement between AS-OCT and ultrasonic pachymetry.
Methods
The Tema Eye Survey
The Tema Eye Survey is a cross-sectional population-based prevalence study of vision loss and ocular disease in 5,500 residents of Tema, Ghana, West Africa. After a census in randomly selected clusters of 5 communities, subjects aged 40 years and above were invited for a field examination consisting of ETDRS visual acuity, auto-refraction, intraocular pressure measurement, ultrasonic pachymetry, visual field screening, and fundus photography. Subjects failing to meet pre-defined criteria in each of these investigations were invited for a clinic-based comprehensive ophthalmological examination including Humphrey visual field test, refraction, gonioscopy, AS-OCT examination and dilated fundus examination. Data were collected in the field and clinic by direct computer data entry into customized Access databases (Microsoft Corporation, Redmond, Washington, USA).
The Tema Eye Survey project was approved by the Human Subjects Committee of Stanford Medical School, the Ethics Committee of the Ministry of Health of Ghana, the Human Subjects Research Office of the University of Miami Miller School of Medicine, and the Research Governance Committee of Moorfields Eye Hospital. This study was carried out in compliance with the these authorities.
Recruitment
The first 155 consecutive subjects enrolled in the Tema Eye Survey that required comprehensive ophthalmologic examinations were measured by ultrasonography with the Pachmate 55 (DGH, Exton, PA. USA) and AS-OCT using the Heidelberg SL-OCT (Heidelberg Engineering, Heidelberg, Germany). One eye of each subject was randomly selected for analysis.
Central Corneal Thickness measurements
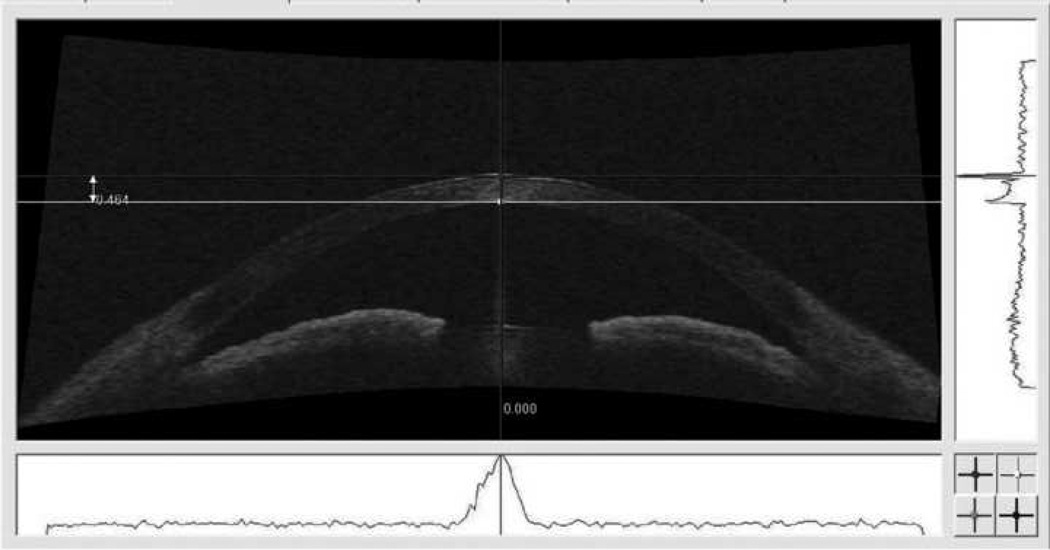
For each of the 155 eyes, at least two 15mm horizontal OCT scans of 7 mm fixed depth were obtained and stored for later analysis. CCT measurements were obtained from scans using the interactive distance measurement of the SL-OCT proprietary software (Heidelberg Eye Explorer v1.5.9.0) using the corneal reflectivity profile (Figure 1).
Figure 1.
Cross-sectional image of a subject’s anterior chamber acquired by AS-OCT, demonstrating the method used to measure CCT. The corneal apex was identified after correcting ocular rotation, from the peak of the reflectivity profile on the horizontal axis (below the image). The callipers were then aligned on the peak reflections of the anterior and posterior tissue boundaries of the cornea in the axis of the corneal apex (to the right of the image). The two measurements were averaged for each eye.
Briefly, ocular rotation was corrected first. The central cornea was identified from the peak of the reflectivity profile on the horizontal axis (Figure 1, below the image). The calipers were then aligned on the peak reflections at the anterior and posterior boundaries of the cornea, in the axis of the corneal apex (Figure 1 to the right of the image). The two measurements were averaged for each eye.
Ultrasound testing was also performed twice for each eye. The cornea was first anesthetized with 1 drop of proparacaine hydrochloride 0.5% (Alcaine, Alcon Labs, Fort Worth, Texas, USA). It would be very difficult to assess whether the two instruments took measurements at the same exact location. However, to ensure that ultrasound CCT was measured at the center of the cornea, we placed the probe tip at the very center of cornea and kept the pachymeter horizontal. If the patient moved and the probe decentred then the mearsurements were repeated. Ultrsound pachymetry was performed in each case by 1 of 2 technicians. 25 sequential measurements were obtained from the center of the cornea and averaged. Values with standard deviation (SD) of 5 µm or less were considered suitable for inclusion.
Statistical analyses
Agreement between the measurements of the two instruments was examined with a Bland-Altman plot and limits of agreement (LOA) were calculated.9 The measurements were also compared with the paired t test. Pearson’s correlation was used to assess the strength of correlation of the two measurements. Since AS-OCT measurements involved caliper measurements made by the observer, a subset (50) eyes were re-measured by a second observer to study interobserver agreement. A P value less than 0.05 was considered statistically significant.
Results
Patients included
All subjects were of West African ethnicity. The average age at enrollment was 57 (SD 12, range 40–98) years old.
Central Corneal Thickness measurements
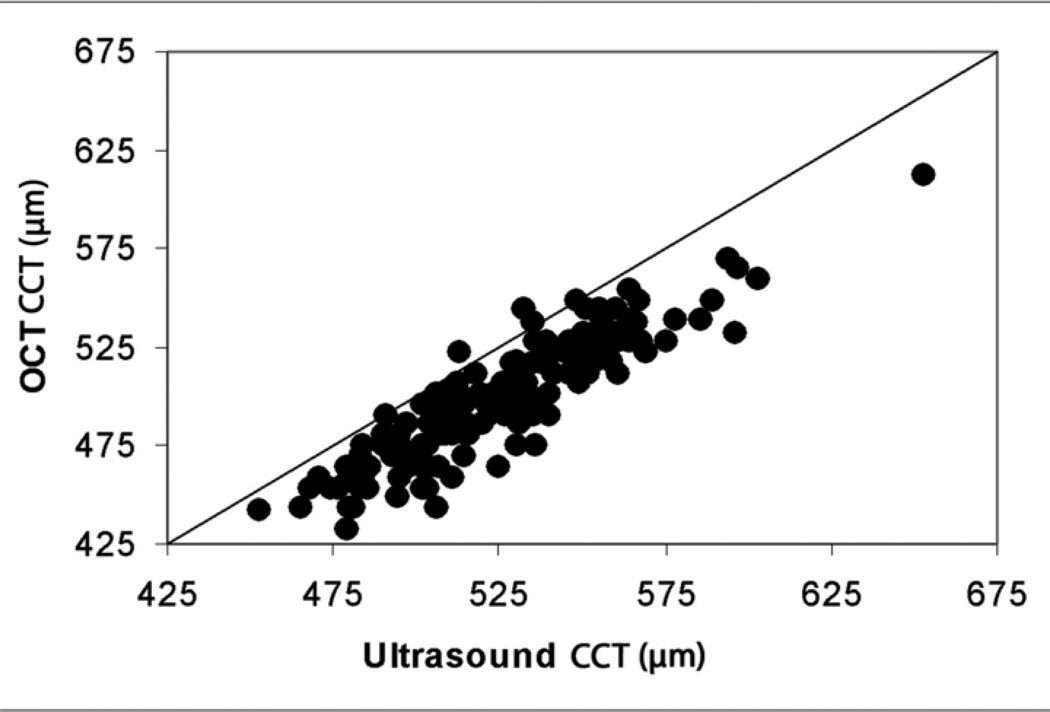
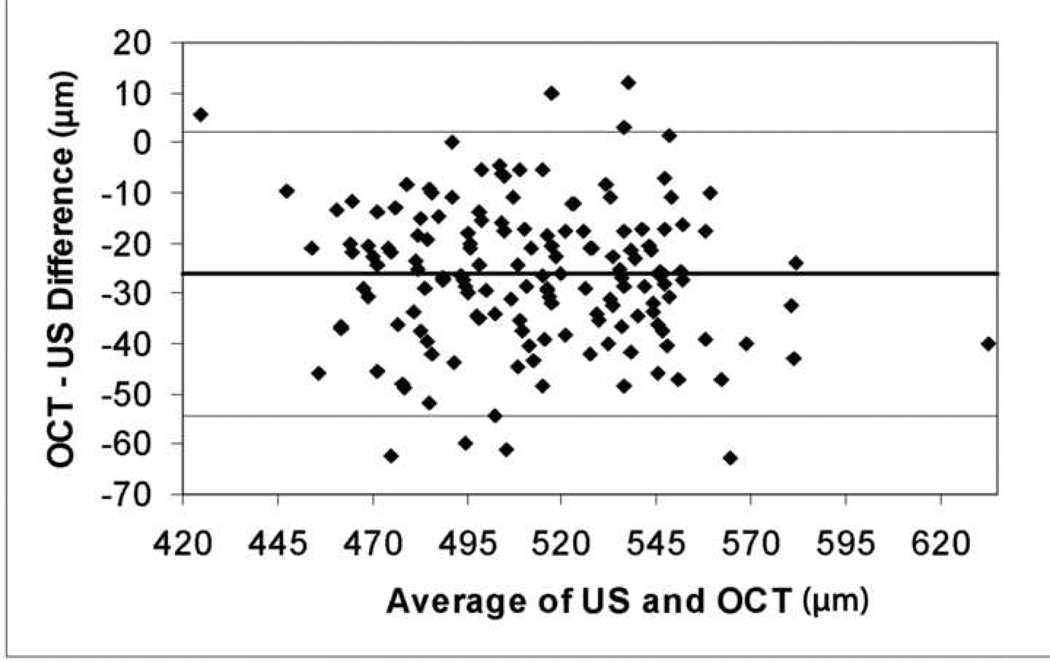
Mean (SD) [range] ultrasonic CCT was 525.3 µm (33.5) [422 – 653] and AS-OCT CCT was 499.0 µm (32.0) [428–613]. While the measurements of the two devices were highly correlated (r2=0.82, p<0.001) (Figure 2), there was a highly significant average (SD) [range] difference between CCT measured with ultrasonography and AS-OCT of 26.3µm (14.2) [−63, 12](p<0.001). A Bland-Altman plot (Figure 3) demonstrates this and shows no correlation between the AS-OCT-ultrasonic difference and the average pachymetry measurement. Twice the standard deviation of the difference, the width of the LOA, was 28 µm, about 6% of the average pachymetry reading.
Figure 2.
Scatterplot of CCT measurements by AS-OCT versus ultrasonography for each subject. Almost all measurements lie below the equivalence line demonstrating that CCT measurements are slightly higher with ultrasonography than AS-OCT in almost all subjects.
Figure 3.
Bland-Altman plot of AS-OCT – ultrasonography difference versus average of ultrasonic and AS-OCT CCT measurements. This demonstrates the level of the mean difference between the two instruments (bold horizontal line), the limits of agreement (horizontal lines above and below the bold line), and that the systematic difference observed is unrelated to mean CCT.
Interobserver variability in Anterior Segment Optical Coherence Tomography measurements
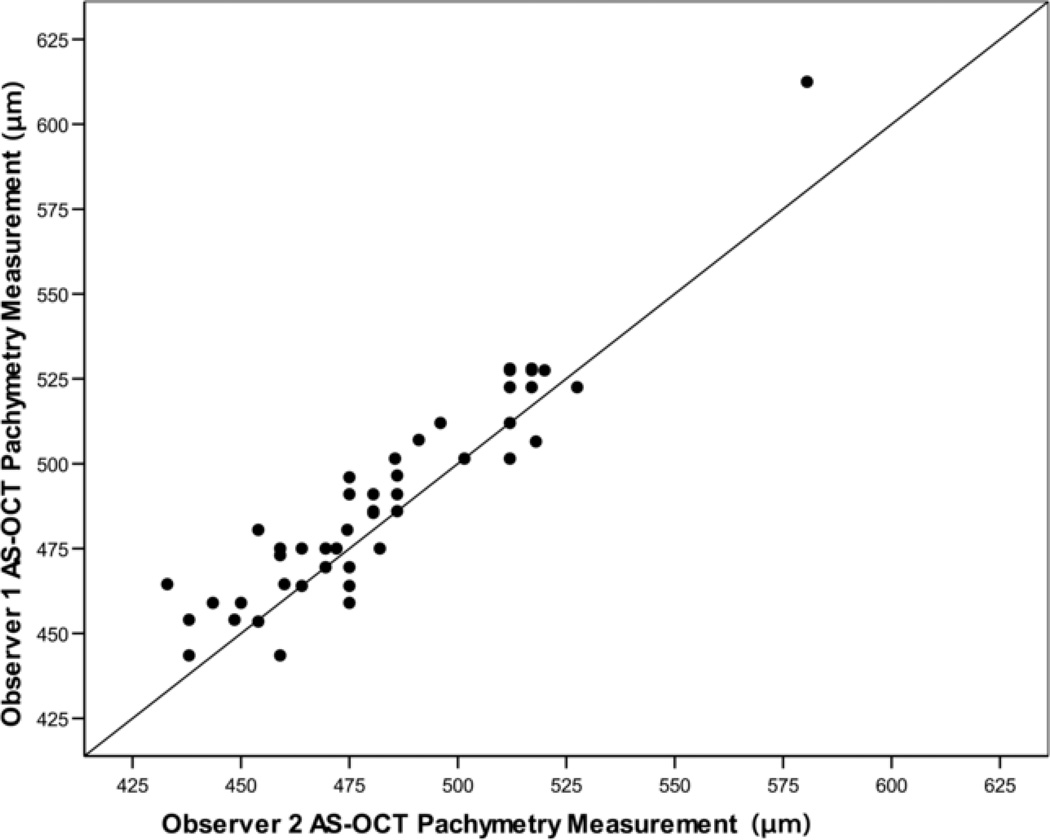
AS-OCT images were captured by two observers (KB and HK) and the pachymetry measurements ascertained from the images by one observer (HK). In order to quantify interobserver variability for OCT CCT measurements, 50 eyes were randomly selected for re-measurement by a second observer (PSL). The intraclass correlation coefficient for OCT was 0.91. A small but significant (p<0.001) systematic difference was identified between the two observers (mean 6.9µm, SD 10.9µ), or 1.4% of the average measurement (Figure 4). As the first observer averaged larger measurements of AS-OCT than the second, it is unlikely that an underestimate on their part contributed to the systematic difference identified between ultrasonic and OCT CCT measurements.
Figure 4.
Scatterplot of AS-OCT pachymetry measurements made by two observers (N=50), demonstrating high correlation (r2=0.91) but with observer 1 measuring slightly higher CCT readings (mean difference 6.9 µm, P < 0.001) than observer 2 in most subjects.
Time interval between optical coherence tomography and ultrasonic measurements
Measurements by OCT and ultrasonography were taken a mean (SD) of 15 (14.5) days apart (range −4 to +43 days). There was no correlation between either signed OCT-ultrasonography difference and the signed interval (r2 = 0.007, p=0.29) or the absolute value of OCT-ultrasonography difference and the absolute value of the interval (r2 = 0.007, p=0.29) (only 7 subjects had ultrasonic measurements performed after OCT).
The mean (SD) difference between OCT and ultrasonic measurements made on the same day was −23.3 (13.8) compared to −27.5 (14.2) for those performed on different days (p=0.085). The SD of the difference was not larger for subjects with measurements made on different days (p=0.61).
Discussion
In a large meta-analysis of 300 data-sets reporting normal CCT, Doughty and Zaman2 found that that mean normal CCT was 530 µm for slit-lamp-based optical pachymetry and 544 µm for ultrasonography. However, the confidence limits for slit-lamp optical pachymetry were wide. Subsequent reports using retinal OCT adapted for the anterior segment3–5 suggest a similar effect but this has not been consistently reported; other authors have reported no significant difference,6 or even thicker measurements of CCT by OCT.7
More recently, dedicated non-contact anterior segment OCT devices have become available, offering high resolution cross-sectional imaging of the cornea and allowing both central and regional pachymetry as well as sophisticated goniometry of the irido-corneal angle and other anterior segment structures. There are currently two dedicated AS-OCT devices available (SL-OCT, Heidelberg Engineering, Heidelberg, Germany and Visante, Carl Zeiss Meditec, Dublin, CA, USA). These both employ a different wavelength of infra-red from conventional retinal OCT (approximately 1310 nm compared with 840–850 nm, respectively). AS-OCT has the advantages over ultrasonic pachymetry in that it is a noninvasive, noncontact, modality as well as having the ability to examine other structures as mentioned above. The disadvantage is that it is slower to perform in a busy clinic than a hand-held pachymeter and requires greater expertise. Unlike ultrasonic pachymetry, AS-OCT can easily be used to assess regional differences in the cornea and the facility for the patient to fixate on a target allows more accurate identification of the central corneal surface.
One previous study has reported CCT using AS-OCT employing the Visante the alternative machine to that reported in this study.10 In that report, a systematic difference between AS-OCT and ultrasonic pachymetry was also noted but to a lesser degree (16.5 ± 11.7 µm).8 Although our study found a larger systematic difference than that reported above, this is not explained by differences in sample size. Although the disparity between our two studies represents less than 2% of the total CCT and is therefore a very small discrepancy, there are two possible explanations other than hardware differences. Firstly, the 2 machines use slightly different methodology for measurement of CCT. In the Heidelberg SL-OCT the investigator uses software callipers to measure from the peak reflectivity on an “A-Scan” reflectivity profile. In the Visante, the measurement is taken from the visible front and back surface of the cornea on a cross-sectional image, and therefore the measured CCT might be expected to be larger. This methodological difference might explain the disparity between our two studies. The small but significant interobserver difference that we noted is also likely explained by differences in positioning of the calipers. Secondly, ethnic differences between Zhao’s study group (Malays) and ours (Ghanians) might also account for the difference.
It is unclear whether ultrasound or OCT measurements more accurately reflect the true corneal thickness. Although it is possible that differences in analysis software might account for the discrepancy, the weight of evidence now suggests that a systematic difference does exist in AS-OCT versus ultrasonic methods of measurement, and that this is unrelated to interobserver differences in AS-OCT measurements.
In this study CCT measurements taken by ultrasonography measured approximately 26.3µm higher than those measured by AS-OCT. The difference may be even greater because the tear film is measured by OCT but compressed by the ultrasonic probe, although this effect is negated to some extent by the use of the A scan corneal reflectivity profile. The high repeatability of OCT observed here confirms previous findings.11
There are several theoretical explanations for the differences in CCT between the two methods such as corneal edema from local anesthesia drops12;13 and uncertainty of the exact sound of speed in corneal tissue which can affect ultrasonic pachymetry. For OCT, uncertainty of the true index of refraction of infrared radiation in the cornea creates a source of error in calculating the CCT.8 There could also be small calibration errors in either system.
In conclusion, AS-OCT is a promising noncontact and reproducible diagnostic method that is comparable to ultrasonic pachymetry in the evaluation of corneal thickness though it is important to note that in clinical practice, measurement values are not directly interchangeable.
Acknowledgement
Funding/Support: International Aid, an unrestricted grant from Pfizer Inc., NEI Core Grant EY014801, and an unrestricted grant from Research to Prevent Blindness. The SL-OCT was loaned by Heidelberg Engineering for the use of the Tema Eye Survey Project.
Biography

Hanna Kim graduated with Honors from Stanford University with a B.S. in Biological Sciences in 2002. She is currently a senior medical student at Stanford University School of Medicine. She plans to apply for residency in ophthalmology. Her research interests include epidemiology in ophthalmic diseases and international blindness prevention. Ongoing research projects include participation in the Tema Eye Survey; a population-based study of the prevalence of blindness and ocular diseases in Ghana, West Africa.
Footnotes
Publisher's Disclaimer: This is a PDF file of an unedited manuscript that has been accepted for publication. As a service to our customers we are providing this early version of the manuscript. The manuscript will undergo copyediting, typesetting, and review of the resulting proof before it is published in its final citable form. Please note that during the production process errors may be discovered which could affect the content, and all legal disclaimers that apply to the journal pertain.
- Hanna Y Kim: None
- Donald L Budenz: None
- Pak S Lee has received travel expenses from Heidelberg engineering
- William J Feuer: None
- Keith Barton: None
- Design of study: HYK, DLB
- Collection, management, analysis and interpretation of data: HYK, DLB, PSL, WJF, KB
- Preparation, review or approval of manuscript HYK, DLB, PSL, WJF, KB
Statement about conformity with author information:
The Tema Eye Survey project was approved by the Human Subjects Committee of Stanford Medical School, the Ethics Committee of the Ministry of Health of Ghana, the Human Subjects Research Office of the University of Miami Miller School of Medicine, and the Research Governance Committee of Moorfields Eye Hospital. This study was carried out in compliance with the these authorities.
Reference List
- 1.Wolffsohn JS, Davies LN. Advances in anterior segment imaging. Curr Opin Ophthalmol. 2007;18:32–38. doi: 10.1097/ICU.0b013e328011550d. [DOI] [PubMed] [Google Scholar]
- 2.Doughty MJ, Zaman ML. Human corneal thickness and its impact on intraocular pressure measures: a review and meta-analysis approach. Surv Ophthalmol. 2000;44:367–408. doi: 10.1016/s0039-6257(00)00110-7. [DOI] [PubMed] [Google Scholar]
- 3.Wirbelauer C, Scholz C, Hoerauf H, et al. Noncontact corneal pachymetry with slit lamp-adapted optical coherence tomography. Am J Ophthalmol. 2002;133:444–450. doi: 10.1016/s0002-9394(01)01425-8. [DOI] [PubMed] [Google Scholar]
- 4.Wong AC, Wong CC, Yuen NS, Hui SP. Correlational study of central corneal thickness measurements on Hong Kong Chinese using optical coherence tomography, Orbscan and ultrasound pachymetry. Eye. 2002;16:715–721. doi: 10.1038/sj.eye.6700211. [DOI] [PubMed] [Google Scholar]
- 5.Bechmann M, Thiel MJ, Roesen B, et al. Central corneal thickness determined with optical coherence tomography in various types of glaucoma. Br J Ophthalmol. 2000;84:1233–1237. doi: 10.1136/bjo.84.11.1233. [DOI] [PMC free article] [PubMed] [Google Scholar]
- 6.Fishman GR, Pons ME, Seedor JA, et al. Assessment of central corneal thickness using optical coherence tomography. J Cataract Refract Surg. 2005;31:707–711. doi: 10.1016/j.jcrs.2004.09.021. [DOI] [PubMed] [Google Scholar]
- 7.Leung DY, Lam DK, Yeung BY, Lam DS. Comparison between central corneal thickness measurements by ultrasound pachymetry and optical coherence tomography. Clin Experiment Ophthalmol. 2006;34:751–754. doi: 10.1111/j.1442-9071.2006.01343.x. [DOI] [PubMed] [Google Scholar]
- 8.Zhao PS, Wong TY, Wong W-L, et al. Comparison of central corneal thickness measurements by Visante anterior segment optical coherence tomography with ultrasound pachymetry. Am J Ophthalmol. 2007;143:1047–1049. doi: 10.1016/j.ajo.2007.01.050. [DOI] [PubMed] [Google Scholar]
- 9.Bland JM, Altman DG. Statistical methods for assessing agreement between two methods of clinical measurement. Lancet. 1986;1:307–310. [PubMed] [Google Scholar]
- 10.Zhao PS, Wong TY, Wong WL, et al. Comparison of central corneal thickness measurements by visante anterior segment optical coherence tomography with ultrasound pachymetry. Am J Ophthalmol. 2007;143:1047–1049. doi: 10.1016/j.ajo.2007.01.050. [DOI] [PubMed] [Google Scholar]
- 11.Muscat S, McKay N, Parks S, et al. Repeatability and reproducibility of corneal thickness measurements by optical coherence tomography. Invest Ophthalmol Vis Sci. 2002;43:1791–1795. [PubMed] [Google Scholar]
- 12.Herse P, Siu A. Short-term effects of proparacaine on human corneal thickness. Acta Ophthalmol (Copenh) 1992;70:740–744. doi: 10.1111/j.1755-3768.1992.tb04879.x. [DOI] [PubMed] [Google Scholar]
- 13.Nam SM, Lee HK, Kim EK, Seo KY. Comparison of corneal thickness after the instillation of topical anesthetics: proparacaine versus oxybuprocaine. Cornea. 2006;25:51–54. doi: 10.1097/01.ico.0000179929.97651.59. [DOI] [PubMed] [Google Scholar]


