

Abstract
This significantly extends Multi-Voxel Pattern Analysis (MVPA) methods, such as the Searchlight and related methods, by building on an approach that was recently proposed for structural brain images, and was named Optimally-Discriminative Voxel-Based Analysis (ODVBA), which uses machine learning models to determine the optimal anisotropic filtering of images that enhances group differences. Precise spatial maps of activation are computed by tallying the weights of each voxel to all of the neighborhood in which it belongs, and significance maps are obtained via permutation testing. We adapt this idea to both single and multi-subject fMRI analysis. Both simulated data and real data from 12 adolescent subjects who completed a standard working memory task demonstrated the use of ODVBA in fMRI improves accuracy and spatial specificity of activation detection over Searchlight.
Keywords: fMRI, MVPA, Searchlight, ODVBA
I. Introduction
Statistical parametric mapping (SPM) has a central role in functional neuroimaging, describing brain activation through the use of mass univariate statistics on a voxelwise basis. As an alternative to SPM, the Searchlight approach [1] has become increasingly popular due to certain advantages over the conventional general linear model (GLM). In particular, with the development of Multi-Voxel Pattern Analysis (MVPA) techniques [2][3], the original Searchlight has been significantly extended [4][5][6][7][8] by incorporating the classifiers, e.g., SVM, to jointly analyze the local volumes for mapping the brain activities. In this approach, the voxels in a local Searchlight neighborhood are used to train a classifier from a randomly selected training set. Classification accuracy is determined on using the remaining testing set and averaged over cross-validation runs. Finally, each voxel in the brain is assigned a classification accuracy based on the local pattern surrounding it, with the statistical significance being determined by permutation testing.
However, two principal drawbacks are associated with the classifier-based Searchlight method. First, the local classifier employed by Searchlight produces blurred and inaccurate maps of statistical significance: the (inactive) voxels which are actually located outside the region of activation would be detected as significant since its Searchlight neighborhood extends over the nearby activated voxels (Fig. 1a). This problem becomes increasingly more important as the neighborhood size increases and more extensive patterns are investigated largely defeating the purpose of using a multivariate pattern analysis over a neighborhood including many voxels. A second and related problem is that it is difficult to determine the appropriate kernel size for the Searchlight neighborhood. As the discriminative information of the neighborhood depends on which voxels are included, Searchlights with different kernel sizes will produce markedly different results. Due to the heterogeneity in the functional neuroanatomy of the human brain, optimal Searchlight size and shape will vary by brain region.
Figure 1.
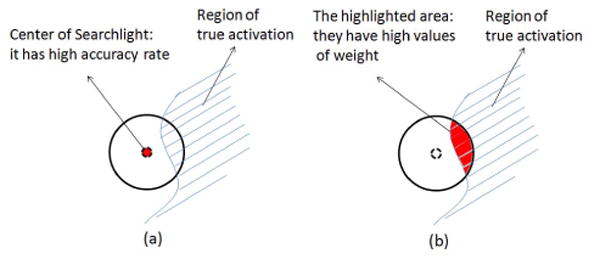
The idea illustrations of (a) Searchlight; and (b) ODVBA.
In this paper, we compare Searchlight to Optimally-Discriminative Voxel-Based Analysis (ODVBA, [9]), a novel technique that has been adapted from structural brain imaging for use with fMRI data. ODVBA has two primary benefits over Searchlight. First, instead of calculating a voxel-wise significance map using local classification accuracy over the Searchlight neighborhood, ODVBA estimates crisp boundary preserving maps by considering the weights of each voxel in all neighborhoods that the voxel belongs to. This measure therefore reflects the discriminating ability of that particular voxel but not of any of its neighbors, yet nonetheless reflects the full multivariate pattern classification analysis over arbitrarily large neighborhood sizes (Fig. 1b). Second, as a result, ODVBA can accommodate larger classification neighborhoods, allowing both superior sensitivity and robustness to variations in kernel size, as well as the investigation of truly multivariate patterns.
II. The method
ODVBA for fMRI has four steps: extraction of groups, single and multi-subject analysis, and permutation testing.
A. Extraction of group information from time-series
Let G1 be the group of images of a subject obtained during the first condition, and let G2 be the group of images under the second condition. For each subject, we conduct a group comparison between G1 and G2. The labels of scans are related with the original task design. As customary, we convolve the task design with a hemodynamic response function (HRF) h(t) to get the best possible fit to the data. So, the predicted response R can be obtained by: , where s(t) is the task design. After removing some transition scans based on R, two groups of images corresponding to the task conditions are obtained. In this paper, we use the canonical HRF [10].
B. Single-subject analysis with ODVBA
ODVBA is used to determine the statistical map of activation for a single subject by performing group comparison between G1 and G2. For each voxel x in the image volume X, ODVBA gets a k dimensional subvolume vector: θ⃗ = [x, x1, ⋯, xk−1]T, where x1, ⋯, xk−1 are the k − 1 neighbors of x, and then it constructs a learning set Θ = [θ⃗1, ⋯, θ⃗N] from N scans of two groups. ODVBA expects to find a nonnegative vector w⃗ to describe the contributions of elements in θ⃗ for classification, such as ϕ = w⃗Tθ⃗. The use of nonnegativity was explained in [9] and it relates to interpretability but also better detection of true activation as nonnegativity results in parts-based representations and avoids cancelations between negative and positive loadings. The first aspect of objective is to maximize the distance of projected class means:
| (1) |
where, ; Gi means the ith group; Ni denotes the number of images in Gi; SB = (m⃗1 − m⃗2)(m⃗1 − m⃗2)T. The other aspect is to minimize the projected intra-class compactness:
| (2) |
where . The above two objectives are considered under the formulation of nonnegative quadratic programming:
| (3) |
where, A = (γSW − SB + (|λmin| + τ)I); γ is the tuning parameter; |λmin| is the absolute of the smallest eigenvalue of γSW − SB; 0 < τ < 1 is the regularization parameter; I is the identity matrix; e⃗ = [1, ⋯, 1]T; μ is the balance parameter. w⃗ is estimated by multiplicative updates [9] which iteratively minimize the objective function:
| (4) |
where i = 1, ⋯, k; the nonnegative matrices A+ and A− are defined as follows: , if Aij > 0; otherwise 0, and , if Aij < 0; otherwise 0.
For one voxel x, a list of corresponding (w⃗)i values are obtained because x may belong to a number of neighborhoods. Thereby, the statistical value T of voxel x is defined by summing up contributions from all neighborhoods to which it participates: Tx = Σℕ∈Δ δℕ(w⃗ℕ)i, i ∈ {1, ⋯, k}, where w⃗ℕ denotes the coefficients in neighborhood ℕ, Δ = {ℕ|x ∈ ℕ}, (w⃗ℕ)i denotes that x is the ith element in ℕ, and δℕ denotes the discrimination degree [9].
C. Multi-subject analysis with group ODVBA
Based on the contrast maps obtained individually from each subject, group ODVBA, as an extension of ODVBA, is proposed to get a new statistical map which can reflect the group analysis of activations. Different from ODVBA which works on two conditions of scans, group ODVBA works on one sample of contrast maps. The question is: which brain region is consistently activated across subjects?
Group ODVBA is based on the original formulation of ODVBA, but it changes the objectives in (3). For Ns subjects, we denote Zi, i = 1, ⋯, Ns as the the associated statistical maps from single-subject analyses. Group ODVBA starts from regional analysis as well as ODVBA. For each given voxel z in the volume Z, group ODVBA gets a ks dimensional vector: ϑ⃗ = [z, z1, ⋯, zks−1]T, where z1, ⋯, zks−1 are ks − 1 neighbors of z, and then a learning set Ξ = [ϑ⃗1, ⋯, ϑ⃗Ns] is created. Group ODVBA expects to find a nonnegative vector w⃗ to describe the contributions of elements in ϑ⃗ for detecting activation. The first aspect to be considered is to highlight the contrast in each neighborhood:
| (5) |
where ; C = I − eeT/ks denotes the centering matrix. The other aspect is to minimize the projected one sample compactness:
| (6) |
where ; .
ST and SC are considered in the objective function of (3), replacing SB and SW respectively. Similar as ODVBA, group ODVBA sums up different optimal directions from all regional analyses to determine a map of statistic values T.
D. Permutation test for the statistical significance
Permutation-based nonparametric inference is used to establish significant levels for both single and multi-subject analysis, with the assumption that the null hypothesis is there is no contrast for each subject. Particularly, we assign each scan with a random label and then implement Section II.B for Tsingle and Section II.C for Tmulti with each relabelling.
III. Results
A. Experiments on the simulated data
Activation with Simulated Gyrus
A simulated dataset was generated by: Y = RB + E, where Y is the simulated time-series; R is the predicted response obtained by convolution between HRF H and the task design S; B is the spatial structure of the ground truth; E is the noise. For S, we use 20-second ON/OFF block function. The activated region is like a gyrus as shown in Fig. 2a. For E, we use Gaussian noise with zero mean and unit variance. Imaging parameters are as follows: TR=1s, image size 40×40 voxels, and 120 time points. Only one session of time-series is created, so this can be regarded as the single-subject analysis.
Figure 2.
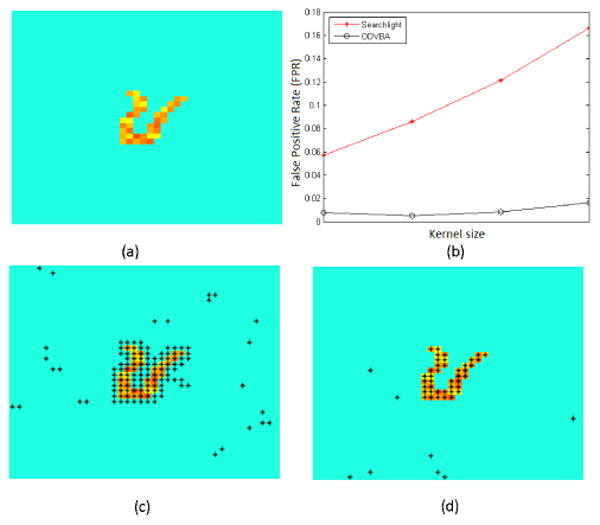
The case of Activation with Simulated Gyrus. (a) Gound truth; (b) fpr vs. Kernel size (Searchlight: 1-4mm; ODVBA: 3-6mm); (c) Best result of Searchlight (1mm); (d) Best result of ODVBA (4mm). Black asterisks indicate areas of activation with uncorrected p <0.01.
Since the ground truth is known, we investigate the False Positive Rate (FPR) of methods with different kernel size. For Searchlight, the radii range from 1 to 4mm; ODVBA is performed with larger radii ranging from 3 to 6mm. As seen in Fig. 2b, FPRs of Searchlight are higher than those of ODVBA. Moreover, Searchlight FPRs are strongly related to kernel size, whereas ODVBA FPRs remains stable. Fig. 2c and 2d illustrate the significance maps with the lowest FPR for each method. For Searchlight, the optimal radius is 1 and the corresponding FPR is 5.7%; for ODVBA, the radius is 4 and FPR is 1.2%. The images clearly demonstrate ODVBA delineates a more precise area of activation than Searchlight.
Activation with High Noise
A second experiment involves the same design response as that above, but has spatially simpler ground truth (Fig. 3a) and stronger noise (mean 8 and unit variance). For this case, we study the True Positive Rate (TPR) by varying kernel sizes. We used the same radius range as prior: 1-4mm for Searchlight and 3-6mm for ODVBA. As shown in Fig. 3b, ODVBA is more able to detect activation hidden in high noise. Fig. 3c and Fig. 3d visualize the best TPRs: Searchlight with 4mm radius yields a TPR of 29.1%, while ODVBA with 6mm results in 43.6%.
Figure 3.
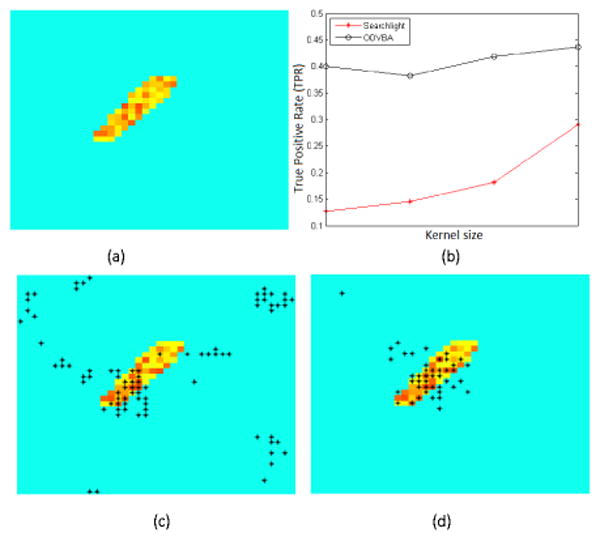
The case of Activation with High Noise. (a) Gound truth; (b) TPR vs. Kernel size (Searchlight: 1-4mm; ODVBA: 3-6mm); (c) Best result of Searchlight (4mm); (d) Best result of ODVBA (6mm). Black asterisks indicate areas of activation with uncorrected p <0.01.
B. Experiments on the real data: N-back Working Memory
Input data
12 healthy adolescent subjects performed a standard fractal N-back working memory task [11] while fMRI data was acquired (231 volumes, matrix=64 × 64, slice thickness/gap=3/0mm, flip=90°, TR/TE=3000/32ms, FOV=192×192mm). In this task, working memory load was parametrically varied under three conditions, ranging from easy (0-back) to difficult (2-back). Each condition consisted of a 20-trial block repeated three times. The contrast of interest for this experiment is the activation of 2-back>0-back. The data were realigned, high-pass filtered before transformation to standard MNI coordinates.
Single-subject analysis
As we cannot know the ground truth for real data to generate FPRs and TPRs, we compare the number of detected significant voxels versus the kernel sizes between the two methods. Searchlight was performed using radii ranging from 2 to 8mm, with a 2mm interval. For ODVBA, the radii varied from 10 to 16mm, also with an interval of 2mm. The number of significant voxels (obtained with uncorrected p <0.01) is the average of all 12 subjects. As shown in Fig. 4, the performance of Searchlight is much more sensitive to kernel size than that of ODVBA.
Figure 4.
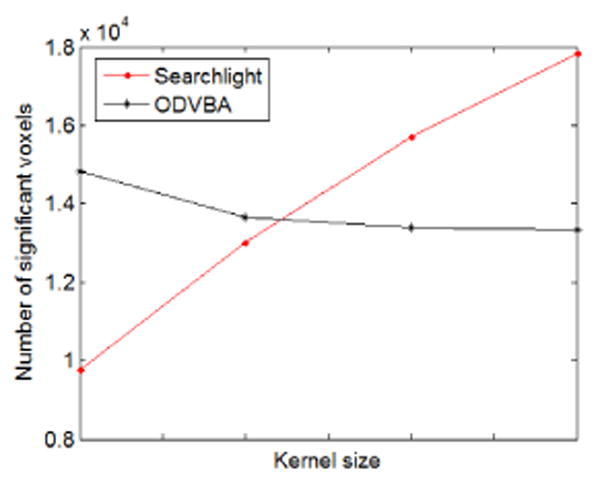
Results from the single-subject analysis: Number of significant voxels versus kernel sizes (Searchlight: 2-8mm; ODVBA: 10-16mm).
Multi-subject analysis
Multi-subject analysis was conducted based on the contrast images of single-subject analyses. For Searchlight, the contrast image is the map of classification accuracy rates, indicating overlap of the underlying statistical distributions, and in the multi-subject level, the one-sample t-test is used routinely [6][7] to combine the effects from different subjects, finally using a permutation test to access significance. As suggested by analysis in Fig. 4, Searchlight was performed with a radius 4mm; ODVBA used a radius of 14mm. As displayed in Fig. 5, ODVBA proved more sensitive to detect activation in a network of regions known to be recruited by working memory tasks, including the dorsolateral prefrontal cortex, cerebellar crus I, superior parietal cortex, and middle frontal gyrus.
Figure 5.
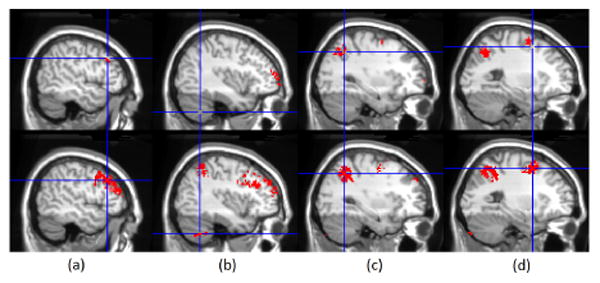
Results of Searchlight (1st row) and ODVBA (2nd row) from the multi-subject analysis: Significant differences detected in (a) dorsolateral prefrontal cortex; (b) cerebellar crus I; (c) superior parietal cortex; and (d) middle frontal gyrus.
IV. Discussion and Conclusions
We presented a method that built upon a method for optimally discriminative voxel-based analysis of brain images, and tested the utility of that method for analysis of task-based fMRI data. Somewhat akin to the Searchlight method, ODVBA evaluates the spatial pattern of functional activation around each voxel, and determines the direction that optimally separates activation between two conditions. This direction effectively implies an anisotropic and highly heterogeneous spatial filter, which maximizes detection of activation in that neighborhood. By tallying the discriminative contribution of each voxel to all neighborhoods within which it belongs, this method builds statistical parametric maps that detect brain activity with a high degree of spatial specificity (minimal blurring). Such blurring is prominent in the commonly used Searchlight method, as well as in standard GLM, since the neighborhood of many non-activated voxels intersects the activated region, which in fact tremendously limits the size of neighborhood that can be used in these approaches. ODVBA is very robust to this problem, because it doesn't use the accuracy rate within each neighborhood, but rather evaluates the contribution of each voxel to all neighborhoods to which it belongs. Because their individual discrimination weights are likely to be small or zero, non-activated voxels are therefore not lumped into activated regions, even though they can belong to many neighborhoods intersecting activations. As a result, a spatially precise activation map can be produced. Moreover, since the size of the local neighborhoods can be much larger without risk of blurring, sensitivity in detecting activations can be substantially higher due to suppression of noise without any associated loss of signal detection ability. This latter property emanates from the spatially adaptive filtering implied by local discriminative analysis.
Experimental results on known ground truth showed clear superiority of this approach, relative to Searchlight. Results obtained from real data also indicate the proposed approach is more sensitive in detecting brain activity in a standard working-memory paradigm. Particularly, ODVBA revealed stronger activation than that of Searchlight in a network of regions involved in working memory, including the dorsolateral prefrontal cortex, cerebellar crus I, superior parietal cortex, and middle frontal gyrus. Taken together, these results suggest that ODVBA represents a substantial improvement over Searchlight in the analysis of fMRI data.
Acknowledgments
The work was supported by NIH grant R01AG14971.
References
- 1.Kriegeskorte N, Goebel R, Bandettini P. Information-based functional brain mapping. Proc Natl Acad Sci USA. 2006;103(10):3863–3868. doi: 10.1073/pnas.0600244103. [DOI] [PMC free article] [PubMed] [Google Scholar]
- 2.Haxby JV, Gobbini MI. Distributed and overlapping representations of faces and objects in ventral temporal cortex. Science. 2001;293(5539):2425–2430. doi: 10.1126/science.1063736. [DOI] [PubMed] [Google Scholar]
- 3.Norman KA, Polyn SM, Detre GJ, Haxby JV. Beyond mind-reading: multivoxel pattern analysis of fMRI data. Trends Cogn Sci. 2006;10(9):424–430. doi: 10.1016/j.tics.2006.07.005. [DOI] [PubMed] [Google Scholar]
- 4.Kriegeskorte N, et al. Individual faces elicit distinct response patterns in human anterior temporal cortex. Proc Natl Acad Sci USA. 2007;104:20600–20605. doi: 10.1073/pnas.0705654104. [DOI] [PMC free article] [PubMed] [Google Scholar]
- 5.Haynes JD, Sakai K, Rees G, Gilbert S, Frith C, Passingham RE. Reading hidden intentions in the human brain. Curr Biol. 2007;17(4):323–328. doi: 10.1016/j.cub.2006.11.072. [DOI] [PubMed] [Google Scholar]
- 6.Eger E, Michel V, Thirion B, et al. Deciphering cortical number coding from human brain activity patterns. Curr Biol. 2009;19(19):1608–1615. doi: 10.1016/j.cub.2009.08.047. [DOI] [PubMed] [Google Scholar]
- 7.Greenberg AS, Esterman M, Wilson D, et al. Control of spatial and feature-based attention in frontoparietal cortex. J Neurosci. 2010;30(43):14330–14339. doi: 10.1523/JNEUROSCI.4248-09.2010. [DOI] [PMC free article] [PubMed] [Google Scholar]
- 8.Pereira F, Botvinick M. Information mapping with pattern classifiers: a comparative study. Neuroimage. 2011;56(2):476–496. doi: 10.1016/j.neuroimage.2010.05.026. [DOI] [PMC free article] [PubMed] [Google Scholar]
- 9.Zhang T, Davatzikos C. ODVBA: Optimally-Discriminative Voxel-Based Analysis. IEEE Transaction on Medical Imaging. 2011;30(8):1441–1454. doi: 10.1109/TMI.2011.2114362. [DOI] [PMC free article] [PubMed] [Google Scholar]
- 10.Friston KJ, et al. Event-related fMRI: characterizing differential responses. Neuroimage. 1998;7:30–40. doi: 10.1006/nimg.1997.0306. [DOI] [PubMed] [Google Scholar]
- 11.Ragland JD, et al. Working memory for complex figures: An fMRI comparison of letter and fractal n-back tasks. Neuropsychology. 2002;16(3):370–379. [PMC free article] [PubMed] [Google Scholar]