Abstract
Background
Platelet exocytosis is regulated partially by the granular/cellular membrane lipids and proteins. Some platelets contain a membrane-bound tube, called an open canalicular system (OCS), which assists in granular release events and increases the membrane surface area for greater spreading. The OCS is not found in all species, and variations in membrane composition can cause changes in platelet secretion. Since platelet studies use various animal models, it is important to understand how platelets differ in both their composition and granular release to draw conclusions among various models.
Methods
The relative phospholipid composition of the platelets with (mouse, rabbit) and without (cow) an OCS was quantified using UPLC-MS/MS. Cholesterol and protein composition was measured using an Amplex Red Assay and BCA Assay. TEM and dark field imaging were used to gather platelet images and analyzed with Image J. Granular release was monitored with single cell carbon fiber microelectrode amperometry.
Results
Cow platelets contained greater amounts of cholesterol and sphingomyelin. In addition, they yield greater serotonin release and longer δ granule secretion times. Finally, they showed greater spreading area with a greater range of spread.
Conclusion
Platelets containing an OCS had more similarities in their membrane composition and secretion kinetics compared to cow platelets. However, cow platelets showed greater fusion pore stability which could be due to extra sphingomyelin and cholesterol, the primary components of lipid rafts. In addition, their greater stability may lead to more granules assisting in spreading.
General Significance
Highlights fundamental membrane differences and their effects on platelet secretion
Keywords: Platelets, exocytosis, phospholipids, open canalicular system
Graphical abstract
1. Introduction
Platelets are a crucial component in maintaining hemostasis through the release of three distinct secretory granules: α-granules, δ-granules, and lysosomes. Due to the unique anucleate nature of platelets, the exocytosis of these granules is regulated primarily by proteins, cholesterol, and phospholipids in both the overall platelet and granule membranes. Changes in the chemical composition of the membrane or granules have been linked to disorders including Wiskott-Aldrich syndrome, Scott syndrome, and giant platelet syndrome. [1–3] As researchers have delved into these differences, a variety of platelets from different species have been used to study both the fundamental molecular mechanisms of platelet function as well as the role of platelets in the aforementioned diseases. Platelets isolated from different species often share common features; however, there are both structural and functional differences that must be explored to fully understand whether conclusions drawn from one model system can be combined with or will translate to another. [4, 5]
Comparison of the structural differences among platelets from different species will help illuminate the roles of these cellular structures. Additionally, comparative studies of platelet function across species can yield information on various ways in which platelets from different species adjust to the presence or absence of a particular feature. One such cellular structure of interest is the open canalicular system (OCS), a tubular membrane-bound system whose role in platelet function is not fully understood. The OCS is rare in nucleated cells, and in platelets it is only found in several species including humans, mice, and rabbits while platelets from cows, camels, and horses lack an OCS. This structure has been shown to help localize granules within the cell for easier export of their contents and is involved in the activation-initiated change in platelet morphology widely known as spreading. [6–9]
Due to the uniqueness of the OCS, several studies have examined species-dependent variations in OCS-related protein and receptor expression in platelets. [6,10] However, there is still limited information on how non-OCS platelets maintain hemostasis comparable to platelets with an OCS, thus making it harder to pinpoint the function of the OCS. This study focuses on how the membrane of the platelets with (mouse and rabbit) and without (cow) an OCS changes to enable normal platelet function, including measurement of phospholipid and cholesterol content while accounting for platelet sizes before and after activation. Insight into the spreading size and cholesterol content is important in this context because it will help test the hypotheses that (1) granules are involved in the spreading of platelets without a readily available OCS and (2) changes in membrane phospholipid content facilitates release of granule contents.
To follow platelet secretion dynamics, this work uses carbon fiber microelectrode amperometry (CFMA) to elucidate the δ granule involvement and changes in granule release. Traditional studies of platelet secretion have used ensemble cell assays, which measure release from thousands to millions of platelets at a time. While useful, ensemble measurements of cellular function obscure subtleties that can be observed on a single cell level using CFMA with sub-ms time resolution. This enables detailed evaluation of the kinetics of the secretory process and allows distinction among a heterogeneous set of platelets. For these studies two stimulants, ionomycin (a calcium ionophore) and thrombin (a natural platelet stimulant in the body) were chosen to determine OCS-dependent differences in activation. Stimulation with ionomycin bypasses several relevant physiological steps in platelet activation that are present following thrombin stimulation. Therefore, exploring differences between the two stimulants may reveal differences in release induced by changes in activation mechanisms rather than how the platelet interacts with the membrane or OCS during exocytosis.
Ultimately, using complementary analytical techniques including CFMA, biological assays, imaging, and mass spectrometry, we were able to determine the importance of platelet cell structure, including the OCS and lipid concentration, on cell activation secretion kinetics and spreading.
2. Materials and Methods
2.1 Isolation of platelets
Blood was collected according to protocols approved by the University of Minnesota IACUC (protocol numbers 0211712011 and 1105A99774). A mid-ear artery was used for rabbit blood draw to EDTA-containing tubes. Mouse blood was collected via cardiac puncture following CO2 asphyxiation into syringes pre-filled with ACD. Cow blood was drawn from the tail into EDTA-coated tubes. In all cases, blood was diluted by addition of Tyrode’s buffer (NaCl, 137 mM; KCl, 2.6 mM; MgCl2, 1.0 mM; D-glucose, 5.6 mM; N-2-hydroxyethylpiperazine- N′-2-ethanesulfonic acid (HEPES) 5.0 mM; and NaHCO3, 12.1 mM with pH adjusted to 7.3) and centrifuged for 10 min at 500xg for rabbit and cow or 130xg for mouse platelets. The PRP (platelet rich plasma) layer was separated, and washed platelets were obtained following a second 10 min centrifugation step (750xg for rabbit and cow, 500xg for mouse platelets). Pelleted platelets were resuspended in Tyrode’s buffer to a final concentration of 1 × 10⁷ platelets/mL.
2.2 CFMA Measurements
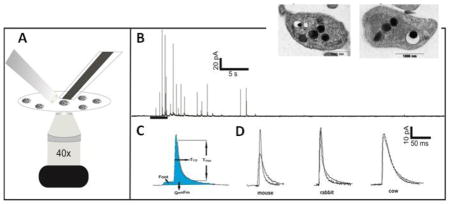
Carbon-fiber microelectrodes were fabricated as previously described. [11–14] Amperometry experiments were performed with an Axopatch 200B potentiostat (Molecular Devices, Inc., Sunnyvale, CA) using low-pass Bessel filtering (5 kHz), a sampling rate 20 kHz, and gain amplification of 20 mV/pA, all controlled by locally written LabVIEW software and National Instruments data acquisition boards. Platelets were visually monitored during experiments with an inverted microscope equipped with phase contrast optics (40X magnification) (Nikon Instruments, Melville, NY). A drop of platelet suspension was added to the poly-L-lysine-coated glass coverslips containing Tyrode’s buffer. As the platelets sedimented onto the coverslip, a carbon-fiber microelectrode was placed on an individual platelet for measurement (Figure 1A). A stimulant-filled fire-polished capillary with an average tapered diameter of 10 μm was also placed close to the platelet of interest. Upon delivery of a 3 s bolus of either 10 U/mL thrombin solution in Tyrode’s buffer or 10 μM ionomycin in Tyrode’s buffer supplemented with 2 mM Ca2+, the platelet under the microelectrode was activated. Serotonin secreted from platelet δ-granules was oxidized at a potential of 700 mV vs. Ag/AgCl reference electrode, and data were recorded for 90s. Each amperometric trace obtained from single platelet secretion was filtered at 500 Hz, and spike by spike analysis was performed using Mini Analysis software. The sub-millisecond temporal resolution of the CFMA technique enables real-time analysis of serotonin secretion from individual platelet granules, each appearing as an individual current spike in the amperometric trace (Figure 1C). The amount of serotonin released from a single granule is determined based on the area under the peak (Q= mFn; where Q is the charge, m is number of moles of serotonin, F is Faraday’s constant, and n is the number of electrons (2) transferred during serotonin oxidation). The kinetics of release are revealed based on the Trise and T1/2 values for each current spike, indicating the kinetics of transition from fusion pore to full fusion and kinetics of the total release event, respectively. Finally, the percentages of spikes with feet (a small amount of release before the spike) were counted as well. The percentage of spikes with foot features indicate the stability of the fusion pore opening. The number of platelets that were monitored per condition was 23 and 32 for mouse, 35 and 34 for rabbit, and 39 and 22 for cow for ionomycin and thrombin stimulation, respectively.
Figure 1.
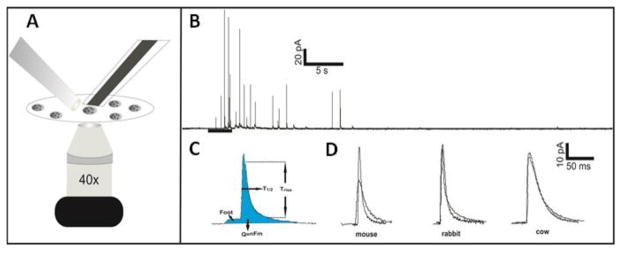
CFMA experimental setup and representative spikes. (A) Representative setup for CFMA measurements. The CFM (on the right) is placed on a single platelet. The stimulation pipette (on the left) is placed close to the platelet. (B) Typical amperometric trace obtained from single platelet secretion. Each spike corresponds to a single δ-granule release event. The bar under the trace shows time and the duration of the stimulation. (C) The parameters that are analyzed for single secretion events. (D) Representative spikes from mouse, rabbit and cow platelet exocytosis upon ionomycin (black) and thrombin (gray) stimulations
2.3 Bulk HPLC analysis
A similar bulk cell HPLC procedure was used as previously described. [15] Briefly, platelets in the PRP were diluted to 5×10⁷ cells/mL in Tyrode’s buffer. 125 μL of the diluted PRP was plated into a Millipore 96 well Multi Screen HTS filter plate with a 0.45 μm pore and mixed with 125 μL of either Tyrode’s buffer or Tyrode’s buffer containing stimulant to reach a final concentration of 10 μM ionomycin with 2 mM Ca2+ or 10 U/mL thrombin. After a five minute stimulation, the supernatant was spun down at 3000xg for five minutes, and 180 μL of the supernatant was pipetted into a vial with 20 μL of 5 μM dopamine internal standard in 0.5 M perchloric acid. HPLC analysis was performed on an Agilent 1200 HPLC with an auto sampler containing a 5μm, 4.6 × 150mm C18 column (Eclipse XDB-C18) attached to a Waters 2465 electrochemical detector with a glassy carbon-based electrode. The working potential was set at 700 mV vs. an in situ Ag/AgCl reference electrode with a current range up to 50 nA. The samples were separated on the HPLC column at a flow rate of 2 mL/min in an aqueous mobile phase mixture consisting of 11.6 mg/L of the surfactant sodium octyl sulfate, 170μL/L dibutylamine, 55.8 mg/L Na2EDTA, 10% methanol, 203 mg/L anhydrous sodium acetate, 0.1 M citric acid, and 120 mg/L sodium chloride. The ratio of serotonin to dopamine internal standard concentrations were then measured against a 5 point calibration curve made in advance using standard solutions of serotonin diluted in 0.5 M perchloric acid (ranging from 28 to 1000 nM serotonin). The standard solutions were supplemented with 0.5 μM dopamine internal standard.
2.4 TEM Measurements
TEM samples of cow and mouse platelets were prepared by two step fixation of the platelets first with 0.1% gluteraldehyde (15 min) followed by centrifugation to pellet and then with 3% gluteraldehyde (30 min) in White’s saline as has been previously described. [16] After fixation, the cell pellet was exposed to 1% osmic acid at 4°C for 1h. The platelet pellets were dehydrated slowly in a graded series of alcohol and embedded in Epon resin. Thin sections were obtained with a diamond knife. Uranyl acetate was used for contrast enhancement. TEM images captured on a JEOL 1200EX at an accelerating voltage of 60 keV were analyzed using ImageJ software.
2.5 CytoViva Scope Measurements
Darkfield scattering images were captured using an Olympus microscope from CytoViva (Auburn, Al) with an UplanFLM 100 x oil immersion objective and Dage XL camera. To prepare the slides, 4 μL of PRP were placed in the center of a cover slide. Gently, a coverslip was placed on top and sealed with clear nail polish. The un-activated platelets were imaged within 5–10 min of being places on the cover slip. The activated platelets were given 1.5 hours to activate on the coverslip before being imaged. The perimeter of the platelets was analyzed using ImageJ software.
2.6 Platelet Cholesterol and BCA Assay
Platelet concentration was calculated with a hemocytometer to ensure similar platelet counts between species. 250 μL aliquots were put into a 1.7 mL microcentrifuge tube and spun down at 1000 xg to pellet the platelets; the supernatant was removed, and the pellets were then used to measure cholesterol and total protein content.
Cholesterol levels were determined with an Amplex Red Assay from Life Technologies (Carlsbad, Ca) as directed. Briefly, the pellet was mechanically homogenized to expose the cholesterol to cholesterol oxidase. Hydrogen peroxide was produced in situ and exposed to Amplex Red to form resorufin. The resorufin absorbance at 571 nm was detected using a BioTek Synergy 2 96 well plate reader and a calibration curve was used to convert absorption intensity into concentration.
The protein content was quantified using a Pierce BCA Protein Assay kit from Thermo Scientific (Rockford IL) as directed. Briefly, a working reagent was prepared by mixing 50 parts of BCA Reagent A and 1 part BCA Reagent B. The PRP pellet was resuspended into 25 μL of mammalian protein extraction reagent, and 200 μL of working reagent was added to solution. After 30 min of incubation, the absorbance was measured at 562 nm on a BioTek Synergy 2 96 well plate reader and converted to a concentration using a calibration curve.
2.7 Plasma Cholesterol Assay
750 μL of whole blood from each species and 500 μL of tyrodes buffer was aliquoted into 1.7 mL eppendorf tubes. The blood was centrifuged down at 200 xg for 10 min with minimal braking. The plasma layer was removed and re-centrifuged at 1200 xg to remove remaining cells. 200 μL of plasma and 50 μL of the 1x reaction buffer included in the amplex red assay kit (described above) were aliquoted into eppendorf tubes. 50 μL was then placed into a 96 well plate for a total of 5 replicates per species. Finally, 50 μL of working solution was added to each well, and the reaction was left to proceed for 30 min, at which time fluorescence was measured.
2.8 Aggregation Assay
Aggregation experiments were performed on a Chrono-Log Whole Blood Lumi aggregometer interfaced with Aggro/Link software. The platelets were concentrated at 4 × 10⁷ platelets mL−1. 500 μL of platelet suspension was aliquoted into glass vials with a magnetic stir bar and placed in the aggregometer with a tyrodes blank. Once the recorded absorbance was stable at 100%, 20 μL of thrombin was added for a final concentration of 9.7 units mL−1 thrombin. The aggregation was monitored until the absorbance levels stabilized. Three biological replicates were performed in each condition. The data were plotted and statistically analyzed in Graphpad Prism.
2.9 Relative Quantitation of Selected Phospholipids using UPLC-MS/MS
The relative concentrations of selected platelet phospholipids were determined through a previously published ultra-performance liquid chromatography-tandem mass spectrometric (UPLC-MS/MS) method. Briefly, platelet concentrations were determined using a hemocytometer, and samples were diluted to ensure approximately the same platelet concentration for each species. PRP was aliquoted into glass tubes, and a modified Bligh & Dyer extraction was performed to obtain phospholipids. PRP samples were suspended in Tyrode’s buffer and mixed with 400 μL chloroform/200 μL methanol. As an internal standard, 10 μL of 19.1 μM deuterated platelet activating factor (PAF)-d4 (Cayman Chemical, Ann Arbor, MI) was added to the extraction mixtures, and PRP samples were sonicated for 20 min. Following sonication, 100 μL of 0.1% acetic acid in 0.1 M NaCl was added to the samples, and they were sonicated again for 10 min and centrifuged for 5 min at 1500 xg for separation of the organic and water layer. The organic layer was retained and dried under vacuum. Finally, the sample was resuspended in 40/60 A/B with 0.1% acetic acid mobile phase where A was 20 mM ammonium acetate (pH 5) and B is 90/10 acetonitrile/acetone.
For UPLC-MS/MS relative quantitation of the selected phospholipid species, a calibration curve was prepared from solutions composed of phosphatidyl-L-serine (PS), sphingomyelin (SM), phosphatidylethanolamine (PE), and phosphatidylcholine (PC) from Avanti Polar Lipids (Alabaster Al) and PAF-d4 internal standard. Calibration solutions were prepared without platelets and subjected to the same extraction procedure as PRP. [17] The samples and calibration curve were run on a Waters Acquity UPLC-MS/MS system in tandem with a Waters triple quadrupole mass spectrometer as previously described. [17] A modified version of chromatography suggested by Rainville and Plumb was used with a Waters BEH C8 2.1×100 mm column, and chromatography conditions as well as electrospray ionization mass spectrometry parameters can be found in Koseoglu, 2014.[17, 18]
3 Results
3.1 Comparison of the Lipid and Protein Content
Phospholipids, the primary component in cell membranes and granules, are important for maintenance of both the structure and function of cells. Upon exocytosis, lipids assist in localizing and activating the proteins needed to fuse granules and help change the rigidity of the fusion pore. [19] Even without proteins, manufactured lipid cells have been shown to mimic regular fusion. [20] In addition, significant variation in kinetics and secretion among different cell types with varying phospholipid concentrations suggest that the phospholipids facilitate and enhance fusion and exocytosis. [19,20] Due to their impact on exocytosis, the concentration of the four most common cell phospholipids, PC, PS, PE, and SM, were quantified then compared to the percent of each specific phospholipid in mouse platelets in Table 1. All phospholipid data are compared to mouse platelets, both because mice are the typical model organism and because the phospholipid standards contained a mixture of a primary phospholipid component as well as the presence of other tail lengths. In addition, the instrumental precision was calculated for each phospholipid. Comparison across the different species show a significant increase in phospholipid concentration for cows compared to an approximately equal number of mouse platelets for PS, PC, and SM. In particular, the PC and SM concentrations, two phospholipids known to be mainly located in the outer leaflet of the platelet membrane, have increased concentrations, approximately 3 to 10 fold more than mouse. By contrast, PS and PE, primarily inner leaflet phospholipids in unactivated platelets, show much smaller differences. The differences between mouse and rabbit (both which contain OCS) can only be seen in the concentration of PC, which is significantly smaller for rabbit.
Table 1.
Relative concentration of phospholipids compared to mouse+
| Phospholipid | Rabbit (%) | Mouse (%) | Cow (%) | Instrumental Precision (RSD) |
|---|---|---|---|---|
| Percent of PC compared to mouse PC (RSD) | 14.2 ± 7.1 ** | 100.0 ± 12.3 | 344.6 ± 13.3 *** | 8.6 |
| Percent of PS compared to mouse PS (RSD) | 101.3 ± 27.8 | 100.0 ± 4.7 | 181.8 ± 8.1 **** | 20.5 |
| Percent of PE compared to mouse PE (RSD) | 84.2 ± 24.7 | 100.0 ± 20.7 | 104.2 ± 17.8 | 12.3 |
| Percent of SM compared to mouse SM (RSD) | 109.1 ± 7.7 | 100.0 ± 11.6 | 1065.6 ± 15.6 **** | 4.1 |
Platelet concentrations for each of the three species were counted with a hemocytomer and diluted to the same concentration to ensure a similar number of platelets in each sample. All the data collected was then normalized to the mouse data.
p<0.01 vs. the respective mouse phospholipid,
p<0.0001 vs. the respective mouse phospholipid using one way ANOVA. Rabbit is also significantly (p<0.0001) different from cow for PC, PS, and SM. There is no difference between the three species for PE.
Cholesterol is another ubiquitous lipid species in cell membranes, with critical importance in membrane fluidity and curvature. Cholesterol regulates the spatial distribution of not only membrane phospholipids but the SNARE proteins involved in secretory events. [14, 20, 21] Platelets incubated in or depleted of cholesterol have shown significant variations in secretion kinetics, with platelets containing more cholesterol showing greater release times and more foot events. [14] Due to the role cholesterol plays in fusion pore stability, determining the cholesterol concentration may help explain some of the kinetic differences among species’ granule release. In addition to cholesterol content, it is important to understand the total protein to cholesterol content ratio. In studies where the ratios of lipids to proteins were varied, differences in lipid mixing during fusion were noted. In particular, SNARE proteins were studied and were shown to cause leakage and greater cell lysis as the ratio of proteins to lipids rose. [20, 22] The total protein content and cholesterol to protein ratio in each species is shown in Figure 2A and Figure 2B, respectively. Relative to mouse protein content, rabbit only contained 77.7 ± 9.0% and cow contained 690.4 ± 1.8% total protein. However, when comparing the cholesterol to protein ratio, the amount of cholesterol located in cow platelets is balanced out by the high concentration of protein compared to mouse giving 129.0 ± 15.7% μg cholesterol/μg protein cow to the 100.0 ± 39.2 % μg cholesterol/μg protein mouse. The rabbit cholesterol level was much lower than the protein level ratio only giving 30.7 ± 41.9 % μg cholesterol/μg protein compared to mouse. The concentration of cholesterol in platelets is not related to the amount found in the plasma of each species. Compared to mouse plasma, rabbit and cow plasma contained only 83 ± 4 % and 82 ± 6%, respectively, of the total amount of cholesterol (see data in Supplementary Information 1).
Figure 2.
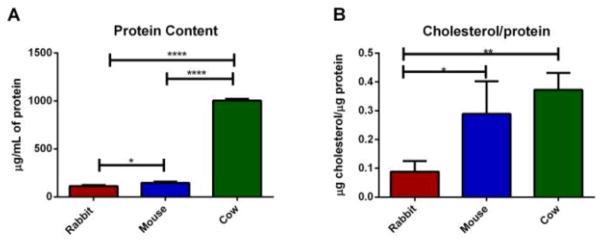
(A) Total % protein content for the same number of platelets compared to the total protein content of mouse platelets. (B) % ratio of the amount of cholesterol to the total protein content of platelets from each species compared to the mouse cholesterol ratio. Error bars are SD. For significance one way ANOVA was used * for p<0.05, ** for p<0.015, **** for p<0.0001
3.2 Platelet Perimeter
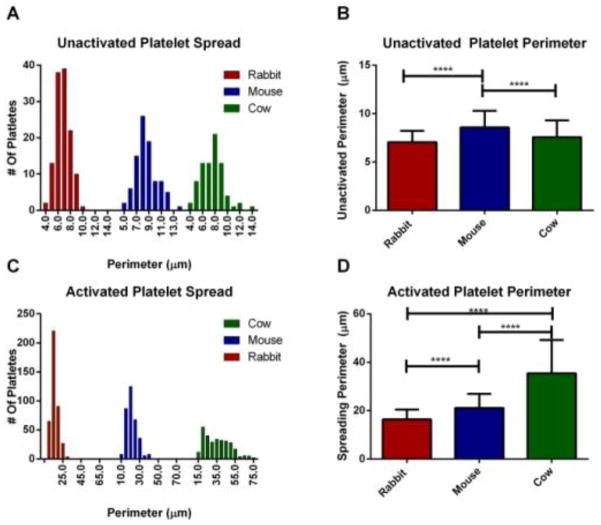
Due to the variance of phospholipids, cholesterol and protein in each of the species’ platelets, it is important to determine if these differences are correlated to platelet size. In addition, the OCS has been hypothesized to be involved in platelet spreading, thus the spreading perimeter will allow us to understand how having an OCS may change the size of activated platelets. The size of the platelets was measured on both unactivated (TEM) (Figure 3A and B) and activated (CytoViva scope) platelets (Figure 3C and D) by measuring the perimeter of platelets from each species. The distribution of the unactivated perimeter size for each of the three species has a span of approximately 5.5 to 10 μm with average perimeters and standard deviation of 7.06 ± 1.17 μm for rabbit, 8.58 ± 1.71 μm for mouse, and 7.57 ± 1.74 μm for cow (n=125, 91, and 79, respectively).
Figure 3.
Comparison of the platelet perimeter measured with Image J using TEM images for the un-activated platelets and darkfield microscopy images for activated platelets. Histogram of the perimeter of the unactivated platelets (A) and activated platelets (C) from each species showing the distribution of perimeters. The average perimeter is also shown for unactivated platelets (B) and activated platelets (D). Cow platelets show very little difference in their spread of perimeters and are approximately the same size as rabbit platelets when resting. However, upon activation, cow platelets have a wide spread and are significantly bigger than both mouse and rabbit. Significance was determined using one way ANOVA **** for p<0.0001. Error bars shown are SD.
Upon activation, the distance between the range of the total perimeter size increased. The majority of rabbit and mouse platelets had a range difference of 29.9 and 30.5μm respectively, while the majority of cow platelets had a span of 60.6 μm from the shortest to the longest perimeter of the platelets measured (Figure 3C). The average spreading perimeter and standard deviation (Figure 3D) for rabbit, mouse, and cow were 16.39 ± 4.07, 21.14 ± 5.81, 35.49± 13.72 μm, respectively. The activated shape of the platelets also varied between OCS and non-OCS species, with cow platelets creating a larger spread out square center with longer lamellipodia than either rabbit or mouse platelets. The rabbit platelets had shorter lamellipodia than either cow or mouse, but still maintained a similar center ellipse shape. Representative images of each of the species’ activated platelet structures can be seen in Figure 4. In addition to spreading on a coverslip, the aggregation of platelets in suspension upon activation with thrombin was monitored using an aggregometer (Supplimentary Information 2). Each species aggregated to a different extent with a 74 ± 8 %, 82 ± 4 %, and 90 ± 4 % change in absorption for rabbit, mouse, and cow, respectively.
Figure 4.

Activated platelet images for (A) rabbit, (B) mouse, and (C) cow using dark field microscopy. Scale bars are 10 μm.
3.3 Platelet Response to Different Stimuli
δ-granule secretion upon exposure to two different agonists was evaluated to determine effects caused by stimulation method vs. membrane structure. Figure 1D shows representative spikes corresponding to single release events upon thrombin (10 U/mL) or ionomycin (10 μM) stimulation of platelets isolated from different species. Although a numerical analysis of amperometric data is always needed, sometimes the shape of the representative spikes can reveal a lot about the amount and the kinetics of the secretion events. Except the mouse platelet, the spikes resulting from ionomycin and thrombin stimulation looked almost identical within the same species. Compared to the ionomycin stimulation spike, the representative spike for the thrombin-induced mouse platelet secretion is wider and shorter, indicating different secretion behavior that will be discussed later in detail. The representative spikes for cow platelets are both wider and larger than that of mouse and rabbit spikes. This indicates a slower but larger amount of serotonin release that will also be discussed below in detail.
3.3.1 Comparison of the Quantal Secretion among Different Species
Regardless of the stimulation type, cow platelets released significantly more serotonin per release event (Figure 5A and Figure 5D) than either mouse or rabbit platelets (Q= 275.7±25.1, Q= 331.2±25.9, and Q=498.5±40.9 fC for rabbit, mouse and cow platelet secretion, respectively upon ionomycin stimulation; Q=271.5±21.7, Q=313.9±29.5, and Q=654.9±116.4 fC for rabbit, mouse, and cow platelets secretion upon thrombin stimulation, respectively). Compared to cow platelets, both rabbit and mouse platelets released a significantly higher number of discrete δ-granules per exocytotic event (N= 9.6±1.3, 8.1±1.1, and 4.2±0.3 granules for rabbit, mouse and cow platelets, respectively, for ionomycin stimulation. For thrombin stimulation, N=17.2±2.1, N=6.9±0.6, N=3.0±0.3 for rabbit, mouse, and cow) (Figure 4B and 4E). Using Faraday’s Law, N and Q gives the average moles of serotonin released from each platelet; the number of moles of serotonin calculated from N*Q values by using Faraday’s Law are17.5×10−18, 13.8×10⁻¹⁸, 9.6×10⁻¹⁸ moles of serotonin/platelet for rabbit, mouse, and cow respectively, upon ionomycin stimulation and 24.5×10⁻¹⁸, 10.4×10⁻¹⁸, and 9.6×10⁻¹⁸ moles/platelet for thrombin stimulation.
Figure 5.
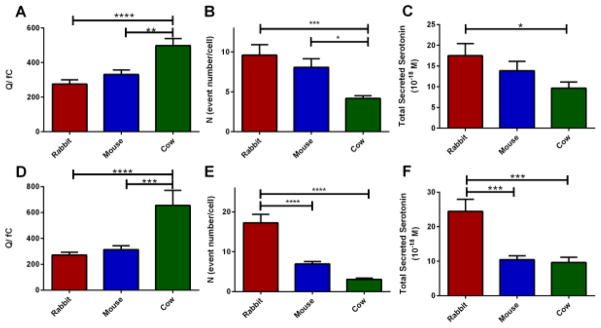
Comparison of the quantal release between the species upon ionomycin (A–C) (N = 23, 35, 39 for rabbit, mouse, and cow) and thrombin (D–F) (N= 32, 34, 22 for rabbit, mouse and cow) stimulations. (A, D) Cow platelets release significantly larger numbers of serotonin molecules per release event (as denoted by Q, the charge under the amperometric spike). (B, E) The number of granules released per single platelet exocytosis. (C, F) N*Q represents the total amount of serotonin secreted from individual platelets in each condition. Using one way ANOVA * for p<0.05, ** for p<0.01, *** for p< 0.001. Error bars are SD.
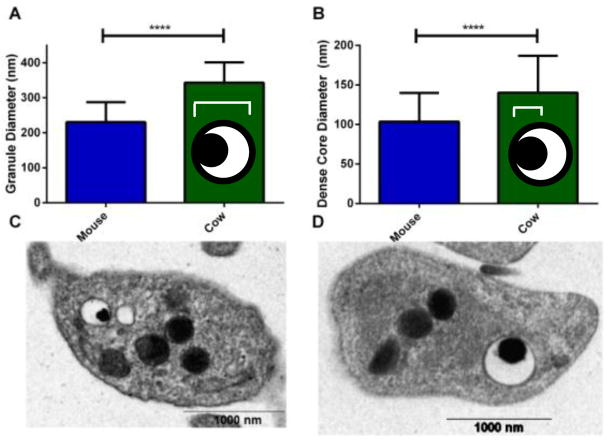
Previous studies on α-granule release in cow platelets show that they fuse with each other during exocytosis, prior to fusion with the plasma membrane. [23] A similar phenomenon for δ-granule release could explain the higher Q and lower N values for cow platelet secretion compared to the other two species. The frequency distribution of the Q values was analyzed (data not shown), expecting a bimodal distribution to show that a sub-population of δ-granules fuse with each other ahead of plasma membrane fusion. However, frequency analysis did not show such a distribution; a single non-Gaussian distribution similar to the previously reported distribution for rabbit granular release was observed instead, [13] making the possibility of fusion of two or more δ-granules unlikely. In addition, TEM images were used to analyze the size of δ-granules in cow and mouse platelets (Figure 6). Results showed that cow platelets not only have larger δ-granules but that the dense core of the δ-granules, where most of the serotonin is stored, is significantly larger in cow platelets (average granule diameter is 230.6±6.1 nm for mouse platelet δ-granules versus 343.0±11.1 nm for cow platelet granule). This larger dense core and granule are the likely reason that more serotonin is released during each individual event.
Figure 6.
TEM analysis of cow (26 granules) and mouse (86 granules) platelet δ-granules. Cow platelets, on average, have larger δ-granules (A) and dense core diameters (B). The cartoon granules show the distance measured for each graph Representative TEM images of a single mouse platelet (C) and cow platelet (D). Significance was determined with a T test **** for P< 0.0001 and error bars are standard deviation.
As described by Ewing and colleagues, it is not necessarily true that the entire content of a granule is released upon stimulation and exocytosis; in fact, PC12 cells, a model exocytotic cell, only release 45% of their vesicular content. [24] Herein, we evaluated the percentage of total δ-granule content release using bulk HPLC measurements by lysing the cells with HClO4 and analyzing the total serotonin content and comparing this amount with the serotonin released following exposure to either 10 U/ml thrombin or 10 μM ionomycin. Data presented in Figure 7 show the percent of total serotonin secreted upon stimulation for each species and stimulant. From the data, it is clear that more serotonin is released in OCS-containing species upon thrombin activation as compared to ionomycin activation. In both rabbit and mouse platelets, the granules release more than 50% of the total serotonin content; however, only 27.5 and 41.1% of the serotonin was released from cow platelets with ionomycin and thrombin stimulation, respectively (p<0.001). Application of human thrombin to stimulate non-human platelets cannot be the reason for this behavior since it has been shown previously that human thrombin was 89% homologous to cow thrombin, and cow platelets are known to respond similarly to human and cow thrombin. [6]
Figure 7.
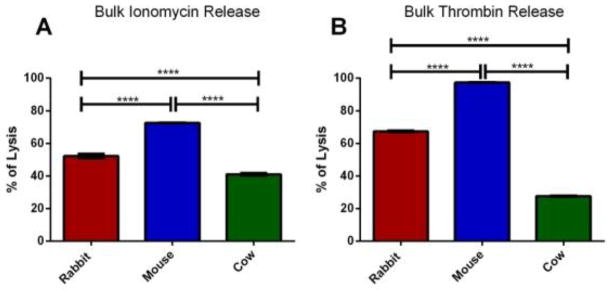
Bulk serotonin analysis using HPLC with electrochemical detection. % of the total serotonin secreted with (A) ionomycin stimulation or (B) thrombin stimulation. Using one way ANOVA **** for P<0.0001
This may indicate that the reduced cow platelet secretion, compared to that by rabbit and mouse platelets, may not be due to the effectiveness of the stimulant but efficiency of the response to the stimulant, perhaps related to the use of the OCS.
3.4 Comparison of the Secretion Kinetics among Different Species
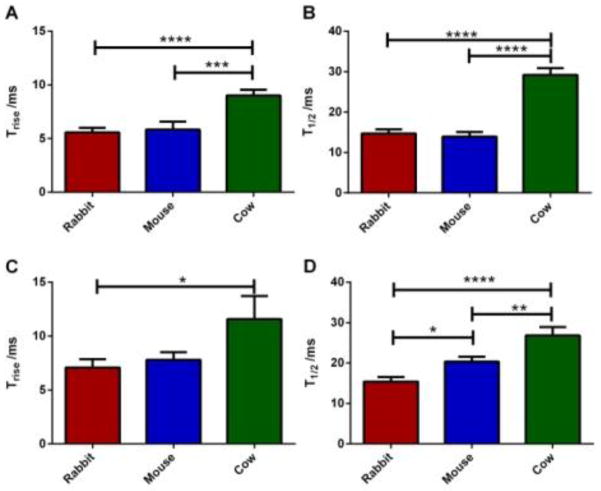
In amperometric traces, Trise values measure the time required for transition from 10% to 90% of the spike intensity maximum, revealing the chemical messengers secreted as the granule transitions from the initial pore opening to full fusion. During this time, the soluble (non-polyphosphate-associated) serotonin present in the granules is released. [25] In contrast, T1/2 is a measure of the total time of a serotonin secretion event which can be influenced by the opening of the fusion pore, the size of the expanded pore, dissolution of the matrix-bound serotonin, and diffusion of that serotonin into the extracellular space. When stimulated with ionomycin, cow platelets showed slower release kinetics than either rabbit or mouse platelets (larger Trise and T1/2 values) (Figure 8). Mouse and rabbit platelets showed comparable release kinetics upon ionomycin stimulation (T1/2= 13.9±1.1 and 14.7±1.1 ms for mouse and rabbit, respectively). Thrombin, however, induced distinct secretion behavior for each species. Although mouse and rabbit platelets release similar amounts of serotonin from δ-granules, mouse platelet secretion was much slower than that from rabbit platelets (T1/2= 20.3±1.2 and 15.4±1.2 ms for mouse and rabbit, respectively). Cow platelet secretion kinetics was slower in thrombin-induced stimulation with a T1/2 value of 26.8±2.1 ms compared to 29.2±.1.7 ms with ionomycin.
Figure 8.
Comparison of the secretion kinetics from individual granules with either (A, B) ionomycin or (C, D) thrombin stimulation. (A, C) Larger Trise values from cow platelet secretion indicate slower transition to maximal release. (B, D) Duration of the total secretion was longest in cow platelets regardless of the stimulant. Although the T1/2 values from rabbit and mouse platelets were similar in the ionomycin condition, thrombin stimulation resulted in higher T1/2 values, and thus, slower release from mouse platelets compared to rabbit platelets. Using one way ANOVA * for p<0.05, ** for p<0.015, *** for p<0.001, **** for p<0.0001 N values for Ionomycin stimulation are 23, 35, 39 for rabbit, mouse and cow respectively and 32, 34, 22 for thrombin stimulation. Error bars are representative of the standard deviation.
3.5 Comparison of Fusion Events between Species
During platelet granular secretion, fusion of the granular membrane with plasma membrane gives rise to a fusion pore of limited stability. Fusion pore formation and stability influences both the quantal release and kinetics of release. [26, 27] In amperometric traces, the fusion pore can be identified as a subtle increase in the current due to the diffusion of soluble serotonin as the fusion pore opens (Figure 1C); this current feature is commonly known as a “foot.” [25]
The analysis of the foot events among amperometric spikes shows that the stability of the fusion pore is highly dependent on the species and mechanism of the activation (Figure 9). Mouse platelets showed the highest, but not significant percent of fusion pore events when they were activated with ionomycin (18.1±3.6% of the mouse secretion events showed a foot feature as opposed to 9.5±2.0 and 13.5±2.5% fusion pore events in rabbit and cow exocytosis, respectively). Stimulation of mouse platelets with thrombin caused a drastic decrease in secretion events initiated through a stable fusion pore (9.3±2.3% events with foot). On the other hand, thrombin stimulation caused a significant increase in the stability of the fusion pore of rabbit and cow platelet dense granule secretion (%Foot= 15.0±2.1 and 23.7±5.1 for rabbit and cow platelets, respectively). This indicates that fusion pore stability based on the variations in formation of foot for rabbit, mouse and cow, is both species and stimulant dependent, and there is no correlation between the presence of OCS and fusion pore occurrence.
Figure 9.
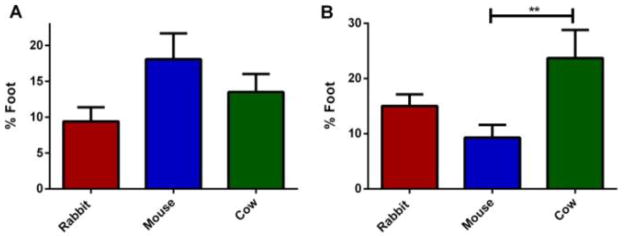
Platelet fusion pore analysis. (A) With ionomycin stimulation (B) Thrombin stimulation resulted in the most stable fusion pores in cow platelets, higher than those measured from mouse or rabbit platelets. Using one way ANOVA ** for p<0.01. Error bars are reported with standard deviation
4. Discussion
Revealing the differences among platelets of different species will help clarify the role of each component of platelet secretion and determine how a cell may compensate for a missing component. One of the major structural differences between platelets from different species is the presence of a system of tunneling invaginations from the plasma membrane known as the OCS. [4, 6, 28] Work done by various groups has demonstrated that the OCS influences platelet morphology during activation and that the presence of the OCS helps platelets interact with surfaces better by providing platelet spreading and pseudopodia formation. [23, 29] Moreover, it was shown that the OCS membrane contains SNARE proteins, including syntaxin 2, SNAP 23 and VAMP 3 and is involved in platelet granular secretion by serving as intermediate fusion sites for the granules before plasma membrane fusion. [28] However, the very active hemostatic function of camel platelets (lacking an OCS) raises the question of the actual need and use of these tubular structures in platelets. [4] In 2010, the Whiteheart group showed that the proteins that regulate the actin cytoskeleton are expressed at higher levels in OCS-containing platelets. [6] This work inspired the hypothesis that the OCS is critically involved in granule trafficking and docking ahead of chemical messenger secretion. During granule docking with the platelet plasma membrane, granules are thought to dock preferentially in cholesterol-rich microdomains which have been shown to contain almost twice as much SM and 4 times the amount of cholesterol compared to the regular membrane. [30] These sphingolipid/cholesterol rich microdomains are known to play a significant role in exocytosis due to their ability to stabilize the fusion pore and also concentrate certain soluble NSF attachment protein receptor (SNARE) proteins while excluding regulating SNARE proteins. [14, 21] This work shows that cow platelets contain a significantly greater concentration of SM, with over a 10 fold increase and a 600% increase in cholesterol compared to mouse and rabbit platelets, respectively even while accounting for unactivated platelet size. This excess cholesterol and SM could be an indication of the platelet being able to form a larger number of lipid rafts to facilitate granule docking since these platelets do not have an OCS which is easily accessible throughout the platelet. In addition, the cow δ-granules have shown greater stability than those from mouse or rabbit as seen by their longer trise, T1/2 times and also their ability to form more foot features (Figure 9). These trends of increased stability with increasing cholesterol have been seen in a previous work from our group. In this study rabbit platelets were depleted of 32% of their cholesterol using MβCD or incubated in cholesterol increasing the concentration to 132% of the original cholesterol content. As cholesterol increased, Trise, and foot features increased. [14] If a similar cause is the source of cow platelet behavior, this suggests that cow platelets, which do not contain an OCS, may have a membrane richer in lipids that are beneficial to stability during secretion.
Measurement of total serotonin content vs. total secreted serotonin with HPLC facilitates evaluation of the efficacy of the secretion among the OCS- and non-OCS containing platelets. Cow platelets release a drastically smaller percentage of total serotonin than either mouse or rabbit platelets. Furthermore, the parameter that was used to determine the kinetics of the secretion event (T1/2) was significantly larger for cow platelets. Although the higher T1/2 value may be due to the higher amount of serotonin secreted, it is possible that the absence of the tubular structure retarded secretion kinetics. All these observations indicate that OCS may not be necessary for chemical messenger secretion, but it indeed influences the efficacy of the release. Previous research has shown differences in “spreading” between platelets with and without an OCS. According to Grouse et al., “bovine platelets do not spread, they unfold” since only OCS platelets are able to fill in the spaces between pseudopods. One hypothesis for this difference in spreading behavior is that the OCS provides extra surface area upon activation and slight variations in the cytoskeletal organization. [29] However, even without the extra membrane space of the OCS, cow platelets are still able to increase their total perimeter to a much greater extent than either mouse or rabbit platelets. This is partially due to the long pseudopods that extend out into the extracellular environment (Figure 4). The range of activated cow platelet perimeters are spread out to a greater extent than either rabbit or mouse. In OCS platelets (mouse and human), it has been shown that alpha granules fuse with the plasma membrane and contribute to platelet spreading. [31] With the excess cholesterol and SM helping stabilize the granule, it would be reasonable for more granules to go through full fusion instead of endocytosing therefore helping spread. Due to the larger size of the dense body granule and slight variations in how many granules are able to reach the membrane, this amount of spreading would be widely variable within a population of platelets.
In conclusion, by using a variety of complimentary techniques to determine kinetic release, lipid composition, and imaging, we have demonstrated the similarities and differences in platelet δ-granule secretion behavior of platelets from different species and membrane composition. In addition, membrane lipid composition indicates that cow platelets may have increased their SM and cholesterol composition to compensate for the lack of OCS. Finally, variations in release between stimulants did not show trend changes except for percentage foot values, therefore indicating that release is affected to a greater extent by the composition of the platelet than the stimulation used to initiate activation.
Supplementary Material
Highlights.
This work explores the variations in cow, mice, and rabbit platelets
Carbon-fiber microelectrode amperometry explored single cell release
Platelets with an open canalicular system are more similar to each other
Cow platelets have a significantly larger amount of stabilizing lipids
Acknowledgments
This work was supported by a Searle Foundation Fellowship and NIH New Innovator Award to CLH. The authors would like to thank Allison Mayenschein for assisting in the rabbit blood draw as well as Christa Marten and Nathaniel McDonald from the University of Minnesota Dairy Department for cow blood draws. We also would like to thank Emily Woo and Dr. Shencheng Ge for allowing us to measure features in their rabbit platelet TEM images and Dr. Joseph J. Dalluge for help with the mass spectrometry method development.
Footnotes
Publisher's Disclaimer: This is a PDF file of an unedited manuscript that has been accepted for publication. As a service to our customers we are providing this early version of the manuscript. The manuscript will undergo copyediting, typesetting, and review of the resulting proof before it is published in its final citable form. Please note that during the production process errors may be discovered which could affect the content, and all legal disclaimers that apply to the journal pertain.
References
- 1.Saito H, Matsushita T, Yamamoto K, Kojima T, Kunishima S. Giant platelet syndrome. Hematology. 2005;10:41–46. doi: 10.1080/10245330512331389881. [DOI] [PubMed] [Google Scholar]
- 2.Baldini MG. Nature of the platelet defect in the Wiskott-Aldrich syndrome. Annals of the New York Academy of Sciences. 1972;201:437–444. doi: 10.1111/j.1749-6632.1972.tb16316.x. [DOI] [PubMed] [Google Scholar]
- 3.Zwaal RFA, Comfurius P, Bevers EM. Scott syndrome, a bleeding disorder caused by defective scrambling of membrane phospholipids. Biochimica Et Biophysica Acta-Molecular and Cell Biology of Lipids. 2004;1636:119–128. doi: 10.1016/j.bbalip.2003.07.003. [DOI] [PubMed] [Google Scholar]
- 4.Gader AG, Ghumlas AK, Hussain MF, Haidari AA, White JG. The ultrastructure of camel blood platelets: a comparative study with human, bovine, and equine cells. Platelets. 2008;19:51–58. doi: 10.1080/09537100701627151. [DOI] [PubMed] [Google Scholar]
- 5.Pelagalli A, Belisario MA, Tafuri S, Lombardi P, d’Angelo D, Avallone L, Staiano N. Adhesive properties of platelets from different animal species. J Comp Pathol. 2003;128:127–131. doi: 10.1053/jcpa.2002.0615. [DOI] [PubMed] [Google Scholar]
- 6.Choi W, Karim ZA, Whiteheart SW. Protein expression in platelets from six species that differ in their open canalicular system. Platelets. 2010;21:167–175. doi: 10.3109/09537101003611385. [DOI] [PMC free article] [PubMed] [Google Scholar]
- 7.White JG. Platelet membrane interactions. Platelets. 1999;10:368–381. doi: 10.1080/09537109975843. [DOI] [PubMed] [Google Scholar]
- 8.White J. Platelet Structure. In: Michelson A, editor. Platelets. 2. Amsterdam: Academic/Elsevier; 2007. pp. 45–74. [Google Scholar]
- 9.White JG. Platelet secretion during clot retraction. Platelets. 2000;11:331–343. doi: 10.1080/09537100050144759. [DOI] [PubMed] [Google Scholar]
- 10.Hikasa Y, Masuda K, Asakura Y, Yamashita Y, Sato C, Kamio M, Miura A, et al. Identification and characterization of platelet alpha(2)-adrenoceptors and imidazoline receptors in rats, rabbits, cats, dogs, cattle, and horses. European Journal of Pharmacology. 2013;720:363–375. doi: 10.1016/j.ejphar.2013.10.003. [DOI] [PubMed] [Google Scholar]
- 11.Ge S, Koseoglu S, Haynes CL. Bioanalytical tools for single-cell study of exocytosis. Anal Bioanal Chem. 2010;397:3281–3304. doi: 10.1007/s00216-010-3843-0. [DOI] [PubMed] [Google Scholar]
- 12.Ge S, Wittenberg NJ, Haynes CL. Quantitative and real-time detection of secretion of chemical messengers from individual platelets. Biochemistry. 2008;47:7020–7024. doi: 10.1021/bi800792m. [DOI] [PubMed] [Google Scholar]
- 13.Ge S, White JG, Haynes CL. Quantal release of serotonin from platelets. Anal Chem. 2009;101:2351–2359. doi: 10.1021/ac8024202. [DOI] [PubMed] [Google Scholar]
- 14.Ge SC, White JG, Haynes CL. Critical role of membrane cholesterol in exocytosis revealed by single platelet study. Chemical Biology. 2010;5:819–828. doi: 10.1021/cb100130b. [DOI] [PMC free article] [PubMed] [Google Scholar]
- 15.Gruba SM, Meyer AF, Manning BM, Wang Y, Thompson JW, Dalluge JJ, Haynes CL. Time- and concentration-dependent effects of exogenous serotonin and inflammatory cytokines on mast cell function. Chemical Biology. 2014;9:503–509. doi: 10.1021/cb400787s. [DOI] [PMC free article] [PubMed] [Google Scholar]
- 16.Platelets and megakaryocytes: Volume 1. functional assays. Towowa, NJ: Humana Press Inc; 2004. [Google Scholar]
- 17.Koseoglu S, Meyer AF, Kim D, Meyer BM, Wang Y, Dalluge JJ, Haynes CL. Analytical characterization of the role of phospholipids in platelet adhesion and secretion. Analytical Chemistry. 2014 doi: 10.1021/ac502293p18. [DOI] [PMC free article] [PubMed] [Google Scholar]
- 18.Rainville P, Plumb R. Separating phospholipids with UPLC/MS. Waters Application Note/ac. 2007 [Google Scholar]
- 19.Ammar MR, Kassas N, Chasserot-Golaz S, Bader M-F, Vitale N. Lipids in regulated exocytosis: what are they doing? Frontiers in Endocrinology. 2013;4:125–125. doi: 10.3389/fendo.2013.00125. [DOI] [PMC free article] [PubMed] [Google Scholar]
- 20.Churchward MA, Coorssen JR. Cholesterol, regulated exocytosis and the physiological fusion machine. Biochemical Journal. 2009;423:1–14. doi: 10.1042/BJ20090969. [DOI] [PubMed] [Google Scholar]
- 21.Salaun C, James DJ, Chamberlain LH. Lipid rafts and the regulation of exocytosis. Traffic. 2004;5:255–264. doi: 10.1111/j.1600-0854.2004.0162.x. [DOI] [PMC free article] [PubMed] [Google Scholar]
- 22.Dennison SM, Bowen ME, Brunger AT, Lentz BR. Neuronal SNAREs do not trigger fusion between synthetic membranes but do promote PEG-mediated membrane fusion. Biophys J. 2006;90:1661–1675. doi: 10.1529/biophysj.105.069617. [DOI] [PMC free article] [PubMed] [Google Scholar]
- 23.White JG. The secretory pathway of bovine platelets. Blood. 1987;69:878–885. [PubMed] [Google Scholar]
- 24.Omiatek DM, Dong Y, Heien ML, Ewing AG. Only a fraction of quantal content is released during exocytosis as revealed by electrochemical cytometry of secretory vesicles. Chemical Neuroscience. 2010;1:234–245. doi: 10.1021/cn900040e. [DOI] [PMC free article] [PubMed] [Google Scholar]
- 25.Kim D, Koseoglu S, Manning BM, Meyer AF, Haynes CL. Electroanalytical eavesdropping on single cell communication. Anal Chemistry. 2011;83:7242–7249. doi: 10.1021/ac200666c. [DOI] [PMC free article] [PubMed] [Google Scholar]
- 26.Amatore C, Bouret Y, Travis ER, Wightman RM. Interplay between membrane dynamics, diffusion and swelling pressure governs individual vesicular exocytotic events during release of adrenaline by chromaffin cells. Biochimie. 2000;82:481–496. doi: 10.1016/s0300-9084(00)00213-3. [DOI] [PubMed] [Google Scholar]
- 27.Koseoglu S, Love SA, Haynes CL. Cholesterol effects on vesicle pools in chromaffin cells revealed by carbon-fiber microelectrode amperometry. Anal and Bioanal Chemistry. 2011;400:2963–2971. doi: 10.1007/s00216-011-5002-7. [DOI] [PubMed] [Google Scholar]
- 28.Feng D, Crane K, Rozenvayn N, Dvorak AM, Flaumenhaft R. Subcellular distribution of 3 functional platelet SNARE proteins: human cellubrevin, SNAP-23, and syntaxin 2. Blood. 2002;99:4006–4014. doi: 10.1182/blood.v99.11.4006. [DOI] [PubMed] [Google Scholar]
- 29.Grouse LH, Rao GH, Weiss DJ, Perman V, White JG. Surface-activated bovine platelets do not spread, they unfold. Am J Pathol. 1990;136:399–408. [PMC free article] [PubMed] [Google Scholar]
- 30.Pike LJ, Han X, Chung KN, Gross RW. Lipid rafts are enriched in arachidonic acid and plasmenylethanolamine and their composition is independent of caveolin-1 expression: a quantitative electrospray ionization/mass spectrometric analysis. Biochemistry. 2002;41:2075–2088. doi: 10.1021/bi0156557. [DOI] [PubMed] [Google Scholar]
- 31.Peters CG, Michelson AD, Flaumenhaft R. Granule exocytosis is required for platelet spreading: differential sorting of alpha-granules expressing VAMP-7. Blood. 2012;120:199–206. doi: 10.1182/blood-2011-10-389247. [DOI] [PMC free article] [PubMed] [Google Scholar]
Associated Data
This section collects any data citations, data availability statements, or supplementary materials included in this article.


