Abstract
Tissues such as skeletal muscle and kidneys have well-defined structure that affects the measurements of mechanical properties. As an approach to characterize the material properties of these tissues, different groups have assumed that they are transversely isotropic (TI) and measure the shear wave velocity as it varies with angle with respect to the structural architecture of the organ. To refine measurements in these organs, it is desirable to have tissue mimicking phantoms that exhibit similar anisotropic characteristics. Some approaches involve embedding fibers into a material matrix. However, if a homogeneous solid is under compression due to a static stress, an acoustoelastic effect can manifest which makes the measured wave velocities change with the compression stress. We propose to exploit this characteristic to demonstrate that stressed tissue mimicking phantoms can be characterized as a TI material. We tested six phantoms made with different concentrations of gelatin and agar. Stress was applied by the weight of a water container centered on top of a plate on top of the phantom. A linear array transducer and a V-1 Verasonics system were used to induce and measure shear waves in the phantoms. The shear wave motion was measured using a compound plane wave imaging technique. Autocorrelation was applied to the received in-phase/quadrature data. The shear wave velocity, c, was estimated using a Radon transform method. The transducer was mounted on a rotating stage so measurements were made every 10° over a range of 0–360°, where the stress is applied along 0–180° direction. The shear moduli were estimated. A TI model was fit to the data and the fractional anisotropy was evaluated. This approach can be used to explore many configurations of transverse isotropy with the same phantom, simply by applying stress to the tissue mimicking phantom.
Keywords: shear wave, transverse isotropy, acoustoelasticity, stress
I. Introduction
There are a number of tissues that have structural architecture that leads to anisotropic distribution of mechanical properties. These tissues include skeletal muscle, myocardium, tendons, urinary bladder wall, the brain, arteries, and kidneys. Many groups have investigated the anisotropic shear moduli of tissue with different shear wave-based methods [1–14]. When shear wave elastography is used for studying these types of tissues it is important to take into account this anisotropic nature to obtain consistent results in a given patient population.
There has been recent interest in developing elasticity imaging phantoms for anisotropic materials in order to develop and refine techniques to accurately measure the material properties of such materials. Two examples involve embedded fibers or materials in a matrix of surrounding tissue mimicking material [11, 15].
In many cases, for simplicity, it is assumed that these types of tissues are transversely isotropic (TI). This type of material has one plane of anisotropy and perpendicular to this plane are planes of isotropy. A simple example is a skeletal muscle such as the biceps brachii where the muscle fibers are running in a preferential direction. In the plane perpendicular to the longitudinal direction of the fibers, there is a plane of isotropy where the fibers are arranged in a regular pattern [16]. The theory related to elastic TI materials has recently been presented by Wang, et al., for measurement of spatial group and phase velocities and the shear moduli associated with these values to describe the medium [10].
Though the fiber based phantoms have been successful in exhibiting TI behavior, it would be beneficial to use a homogeneous material and modify that material to exhibit TI characteristics. Therefore, we propose an alternative method for making a phantom that has TI behavior. In this study we used the concept of acoustoelasticity which relates the variation of the shear modulus of a material when a uniaxial stress is applied [17]. Acoustoelasticity in incompressible, tissue-like materials has been studied from a theoretical standpoint by multiple groups [18–20]. Applying the stress creates a condition where a homogeneous material exhibits anisotropic material behavior, which we characterized using the TI model previously presented by Wang, et al [10].
Application of stress while performing elastographic measurements has been seen as a source of bias in several elasticity imaging studies [21, 22]. However, acoustoelasticity has been used in the context of imaging nonlinear modulus and applied stress [23]. In this study, we use the same phenomenon to elicit TI material behavior.
Several phantoms were investigated at different levels of applied stress. The TI material properties were characterized for the different phantoms at different stress levels. The fractional anisotropy (FA) was also evaluated to quantify the level of anisotropy imposed by the stress application through compression of the phantom. Additionally, the data acquired at multiple angles for each stress level was used to estimate the values of the nonlinear shear modulus, A.
II. Methods
A. Theory
Acoustoelasticity in tissue mimicking materials has been previously investigated experimentally by Gennisson, et al. [17]. The premise of acoustoelasticity is that a material that has a nonlinear component of the shear modulus will exhibit a variation in the measured shear wave velocity (SWV) when a uniaxial stress is applied. The direction of the shear wave propagation with respect to the stress application is important to know because the relationships of the SWV variation change.
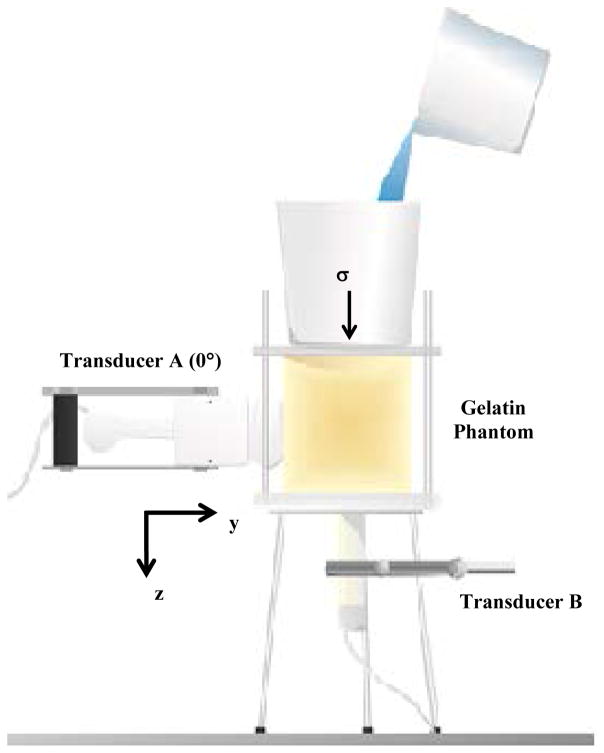
Figure 1 shows the setup of the phantom and the measurement of the SWV. The stress is applied vertically (along z-axis) by placing a container filled with water on top of a plate on the top surface of the phantom. One transducer (Transducer A) is placed on the side of the phantom and rotated in 10° steps (around y-axis). In Fig. 1 the transducer is shown at an orientation set at 0° (yz-plane) with respect to the applied stress. At each angular position, an acoustic radiation force push was transmitted into the phantom to generate shear waves. The shear wave velocity was quantified for the left and right traveling waves so two measurements 180° apart could be made for each rotation step of the transducer. We used 19 rotation steps to obtain data for all 360° of rotation. The other transducer (Transducer B) was placed in contact with the phantom through a rectangular hole in the bottom Plexiglass plate (yz-plane).
Fig. 1.
Experimental setup for compression of gelatin phantoms. Transducer A is placed on the side of the phantom and rotated with a motorized stage. In this image, the transducer is placed at θ = 0°. Transducer B is placed under the phantom. The uniaxial stress is applied with water placed in a container on top of the phantom.
The theoretical equations for the variation of the shear modulus at 0° (μ||) and 90° (μ⊥) with respect to the compression direction as measured with Transducer A are given as [17]
| (1) |
| (2) |
where μ0 is the linear shear modulus at a stress of σ = 0 Pa, A is the nonlinear shear modulus. These equations describe the changes that happen due to nonlinear effects within the phantom. It should be noted that Eq. (2) has a negative sign applied to the stress which is different from that defined by Gennisson, et al. We will address this change in more detail in the Discussion section with regards to the experimental measurements. Additionally, the shear modulus measured by the acquisitions from Transducer B is given as
| (3) |
The TI behavior for the shear moduli, which we are measuring in this experiment can be written as [10]
| (4) |
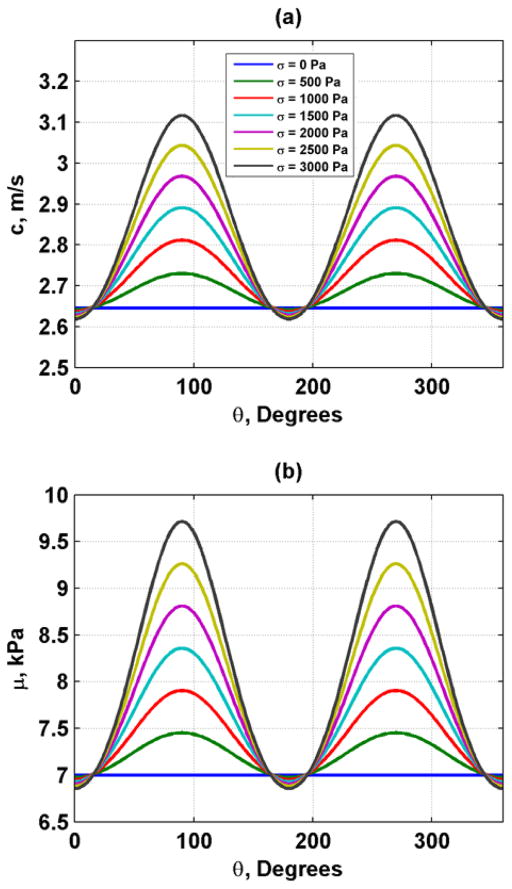
where θ is the angle with respect to the direction of compression. An example of the shear wave velocity and shear moduli for using values of μ0 = 7 kPa and A = −80 kPa for σ = 0, 500, 1000, 1500, 2000, 2500, 3000 Pa in Eqs. (1) and (2) and the values of substituted into Eq. (4) is shown in Fig. 2. We assume that for an elastic material
Fig. 2.
Induced anisotropic speed and shear moduli related to acoustoelasticity with μ0 = 7 kPa and A = −80 kPa. (a) Shear wave velocity, (b) Shear moduli.
| (5) |
where ρ is the mass density and c is the shear wave velocity.
Lastly, the fractional anisotropy of the shear modulus, FA, can be written as [6]
| (6) |
| (7) |
For an isotropic material FA = 0, but as anisotropy increases so does the value of FA up to a value of 1.0.
There are options for estimation of the nonlinear shear modulus A. The approach adopted by Gennisson, et al. was to solve Eqs. (1)–(3) for A and use the appropriate measurements to estimate A. Then an average value was taken of these three estimates. If the modulus is measured over several levels of applied stress and the whole angular range described by (4), then a robust surface fitting could be used such that more data points could be utilized.
B. Experiments
Six phantoms were made for evaluation. A cylindrical mold was used for the phantoms. Distilled water was used for all phantoms. Four of the phantoms were made with a constant percentage of agar (3% by weight) to be used as an ultrasound scatterer (Sigma-Aldrich, St. Louis, MO). Different concentrations of gelatin (Sigma-Aldrich, St. Louis, MO) were used (7, 8.25, 8.5, and 10% by volume). The phantom was made by heating the gelatin-agar mixture no higher than 50 °C to dissolve the gelatin. The mixture was cooled to 26–27 °C while it was constantly being mixed at a slow rate to avoid bubbles forming. The mixture was poured into a cylindrical mold surrounded by an ice water bath. All of the phantoms had a diameter of 13 cm. These phantoms are denoted with the concentration and “Gel.”
Two additional phantoms were made that activated the agar component. The gelatin concentration was kept constant at 2.94% and the agar concentrations were 1.15 and 1.80% by weight. To begin Laponite XLG (Southern Clay Products, Gonzales, TX) was added to water at a 0.8% concentration by weight and mixed at a high rate. The Laponite XLG helps to maintain the cellulose particles in suspension during curing of the phantom. The gelatin and agar were added and the mixture was brought up to the boiling point. By raising this mixture up to boiling the agar was activated and contributed to the stiffness of the phantom unlike the previously described four phantoms. Glycerol (Sigma-Aldrich, St. Louis, MO) was added with a concentration of 5% by volume for the purpose of adding durability to the phantom. These phantoms are denoted with the concentration and “Agar.” Table I contains all the components of the phantoms.
Table I.
Phantom characteristics. All concentrations are by weight except gelatin..
| Phantom | Agar, % | Water, % | Gelatin, % | Laponite, % | Glycerol, % |
|---|---|---|---|---|---|
| 7.00% Gel | 3.00 | 90.00 | 7.00 | N/A | N/A |
| 8.25% Gel | 3.00 | 88.75 | 8.25 | N/A | N/A |
| 8.50% Gel | 3.00 | 88.50 | 8.50 | N/A | N/A |
| 10.00% Gel | 3.00 | 87.00 | 10.00 | N/A | N/A |
| 1.15% Agar | 1.15 | 95.11 | 2.94 | 0.80 | 6.30 |
| 1.80% Agar | 1.80 | 94.46 | 2.94 | 0.80 | 6.30 |
We placed the phantom on a Plexiglass platform and brought the two transducers in contact with the phantom. Transducer A (L11-4v, Verasonics, Redmond, WA) was attached to a stepper motor (Compumotor, Parker Daedal, Irwin, PA) which could be rotated very precisely with a reduction gearbox (100:1, Applied Motion Products, Inc., Watsonville, CA) and microstepping control module (MC20 Indexer, Parker Daedal, Irwin, PA). This configuration had a resolution of 0.01°/microstep. The motor was rotated in 10° steps from 0–180° to obtain all 360° worth of data. Transducer B (L11-4v, Verasonics, Redmond, WA) was placed under the phantom. A Plexiglass plate was placed on top of the phantom as well as a large container to pour water into. The water was added in increments of either 400 or 600 mL. The distance between the plates was measured with digital calipers (Model 799A-6/150, Starrett, Inc., Athol, MA) and the stress was also calculated from the added volumes of water and the surface area of the phantom. The strain was calculated using ε = (l − l0)/l0, where l0 is measured with only the top plate above the phantom, and l is the distance measured at each step when water was added. The upper plate was leveled using a bubble level as well as the rotating motor fixture before every rotation was executed.
The data was acquired using a Verasonics system (V-1, Verasonics, Redmond, WA). The acquisition and analysis schemes were the same for the data obtained with Transducers A and B. The acoustic radiation force beam was focused in the middle of the array at a depth of 25 mm. Compound plane wave imaging with three angles (−4°, 0°, 4°) was used for detection of the motion [24]. Acquisitions were made with Transducer B before and after the rotations of Transducer A. The two results from Transducer B were averaged for reporting purposes. A one-dimensional autocorrelation algorithm was used to extract the particle velocity from the in-phase/quadrature data [25]. A Radon transform-based method was used to measure the SWV [26], which is similar to the method proposed by Hah, et al. [27]. The shear moduli values found using Eq. (5) at various angles were fit to the TI model in Eq. (4) and the FA was also calculated.
As mentioned previously, we solved Eqs. (1)–(3) for A. We used the values of μ||, μ⊥, and μB over the various values of applied stress and used a linear regression to estimate values of A. The R2 values from the regressions were recorded. These three values of A were then averaged. In addition, a surface fitting procedure using nonlinear least-squares fitting was used with all of the data at all angles and applied stress levels to obtain one estimate for A. The R2 from the surface fits were recorded as well. To account for the weight of the phantom material above the measurement level and its effective applied stress for Transducers A and B we used the relationship
| (8) |
where g is the gravitational acceleration constant 9.8 m/s2 and h is the height of the phantom above the measurement plane location and the values for σ0 for Transducers A and B are summarized in Table II.
Table II.
Phantom geometry and preloads.
| Phantom | Height, cm | σ0, Transducer A, Pa | σ0, Transducer B, Pa |
|---|---|---|---|
| 7.00% Gel | 8.9 | 490 | 774 |
| 8.25% Gel | 15.5 | 1127 | 1323 |
| 8.50% Gel | 8.9 | 490 | 774 |
| 10.00% Gel | 8.9 | 490 | 774 |
| 1.15% Agar | 14.4 | 890 | 1411 |
| 1.80% Agar | 13.7 | 617 | 1147 |
III. Results
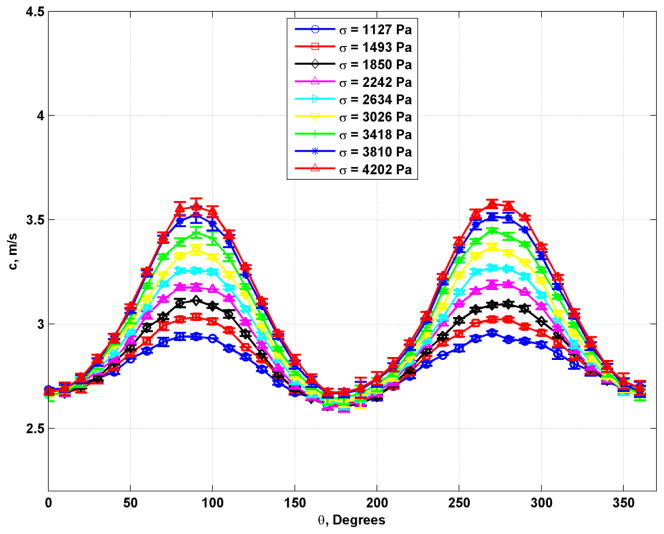
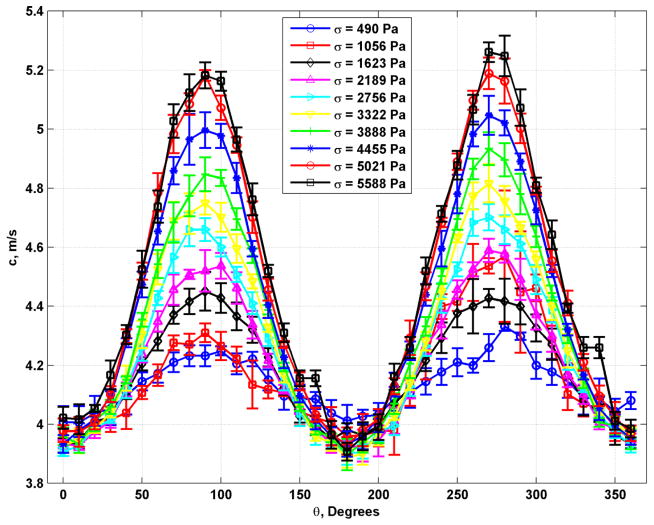
Figure 3 shows shear wave velocity results from the 8.25% gelatin phantom for measurements made at different compression states measured by the applied stress. The plots are mean and standard deviations with means and error bars calculated from averaging over 12 mm of depth in the phantoms. The plots show a clear variation in the shear wave velocity measured at different levels of compression. The first plot at σ = 1127 Pa showed variation even without the upper plate or water container, which can be explained by influence of the weight of the phantom imposing a compression at the point of measurement.
Fig. 3.
Plots of shear wave velocity with different applied values of stress for the phantom with 8.25% gelatin concentration.
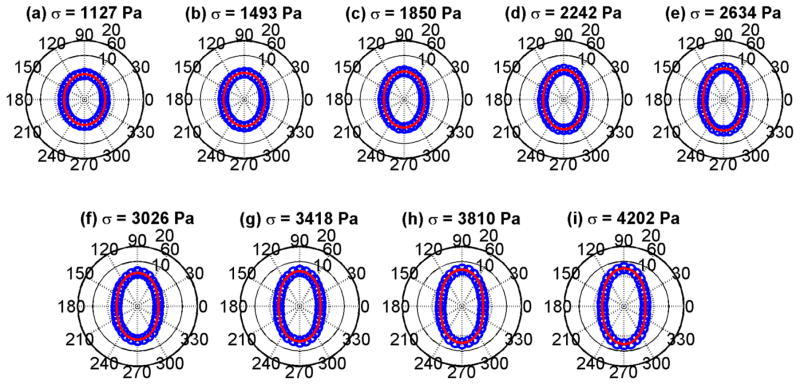
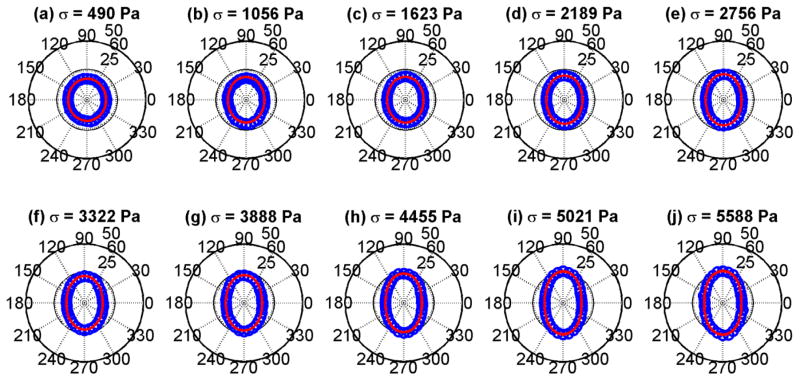
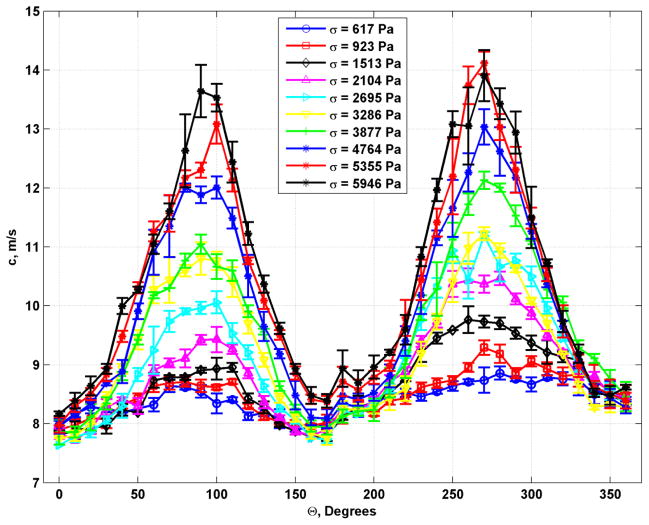
The mean values of the data in Fig. 3 were fit to Eq. (3). That fit by the red curves in Fig. 4 are shown with the mean values of the shear modulus derived from the shear wave speeds in Fig. 3. The fits are good and show a progression from a circular shape which implies isotropy to very elliptical shapes, implying increased anisotropy. The plots of shear wave velocity and shear modulus with TI model fits for the phantom with 10.00% gelatin concentration are shown in Figs. 5 and 6, respectively. Similar trends as were seen for the phantom with 8.25% gelatin concentration were seen in this phantom as well. Figures 7 and 8 show the results from the 1.80% agar phantom. This phantom was much stiffer than the gelatin phantoms. The level of anisotropy increases markedly with the applied stress as displayed in Fig. 8.
Fig. 4.
Polar plots of mean shear moduli (blue circles) and fit (red line) to the TI model from Eq. (3) for the phantom with 8.25% gelatin concentration. (a) σ = 1127 Pa, (b) σ = 1493 Pa, (c) σ = 1850 Pa, (d) σ = 2242 Pa, (e) σ = 2634 Pa, (f) σ = 3026 Pa, (g) σ = 3418 Pa, (h) σ = 3810 Pa, (i) σ = 4202 Pa.
Fig. 5.
Plots of shear wave velocity with different applied values of stress for the phantom with 10.00% gelatin concentration.
Fig. 6.
Polar plots of mean shear moduli (blue circles) and fit (red line) to the TI model from Eq. (3) for the phantom with 10.00% gelatin concentration. (a) σ = 490 Pa, (b) σ = 1056 Pa, (c) σ = 1623 Pa, (d) σ = 2189 Pa, (e) σ = 2756 Pa, (f) σ = 3322 Pa, (g) σ = 3888 Pa, (h) σ = 4455 Pa, (i) σ = 5021 Pa, (j) σ = 5588 Pa.
Fig. 7.
Plots of shear wave velocity with different applied values of stress for the phantom with 1.80% agar concentration.
Fig. 8.
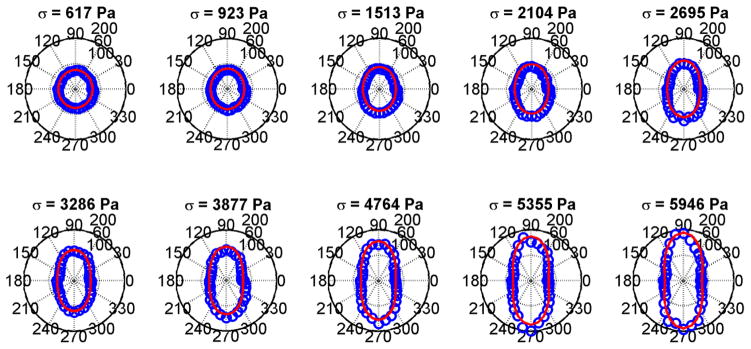
Polar plots of mean shear moduli (blue circles) and fit (red line) to the TI model from Eq. (3) for the phantom with 10.00% gelatin concentration. (a) σ = 617 Pa, (b) σ = 923 Pa, (c) σ = 1513 Pa, (d) σ = 2104 Pa, (e) σ = 2695 Pa, (f) σ = 3286 Pa, (g) σ = 3877 Pa, (h) σ = 4764 Pa, (i) σ = 5355 Pa, (j) σ = 5946 Pa.
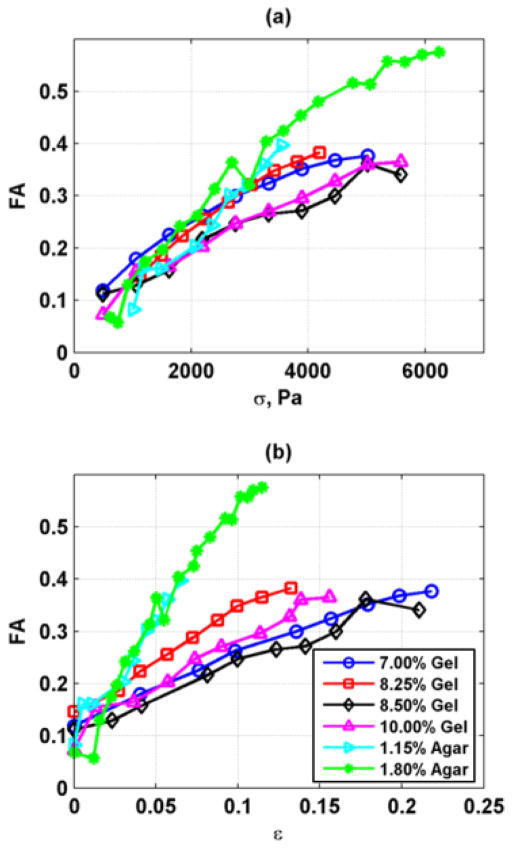
The summary of the FA results from the six phantoms is shown in Fig. 9. The results are plotted versus the applied stress (Fig. 9(a)) and the measured strain, ε (Fig. 9(b)). The agar phantoms require less strain to reach the same FA values. The FA values for the different phantoms range from 0.07–0.58. Previous measurements in ex vivo skeletal muscle have shown that FA = 0.44 [15]. The FA of shear elasticity of the human brachialis under loading ranged from 0.71–0.99 [2]. The results from the homogeneous phantoms cover a wide range even encompassing values of ex vivo tissue.
Fig. 9.
Summary of FA values for different gelatin and agar phantoms. (a) FA variation with applied stress, (b) FA variation with measured strain.
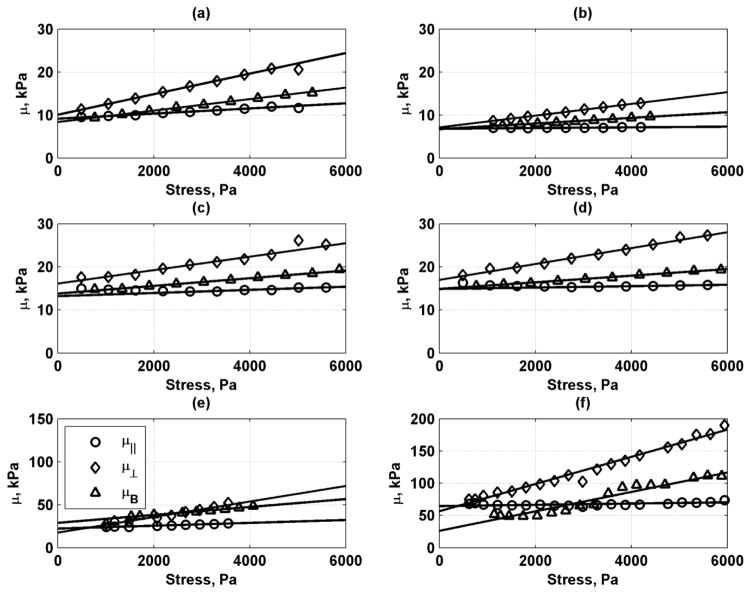
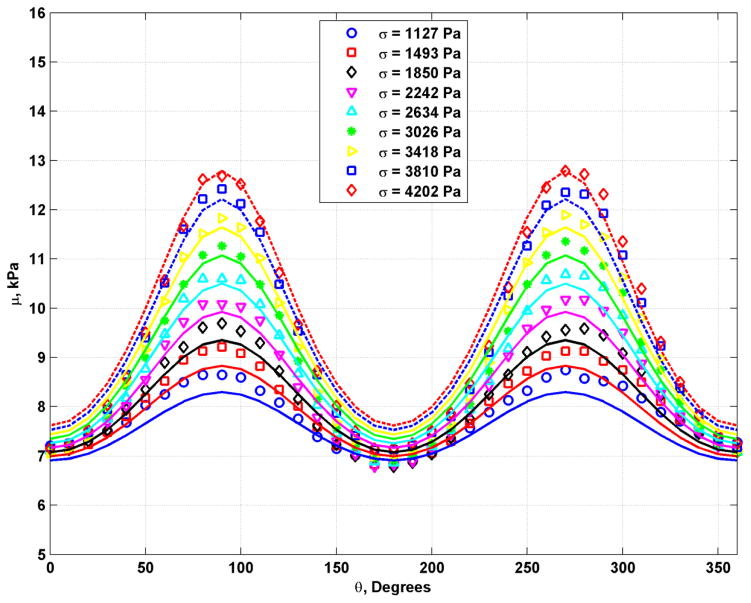
We used the data from Transducer A at θ = 0° (μ||) and θ = 90° (μ⊥) and the data from Transducer B to estimate values of μ0 and A for each phantom. The regressions of the values of μ||, μ⊥, and μB versus applied stress are shown in Fig. 10. In general, the regressions fit the data well and the R2 values ranged from 0.8192–0.9992. The estimated values of μ0 and A were summarized in Table III. The mean and standard deviations for the three directions were given under the headings of μ0,T and AT. We also fit the values of μ as a surface using Eq. (4) and a nonlinear least-squares method to find values of μ0,S and AS. The values found with this surface fit along with the 95% confidence intervals for each phantom are summarized in Table III. The R2 values for the fits ranged from 0.6730–0.9608. Figure 11 shows the fits between the data points and the surface fit profiles for the 8.25% phantom. There was generally good agreement in the values of μ0 and A between fitting the full surface and the three different directions.
Fig. 10.
Summary of regressions for μ||, μ⊥, and μB for different gelatin phantoms. (a) 7.00 % Gel, (b) 8.25 % Gel, (c) 8.50 % Gel, (d) 10.00 % Gel, (e) 1.15% Agar, (f) 1.80% Agar.
Table III.
Summary of estimation of A and μ0. All values are in kPa.
| Phantom | μ0,|| | A|| | μ0,⊥ | A⊥ | μ0,B | AB | μ0,T | AT | μ0,S | AS |
|---|---|---|---|---|---|---|---|---|---|---|
| 7.00% Gel | 9.13 | −178.87 | 10.05 | −204.53 | 8.35 | −139.58 | 9.18 ± 0.85 | −174.33 ± 32.71 | 9.29 (9.17, 9.41) | −181.7 (−180.1, −183.3) |
| 8.25% Gel | 6.79 | −88.12 | 7.10 | −100.82 | 6.71 | −52.58 | 6.87 ± 0.21 | −80.50 ± 25.01 | 6.65 (6.57, 6.73) | −98.2 (−97.5, −98.9) |
| 8.50% Gel | 13.19 | −215.94 | 16.10 | −247.31 | 13.78 | −147.43 | 14.36 ± 1.54 | −203.56 ± 51.08 | 14.76 (14.54, 14.98) | −236.4 (−231.4, −241.4) |
| 10.00% Gel | 14.86 | −206.94 | 16.95 | −289.25 | 14.86 | −137.11 | 15.56 ± 1.21 | −211.10 ± 76.16 | 15.47 (15.52, 15.71) | −253.5 (−247.6, −259.4) |
| 1.15% Agar | 22.22 | −710.29 | 17.52 | −1054.90 | 31.30 | −1730.2 | 23.68 ± 7.01 | −1165.10 ± 518.80 | 18.91 (18.15, 19.67) | −945.7 (−924.7, −966.8) |
| 1.80% Agar | 64.61 | −1519.90 | 56.58 | −7500.08 | 26.01 | −470.38 | 49.07 ± 20.37 | −3163.5 ± 3792.10 | 56.66 (54.39, 58.93) | −586.0 (−571.2, −600.9) |
Fig. 11.
Plots of shear moduli measurements as open symbols and fit (lines) to full data set for the phantom with 8.25% gelatin concentration.
IV. Discussion
This study examines a new method to utilize the phenomenon of acoustoelasticity and the induced anisotropy that comes with applied compressive stress on homogeneous phantoms. Similar empirical results have been shown with polyvinyl alcohol (PVA) phantoms in which a phantom was stretched and underwent multiple freeze-thaw cycles to induce anisotropy in the homogeneous material [28, 29]. Using a homogeneous phantom is much easier than embedding fibers in an external matrix [11, 15]. However, we have found that there is some residual compression that is maintained in the phantom at the end of the experiment, though this was not shown, so a particular phantom can only be used once.
The TI model in Eq. (4) was fit to the data from the phantoms as shown in Figs. 4, 6, and 8 and the fits were very good. In general, the minima of the data in Figs. 3, 5, and 7 were found at 0° and 180°, and the maxima were found at 90° and 270°, which indicated good alignment between the compression and the rotating transducer. The homogeneous material under compression has induced transverse isotropy that can be characterized using shear wave elastography methods. One interesting observation was that the data in Figs. 5 and 7 had a slightly linear increase with respect to angle. This could be due to a deviation in alignment in the phantom as discussed by Rouze, et al [30]. Another explanation may be the effect of loading due to the weight of the phantom leading to a vertical gradient as the SWV at angles 0–180° were measured higher in the phantom than the SWV values over 180–360° [17].
The range of FA values that can be achieved is very large as shown in Fig. 9 and even encompasses values found in ex vivo skeletal muscle [15]. The FA was found to be modified by the gelatin or agar concentration as well as the stress applied to the phantom. Additionally, materials that have different values of the nonlinear shear modulus, A, could be used to obtain phantoms with different ranges of FA.
Our estimation of the nonlinear shear modulus, A, differed slightly from that presented in Gennisson, et al., [17] particularly in using a different version of Eq. (2), where in this paper a negative sign was used preceding the stress term, where in the study reported by Gennisson, et al., had a plus sign. Fig. 10 shows that all the regressions had slopes that were either near zero or positive. Assuming that A is constant throughout the medium and is consistently negative from the measurements at 0° and from the bottom of the phantom, then Eq. (2) needs to have a negative sign as well to be consistent with the other measurement directions. As a result of these observations, we changed the sign in Eq. (2). We continue to work on understanding what is different between the theory proposed by Gennisson, et al., and our experiment, though the experiment is very similar to that performed in that paper.
We quantified the values of the linear and nonlinear shear moduli, μ0 and A using both the measurement angles and locations used by Gennisson, et al. [17], as well as surface fits of the data at multiple angles and applied stress levels. In general, the agreement between using the three distinct directions and the surface fitting provided close values. The surface fitting may provide a more robust approach because the number of data points used is significantly larger than using only three orientations for measurements, therefore, only one transducer may be able to be used. In general, the Gel phantoms had better precision for the estimated values of μ0 and A for the three different directions. One reason for this may be that the Agar phantoms have higher values of μ0 and it is known that the variation in shear wave velocity measurements is higher [31, 32]. These Agar phantoms may not represent normal soft tissue values, but could be used to represent cancerous inclusions. We did observe that the variation for measurement of μ0 was much less than for A. However, a similar level of variation between the three directions was also observed by Gennisson, et al [17].
V. Conclusion
This study examined the use of compression of homogeneous gelatin and agar phantoms to generate anisotropic behavior to be evaluated using shear wave-based methods. The TI model fit the data at different levels of stress very well. The fractional anisotropy varied over a wide range from nearly isotropic to anisotropy similar to ex vivo skeletal muscle. We estimated the values of the linear and nonlinear shear moduli using a nonlinear least-squares modelling fitting. This study offers a flexible method for using a homogenous phantom and generating TI material behavior that can be tested with shear wave elastography.
Acknowledgments
The authors extend their gratitude to the reviewers for their insights which improved this manuscript. This work was supported by grants R01DK092255 and R25DK101405 from the National Institute of Diabetes and Digestive and Kidney Diseases (NIDDK) and National Institutes of Health (NIH).
Footnotes
The content is solely the responsibility of the authors and does not necessarily represent the official views of the NIDDK and NIH.
References
- 1.Gennisson JL, Catheline S, Chaffai S, Fink M. Transient elastography in anisotropic medium: application to the measurement of slow and fast shear wave speeds in muscles. J Acoust Soc Am. 2003 Jul;114:536–41. doi: 10.1121/1.1579008. [DOI] [PubMed] [Google Scholar]
- 2.Gennisson JL, Deffieux T, Macé E, Montaldo G, Fink M, Tanter M. Viscoelastic and anisotropic mechanical properties of in vivo muscle tissue assessed by supersonic shear imaging. Ultrasound Med Biol. 2010;36:789–801. doi: 10.1016/j.ultrasmedbio.2010.02.013. [DOI] [PubMed] [Google Scholar]
- 3.Chen S, Urban MW, Pislaru C, Kinnick R, Zheng Y, Yao A, Greenleaf JF. Shearwave dispersion ultrasound vibrometry (SDUV) for measuring tissue elasticity and viscosity. IEEE Trans Ultrason Ferroelectr Freq Control. 2009 Jan;56:55–62. doi: 10.1109/TUFFC.2009.1005. [DOI] [PMC free article] [PubMed] [Google Scholar]
- 4.Urban MW, Greenleaf JF. A Kramers-Kronig-based quality factor for shear wave propagation in soft tissue. Phys Med Biol. 2009;54:5919–5933. doi: 10.1088/0031-9155/54/19/017. [DOI] [PMC free article] [PubMed] [Google Scholar]
- 5.Lee WN, Pernot M, Couade M, Messas E, Bruneval P, Bel A, Hagege AA, Fink M, Tanter M. Mapping myocardial fiber orientation using echocardiography-based shear wave imaging. IEEE Trans Med Imaging. 2012;31:554–562. doi: 10.1109/TMI.2011.2172690. [DOI] [PubMed] [Google Scholar]
- 6.Lee WN, Larrat B, Pernot M, Tanter M. Ultrasound elastic tensor imaging: comparison with MR diffusion tensor imaging in the myocardium. Phys Med Biol. 2012;57:5075–5095. doi: 10.1088/0031-9155/57/16/5075. [DOI] [PubMed] [Google Scholar]
- 7.Brum J, Bernal M, Gennisson JL, Tanter M. In vivo evaluation of the elastic anisotropy of the human Achilles tendon using shear wave dispersion analysis. Phys Med Biol. 2014;59:505. doi: 10.1088/0031-9155/59/3/505. [DOI] [PubMed] [Google Scholar]
- 8.Amador C, Urban MW, Chen S, Greenleaf JF. Shearwave Dispersion Ultrasound Vibrometry (SDUV) on swine kidney. IEEE Trans Ultrason Ferroelectr Freq Control. 2011;58:2608–2619. doi: 10.1109/TUFFC.2011.2124. [DOI] [PMC free article] [PubMed] [Google Scholar]
- 9.Gennisson JL, Grenier N, Combe C, Tanter M. Supersonic shear wave elastography of in vivo pig kidney: influence of blood pressure, urinary pressure and tissue anisotropy. Ultrasound Med Biol. 2012;38:1559–1567. doi: 10.1016/j.ultrasmedbio.2012.04.013. [DOI] [PubMed] [Google Scholar]
- 10.Wang M, Byram B, Palmeri M, Rouze N, Nightingale K. Imaging transverse isotropic properties of muscle by monitoring acoustic radiation force induced shear saves using a 2-D matrix ultrasound array. IEEE Trans Med Imaging. 2013;32:1671–1684. doi: 10.1109/TMI.2013.2262948. [DOI] [PMC free article] [PubMed] [Google Scholar]
- 11.Qin EC, Sinkus R, Geng G, Cheng S, Green M, Rae CD, Bilston LE. Combining MR elastography and diffusion tensor imaging for the assessment of anisotropic mechanical properties: A phantom study. J Magn Reson Imaging. 2013;37:217–226. doi: 10.1002/jmri.23797. [DOI] [PubMed] [Google Scholar]
- 12.Papazoglou S, Rump J, Braun J, Sack I. Shear wave group velocity inversion in MR elastography of human skeletal muscle. Magn Reson Med. 2006;56:489–497. doi: 10.1002/mrm.20993. [DOI] [PubMed] [Google Scholar]
- 13.Feng Y, Okamoto RJ, Namani R, Genin GM, Bayly PV. Measurements of mechanical anisotropy in brain tissue and implications for transversely isotropic material models of white matter. 2013;23:117–132. doi: 10.1016/j.jmbbm.2013.04.007. [DOI] [PMC free article] [PubMed] [Google Scholar]
- 14.Urban MW, Nenadic IZ, Pislaru C, Greenleaf JF. Measurement of longitudinal and circumferential waves in tubes and artery excited with ultrasound radiation force. 2013 IEEE International Ultrasonics Symposium; Prague, Czech Republic. 2013. pp. 1765–1768. [Google Scholar]
- 15.Aristizabal S, Amador Carrascal C, Kinnick RR, Nenadic IZ, Greenleaf JF, Urban MW. Ultrasound-based shear wave evaluation in transverse isotropic tissue mimicking phantoms and muscle. Proceedings of Meetings on Acoustics; 2014. p. 075004. [DOI] [PMC free article] [PubMed] [Google Scholar]
- 16.Neill JO. Musculoskeletal Ultrasound: Anatomy and Technique. New York, NY: Springer Science+Business Media, LLC; 2008. [Google Scholar]
- 17.Gennisson JL, Renier M, Catheline S, Barriere C, Bercoff J, Tanter M, Fink M. Acoustoelasticity in soft solids: Assessment of the nonlinear shear modulus with the acoustic radiation force. J Acoust Soc Am. 2007 Dec;122:3211–3219. doi: 10.1121/1.2793605. [DOI] [PubMed] [Google Scholar]
- 18.Hamilton MF, Ilinskii YA, Zabolotskaya EA. Separation of compressibility and shear deformation in the elastic energy density. J Acoust Soc Am. 2004;116:41–44. [Google Scholar]
- 19.Destrade M, Gilchrist MD, Saccomandi G. Third- and fourth-order constants of incompressible soft solids and the acousto-elastic effect. J Acoust Soc Am. 2010;127:2759–2763. doi: 10.1121/1.3372624. [DOI] [PubMed] [Google Scholar]
- 20.Destrade M, Gilchrist MD, Ogden RW. Third- and fourth-order elasticities of biological soft tissues. J Acoust Soc Am. 2010;127:2103–2106. doi: 10.1121/1.3337232. [DOI] [PubMed] [Google Scholar]
- 21.Syversveen T, Midtvedt K, Berstad A, Brabrand K, Strøm E, Abildgaard A. Tissue elasticity estimated by acoustic radiation force impulse quantification depends on the applied transducer force: an experimental study in kidney transplant patients. Eur Radiol. 2012 Oct 01;22:2130–2137. doi: 10.1007/s00330-012-2476-4. [DOI] [PubMed] [Google Scholar]
- 22.Barr RG, Zhang Z. Effects of precompression on elasticity imaging of the breast: development of a clinically useful semiquantitative method of precompression assessment. J Ultrasound Med. 2012 Jun 1;31:895–902. doi: 10.7863/jum.2012.31.6.895. [DOI] [PubMed] [Google Scholar]
- 23.Latorre-Ossa H, Gennisson JL, De Brosses E, Tanter M. Quantitative imaging of nonlinear shear modulus by combining static elastography and shear wave elastography. IEEE Trans Ultrason Ferroelectr Freq Control. 2012;59:833–839. doi: 10.1109/TUFFC.2012.2262. [DOI] [PubMed] [Google Scholar]
- 24.Montaldo G, Tanter M, Bercoff J, Benech N, Fink M. Coherent plane-wave compounding for very high frame rate ultrasonography and transient elastography. IEEE Trans Ultrason Ferroelectr Freq Control. 2009 Mar;56:489–506. doi: 10.1109/TUFFC.2009.1067. [DOI] [PubMed] [Google Scholar]
- 25.Kasai C, Namekawa K, Koyano A, Omoto R. Real-time two-dimensional blood flow imaging using an autocorrelation technique. IEEE Trans Son Ultrason. 1985;SU-32:458–64. [Google Scholar]
- 26.Urban MW, Greenleaf JF. Use of the radon transform for estimation of shear wave speed. J Acoust Soc Am. 2012;132:1982–1983. [Google Scholar]
- 27.Hah Z, Hazard C, Mills B, Barry C, Rubens D, Parker K. Integration of crawling waves in an ultrasound imaging system. Part 2: Signal processing and applications. Ultrasound Med Biol. 2012;38:312–323. doi: 10.1016/j.ultrasmedbio.2011.10.014. [DOI] [PMC free article] [PubMed] [Google Scholar]
- 28.Millon LE, Mohammadi H, Wan WK. Anisotropic polyvinyl alcohol hydrogel for cardiovascular applications. Journal of Biomedical Materials Research Part B: Applied Biomaterials. 2006;79B:305–311. doi: 10.1002/jbm.b.30543. [DOI] [PubMed] [Google Scholar]
- 29.Chatelin S, Bernal M, Deffieux T, Papadacci C, Flaud P, Nahas A, Coccara, Gennisson JL, Tanter M, Pernot M. Anisotropic polyvinyl alcohol hydrogel phantom for shear wave elastography in fibrous biological soft tissue: a multimodality characterization. Phys Med Biol. 2014;59:6923. doi: 10.1088/0031-9155/59/22/6923. [DOI] [PubMed] [Google Scholar]
- 30.Rouze NC, Wang MH, Palmeri ML, Nightingale KR. Finite element modeling of impulsive excitation and shear wave propagation in an incompressible, transversely isotropic medium. J Biomech. 2013;46:2761–2768. doi: 10.1016/j.jbiomech.2013.09.008. [DOI] [PMC free article] [PubMed] [Google Scholar]
- 31.Urban MW, Chen S, Greenleaf JF. Error in estimates of tissue material properties from shear wave dispersion ultrasound vibrometry. IEEE Trans Ultrason Ferroelectr Freq Control. 2009 Apr;56:748–758. doi: 10.1109/TUFFC.2009.1097. [DOI] [PMC free article] [PubMed] [Google Scholar]
- 32.Wang M, Byram B, Palmeri M, Rouze N, Nightingale K. On the precision of time-of-flight shear wave speed estimation in homogeneous soft solids: initial results using a matrix array transducer. IEEE Trans Ultrason Ferroelectr Freq Control. 2013;60:758–770. doi: 10.1109/TUFFC.2013.2624. [DOI] [PMC free article] [PubMed] [Google Scholar]


