Abstract
Objectives
The aim of this study was to determine the concentrations of the photosensitizer (camphoroquinone, CQ) and coinitiator (Ethyl-4-dimethylaminobenzoate, EDMAB) that resulted in maximum conversion but generated minimum contraction stress in experimental composites.
Methods
Experimental composites were prepared with an identical resin formulation [TEGDMA:UDMA:bis-GMA of 30.25:33.65:33.65]. Five groups of resin were prepared at varied CQ concentrations (0.1, 0.2, 0.4, 0.8 and 1.6wt% of the resin). Five subgroups of resin were prepared at each level of CQ concentration, by adding EDMAB at 0.05, 0.1, 0.2, 0.4 and 0.8wt% of the resin, resulting in 25 experimental resins. Finally, strontium glass (~3μm) and silica (0.04μm) were added at 71.5wt% and 12.6wt% of the composite, respectively. Samples (n=3) were then evaluated for KHN, DC, depth of cure (DoC) and contraction stress (CS).
Results
There was an optimal CQ and EDMAB concentration that resulted in maximum DC and KHN, beyond which increased concentration resulted in a decline in those properties. KHN testing identified two regions of maxima with best overlaps occurring at CQ:EDMAB ratio of 1.44:0.42 and 1.05:1.65mol%. DC evaluation showed one region of maximum, the best overlap occurring at CQ:EDMAB ratio of 2.40: 0.83mol%. DoC was 4mm. Overall, maximum CS was attained before the system reached the maximum possible conversion and hardness.
Conclusions
1- Selection of optimal photoinitiator/amine concentration is critical to materials' formulation, for excessive amounts can compromise materials' properties. 2- There was no sufficient evidence to suggest that contraction stress can be reduced by lowering CQ/EDMAB concentration without compromising DC and KHN.
Introduction
Camphoroquinone (CQ) is a widely used photosensitizer that requires a co-initiator, typically a tertiary amine, to efficiently initiate the polymerization of light-activated methacrylate resin-based materials like dental composites [1]. The concentration of CQ and that of the coinitiator molecules is known to have a significant effect on polymerization [2,3]. However, use of a more than optimal concentration may compromise the esthetics of dental composite restorations due to the influence of residual, un-reacted CQ molecules. In addition, a high CQ concentration may also compromise the overall biocompatibility of the corresponding materials due to leaching of the excess, un-reacted CQ molecules into the saliva and surrounding tissues.
On the other hand, a less than adequate concentration of the photosensitizer results in inadequate polymerization and has been associated with poor biocompatibility [4-7], poor color stability [8], poor physical and mechanical properties [9], poor wear resistance [10, 11], and potentially early failure of the restoration. Therefore, it is critical to use the minimum (optimal) concentration of CQ required to cause maximum polymerization so as to enhance biocompatibility without compromising the physical and mechanical properties of the corresponding material. It is however important to recognize that the relative concentration of CQ to that of the amine (i.e., CQ: amine ratio) required to cause maximum polymerization of a given polymer system varies depending on the type of amine [3]. Thus the CQ to amine ratio required for the maximum polymerization of a given monomer system with a given amine does not apply when another type of amine is used.
It is very important to be aware of the complexity of light-activated polymerization and the impact of external factors on the kinetics of the reaction. A good match between the absorption spectrum of the photoinitiator (e.g., CQ) and emission spectrum of the light source is critical to the efficient excitation of CQ molecules. The CQ molecule in the excited triplet state upon encountering an amine molecule forms a triplet exciplex that then disintegrates into free radicals that initiate polymerization [12]. There is limited time for the formation of the triplet exciplex (half-life of CQ triplet is ~0.05s), otherwise CQ triplet decays to the ground state (phosphorescence) without formation of free-radicals. Other factors constant (including CQ concentration), the probability of any encounter of CQ (triplet state) with an amine molecule is dependent on the concentration and diffusivity of amine molecules within the system. It is reasonable to expect a point of saturation beyond which increasing the concentration of amine molecules at a given (optimal) CQ concentration, or vice versa, does not translate into an increase in free-radicals or DC (assuming a direct correlation between free-radicals generated and DC). While Ethyl-4-dimethylaminobenzoate (EDMAB) is a commonly used amine in commercial dental composites, the optimal concentration of CQ and EDMAB required for the maximum polymerization of resin composites is still unknown.
Previous studies that have evaluated the effect of photoinitiator and amine accelerator concentration on polymerization did not take into consideration the corresponding effects on the magnitude of contraction stress generated in the polymer [2,3]. It is known that polymerization is accompanied by a reduction in total volume of the material, commonly referred to as volumetric or polymerization shrinkage. This shrinkage leads to generation of contraction stress within resin-based restorations and at their interfaces with the tooth structure, and has been associated with microleakage [13–15]. While there is no proven relationship, microleakage is often associated with recurrent caries and subsequent failure of the corresponding restoration [16,17]. It would therefore be desirable to formulate a resin composite in which the CQ and amine concentration is just sufficient for the initiation of maximum polymerization, while generating minimal of contraction stresses. While it is important to keep contraction stress at a minimum, it is also critical that sufficient cure depth is achieved. Hence, any attempt to systematically control CQ and amine concentration to achieve adequate polymerization and low contraction stresses must also take into consideration the fact that sufficient cure depth (at least 2 mm) is achieved.
The aim of this study was to determine the minimum concentration of CQ and Ethyl-4-dimethylaminobenzoate that causes maximum polymerization, minimum contraction stress and sufficient depth of cure (i.e., DoC of at least 2mm). Maximum polymerization was determined as a function of degree of conversion (DC) and Knoop hardness (KHN), for DC and KHN are directly correlated with the extent of polymerization of resin composite [18]. It was hypothesized that DC and KHN will reach a peak value at a given CQ and amine concentration (i.e., optimal concentration), and that a reduction in contraction stress may be achieved by lowering CQ and amine concentration below the optimum values without causing a significant reduction in the ultimate KHN and DC.
Materials and Methods
Preparation of experimental resin composites
Experimental resin formulations were prepared with about equal ratios of triethylene glycol dimethacrylate (TEGDMA), urethane dimethacrylate (UDMA), and bisphenol-A-glycidyldimethacrylate (bis-GMA) (30.25:33.65:33.65). Five groups of resin formulations in which the concentration of the photosensitizer (CQ) was systematically varied as 0.1, 0.2, 0.4, 0.8 and 1.6 wt% of the resin were prepared. Five subgroups of resin formulations were prepared at each level of CQ concentration, whereby the amine (ethyl-4-dimethylaminobenzoate, EDMAB) concentration was systematically varied as 0.05, 0.1, 0.2, 0.4 and 0.8 wt% of the resin, making a total of 25 experimental resin formulations. The inhibitor (4-methoxy phenol) at the concentration 0.05wt% of the resin was added to each of the resin formulations. Finally, experimental resin composites were prepared by adding silanated strontium glass (Sr, 1–3 μm; Bisco Inc., Schaumburg, IL) and colloidal silica (OX-50, 0.04 μm; Degussa, Germany) to each of the resin formulations at 71.5wt% and 12.6wt% of the total composite weight, respectively.
Specimen Preparation
The specimens were fabricated in a class II slot cavity (dimensions = 4.5 mm buccal-lingual at the occlusal, 4.0 mm buccal-lingual at the gingival, 1.5 mm mesio-distally and 6.0 mm occluso-gingival height) prepared in an extracted human molar tooth using a #57 carbide bur and a high-speed hand piece with water as the coolant. The occlusal surface of the tooth was flattened with a 180 grit belt sander (Surfmet I, Buehler, Lake Bluff, IL USA). The cavity was cleaned under streaming water, air-dried, and a very thin smear of release agent (petroleum jelly) was applied on the walls of the cavity. A metal matrix band was placed such that the coronal portion was level with the height of the crown and secured, apical to the cavity preparation, with a hemostat. Uncured composite was incrementally packed to slightly overfill the cavity, covered with a clear matrix strip, and leveled to the height of the tooth by placing a glass slide over the matrix and gently pressing down until the glass slide was flush with the flattened occlusal surface. The glass slide was removed and the resin composite was cured from the occlusal surface by placing the light tip of the quartz halogen light in direct contact with the Mylar and irradiating for 60 s at 575 mW/cm2 (Fig. 1). The light tip was centered over the sample by aligning marks on the tooth (mold) and edge of the light tip. The polymerized samples (n=3) were stored in light-tight containers for 24 hr before being cast in an acrylic ring using metallographic epoxy (Buehler, Lake Bluff, IL). The specimens were then sectioned midway, occluso-gingivally, with a cut-off saw (Struers Accutom-5, Copenhagen, Denmark) under streaming water, wet sanded with 600 grit silicon carbide, and polished with 1000 grit aluminum oxide slurry. Each sample was tested for both Knoop hardness and degree of conversion.
Fig. 1.
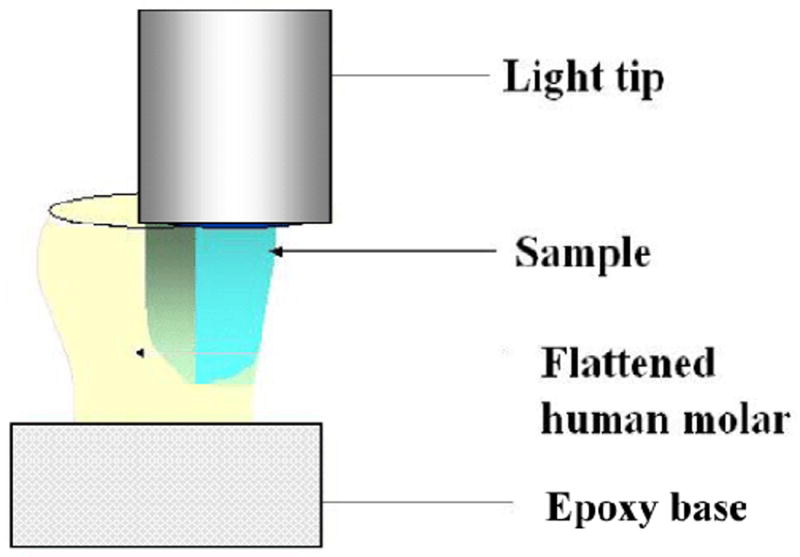
Schematic diagram of the experimental setup.
Knoop hardness and depth of cure determination
Knoop hardness testing was performed (Kentron Hardness Tester, Torsion Balance Co., Clifton NJ) 1 mm below the occlusal surface, and at 1 mm increments up to 5 mm below the irradiated surface or until the material was too soft to test. Testing was performed under 100 g load and a 15 sec dwell time using a 136° diamond pyramid indenter. Six indentations (2 in the axial, 2 in the middle and 2 in the buccal third of the sample) were made at each corresponding depth. Depth of cure was (DoC) defined as the depth at which KHN was equivalent to 80% of the maximum hardness measured.
Degree of conversion testing
The same specimens tested for Knoop hardness were evaluated for degree of conversion (DC). Thin chips (10 - 15 μm) of the cured resin composite were obtained at 2mm below the occlusal surface, placed on a KCl crystal and scanned in transmission using micro-FTIR (DS-20/XAD, Analect Instruments, Irvine, CA, USA) at an 8 cm-1 resolution. The pastes of the uncured composites were similarly tested. DC was calculated from the ratio of the C=C peak from the methacrylate group to that of the unchanging C…C peak from the aromatic ring, for the cured and uncured specimens, using standard baseline techniques [19]
Contraction stress testing
The contraction stress test used in this study has previously been described [20]. Uncured resin composite, 0.83 mm thick (was applied between sandblasted and silane-treated glass stubs, 5 mm in diameter mounted in a tensilometer (C-factor = 3, i.e., the ratio of bonded to non-bonded surface area). Photoactivation of resin composite was done by irradiation through the top glass rod at the irradiance of 380 mW/cm-2 (measured at the top surface of the sample) for 60 s, using a dental curing light (VIP, Bisco Inc.). The thickness of the resin composite sandwiched between two glass rods was maintained and monitored by a feedback system equipped with a capacitance probe (Kaman Instruments), with an accuracy of ± 0.25 μm. Contraction force was monitored for 10 min, and data were acquired at a rate of 0.5 sec-1. Maximum stress was derived by dividing the maximum contraction force by the area of the glass stub.
Results
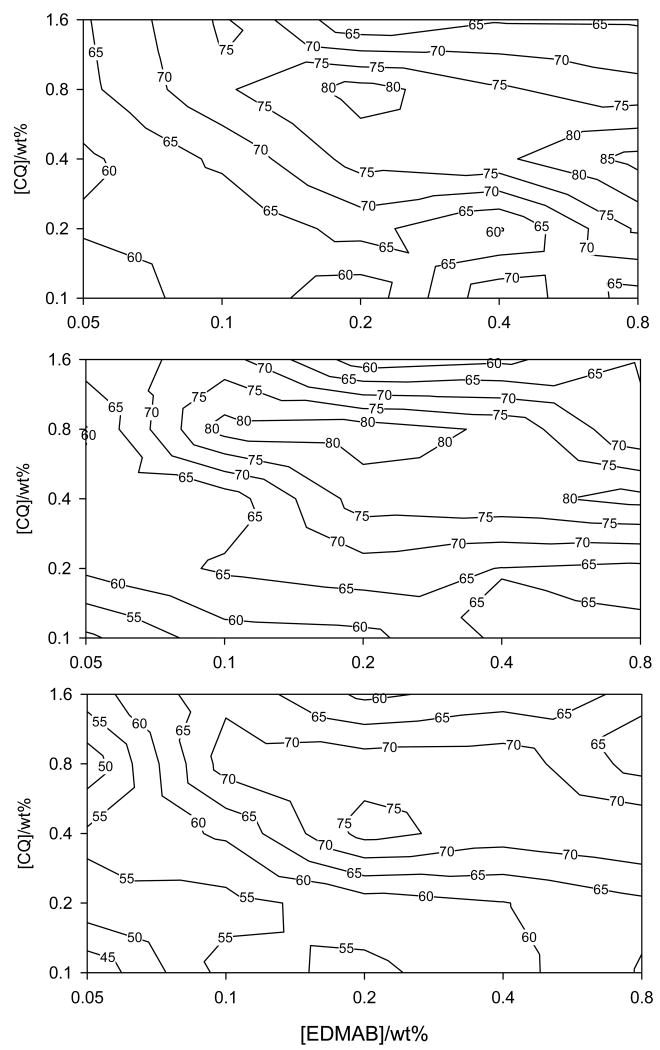
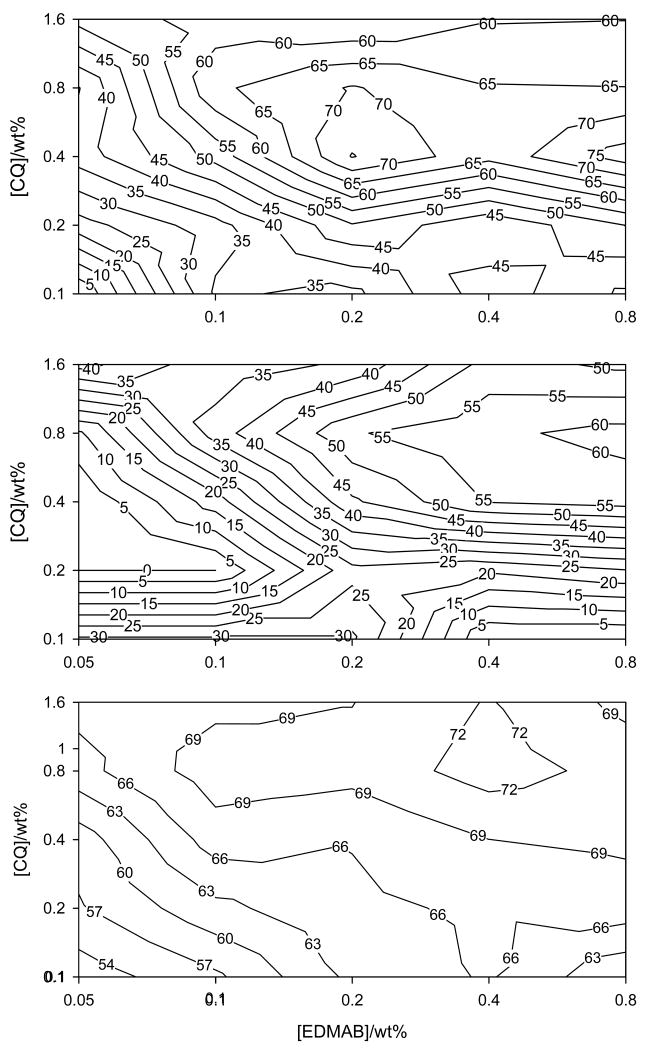
The variations in KHN at 1 to 5 mm, and in DC at 2 mm below the occlusal (irradiated) surface, as well as changes in contraction stress (CS) as a function of CQ and amine accelerator (EDMAB) concentration in the experimental resin composite are shown as contour maps for each property (Figs. 2, 3 and 4). All contour maps for KHN at 1, 2, 3, 4 and 5 mm and that for DC at 2 mm below the irradiated surface show a local maximum indicating the optimum CQ and amine concentration required to attain maximum KHN or DC at the given depth (Figs. 2 and 3). There is a slight difference in the contour maps for KHN at 1, 2, 3 and 4 from that at 5 mm depth. Contour maps for KHN at 1, 2, and 4 mm show two regions of maxima, one near the center (at a lower amine concentration) and the other towards the right border of the contour map (at a higher amine concentration). Only one (the latter) region of maximum KHN is visible on the contour map for KHN at 5 mm depth (Fig. 3- middle contour map). The contour map for KHN at 3mm depth only shows a centrally located maximum, which closely corresponds to the KHN maxima observed at the low amine concentration for the contour maps of KHN at 1, 2 and 4 mm. It is noteworthy that the hardness values in the region corresponding to second maxima identified at all other depths are within 93% of the maximum KNH (Fig. 2- bottom contour map).
Fig. 2.
Contour plots on log-log scale for Knoop hardness at 1 mm (top), 2 mm (middle) and 3 mm (bottom) below the occlusal surface as a function of CQ and EDMAB concentration.
Fig. 3.
Contour plots on log-log scale for Knoop hardness at 4 mm (top), 5 mm (middle) and degree of conversion at 2 mm (bottom) as a function of CQ and EDMAB concentration.
Fig. 4.
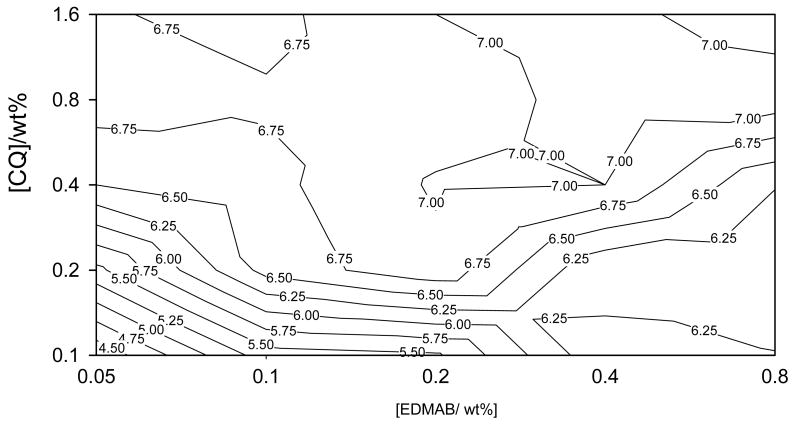
Contour plots on log-log scale for contraction stress as a function of CQ and EDMAB.
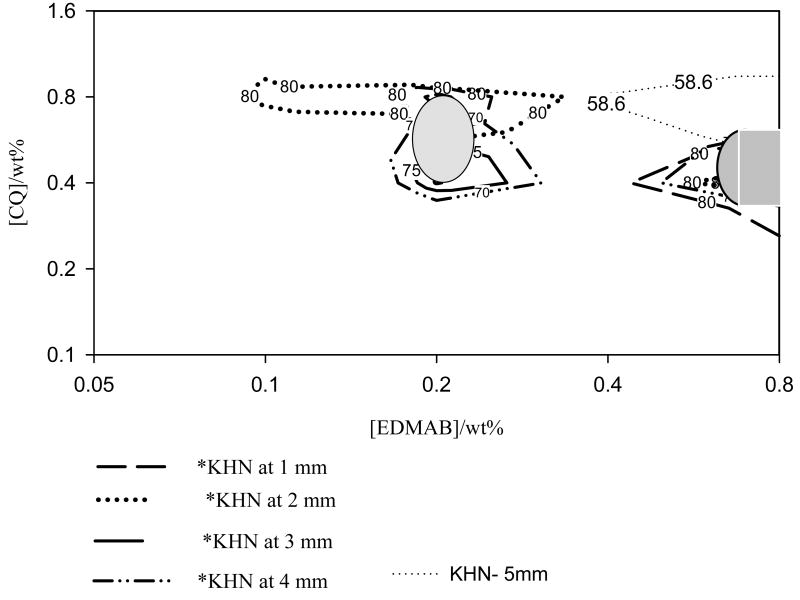
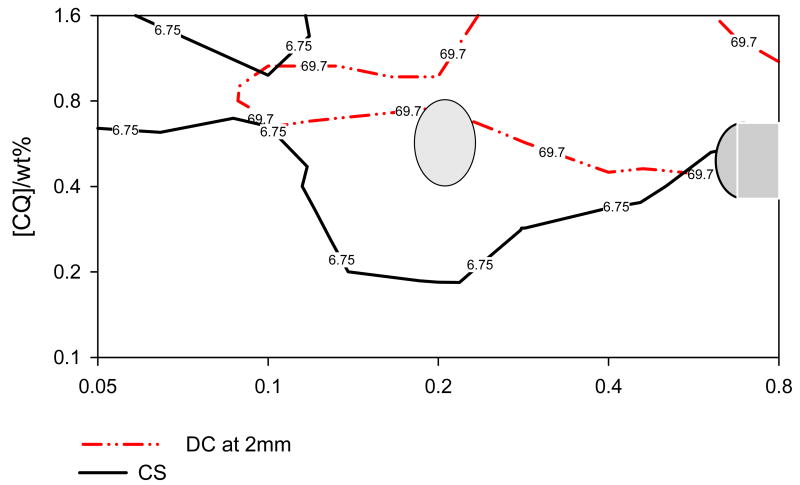
Taking into consideration the measurement error it is reasonable to assume that a region of KHN values equal or greater than 95% of the maximum hardness measured is representative of maximum KHN. Therefore, regions of KHN measured at 1, 2, 3, 4 and 5 mm below the irradiated surface, with hardness values ≥ 95% of the maximum KHN detected at the corresponding depth were mapped out and are shown in Fig. 5a. The maps, precisely drawn to the same scale, were superimposed so as to identify a common area of intersection, representating a universal region of CQ and EDMAB concentrations that resulted in maximum Knoop hardness or nearly so (≥95% of the maximum KHN) at 1 – 5 mm depth (Fig. 5a). While it is apparent that these areas of maximum hardness at 1 to 5 mm, cannot be directly superimposed (i.e., they do not precisely occur at the same spot) they do tend to cluster within the same region (Fig. 5a). Thus an oval gray area (Fig. 5b) with a concentration range of 0.4 – 0.8 wt% (0.97 - 1.91mol%) CQ and 0.18 – 0.22wt% (0.37 – 0.46mol%) amine was mapped out, to represent a reasonable estimate of a universal region of CQ and EDMAB concentration that resulted in maximum KHN at 1 – 4 mm depth, at the low amine concentration. Taking the mid-point of this region to be the best overlap, then the CQ to amine ratio that resulted in maximum KHN at the low amine concentration was 0.6: 0.2wt% (1.44: 0.42 mol%).
Fig. 5.
Fig. 5(a). Interposed contour plots of *KHN at 1 - 5 mm below the occlusal surface. The gray shaded areas indicating universal CQ and EDMAB concentrations that resulted in maximum KHN. *Values ≥95% of the maximum KHN measured at a given depth.
Fig. 5(b). Interposed contour plots of *CS (MPa) and *DC (%) at 2mm below the occlusal surface showing areas of CQ and EDMAB concentration that resulted in maximum hardness. *Values ≥95% of the maximum CS or DC.
A universal area of CQ and amine concentration that resulted in the second maxima, at a higher amine concentration, was also mapped out. This is shown by the gray semi-circle area, with a concentration ranging from 0.36 – 0.60 wt% (0.86 - 1.06mol%) CQ, and 0.6 - 0.8wt% (1.24 – 1.65 mol%) EDMAB. Again, taking the middle point to be the best overlap, the CQ to amine ratio in this case was 0.44: 0.8wt% (1.05: 1.65 mol%). It is noteworthy that the ‘optimal’ CQ and amine concentrations identified at the second region of maxima are applicable to all depths (1 – 5mm) as far as achieving nearly maximum KHN (>93% of maximum KHN) is concerned. This was not the case for the first maximum, observed at the low amine concentration, as maximum KHN values at 5mm below the irradiated surface could not be achieved at the corresponding CQ and amine concentrations. Depth of cure (DoC) was 4mm.
Regarding DC at 2 mm, one distinct area of maximum conversion was identified which was located in a region roughly identical to that identified as the first maxima (at the low amine concentration) on KHN contour plots at 1 – 4 mm depths (Fig. 3- bottom plot). Considering the mid-point of this region to be the best overlap, it was revealed that a slightly higher concentration of CQ and EDMAB (1.0: 0.4wt% ≅ 2.40: 0.83mol%) was required to cause maximum DC than that observed for KHN (at the low amine concentration, i.e., 1.44: 0.42 mol%). Similarly, a region of DC values ≥ 95% of the maximum conversion measured at 2 mm depth was mapped out (Fig 5b bottom plot). This region in comparison to those of KHN (at 1, 2, 3 &4 mm) covers a much wider range of CQ and EDMAB concentrations that resulted in maximum conversion or nearly so (≥ 95% of the maximum DC). It is almost equivalent to merging the two areas of KHN maxima identified in contour plots for KHN at 1, 2 and 4 mm into one large region. Thus it is reasonable to say that the CQ and amine concentrations that result into optimal KHN at 1 – 5 mm would also enable optimal degree of conversion at 2 mm.
The contour plot for CS shows one relatively large area of maximum stress values (Fig. 4). The region of CQ and EDMAB concentrations that resulted in ≥ 95% of maximum CS is far wider than those areas of maxima identified for DC and KHN and basically encompasses them (Fig. 5b).
After merging all the data for DC, CS and KHN on one contour plot, it is quite evident that maximum CS was almost always attained before the system reached the maximum possible conversion and hardness (Fig. 5b). However, it must be pointed out that the irradiance used in the CS tests (~380 mW/cm2) was lower than that for the KHN and DC tests (~575 mW/cm2). This might have significantly impacted the kinetics of polymerization for the DC and CS tests, and therefore making it more difficult to directly compare the results from the two tests
Discussion
Ideally, the concentration of photoinitiating molecules (i.e., photosensitizer and amine accelerator) in light-cured resin-based systems should be limited to that necessary to cause maximum monomer conversion. However, previous studies have shown significant variations in the concentration of photoinitiating molecules (CQ) in dental composites [21,22]. Taira et al., [21] found CQ concentrations to range from 0.17 to 1.03wt% of the resin, and Shintani et al., [22] reported a range of 0.03 to 0.09wt% of the dental composite. While these variations in CQ concentration may be attributed to variations in the concentration and type of the amine accelerators used in these systems or to differences in irradiation conditions recommended for a given system, they are also indicative of non-standardized initiator concentration in dental composites.
Determination of the optimal (minimal) concentration of CQ and EDMAB that causes maximum monomer conversion is key to reducing the concentration of residual photoinitiator and amine molecules and minimizing their subsequent potential to leach out into the surrounding tissues and saliva in the case of dental restorative materials. This is a concern because photoinitiating systems are increasingly being used in the field of tissue engineering where the materials are in intimate contact with highly vascularized tissues [23 – 25]. There has been recent confirmation of the possibility of CQ exposure from resin-based materials [26], evidence of potential cytotoxicity of leached CQ molecules [27, 28]. This underscores the need for cautious formulation of materials with the intention to eliminate or, at least, significantly minimize CQ exposure to biological tissues. The current study has shown that, in regard to the resin formulation and photoinitiator/amine system studied, there is an optimal photoinitiator (CQ) and amine (EDMAB) concentration that results in maximum conversion and hardness of the material (Figs. 2-3). It is therefore increasingly apparent that optimal photoinitiator/amine concentrations that result in maximal conversion of a given monomer system can be identified. This enhances the potential for improved biocompatibility of the corresponding material as incorporation of excessive amounts of the photoinitiator/amine may be avoided.
The observed increase in degree of conversion (DC) and Knoop hardness (KHN) values with increasing CQ concentration, at a constant amine concentration is consistent with previous studies [2, 3] (Figs. 2-3). This increase may be attributed to the increase in CQ molecules available for excitation, resulting in an increase in concentration of the exciplex that on disintegration generates more free radicals for increased monomer to polymer conversion. The failure to attain maximum DC and KHN values at very low amine concentrations, regardless of the CQ concentration, was attributed to the amine concentration being insufficient to generate adequate exciplex concentration, and thus a lower free radical concentration than was necessary to cause maximum conversion. On the other hand, the increase in DC and KHN values with increasing EDMAB at a lower than optimal CQ concentration may be attributed to the increase in the amine available for the formation of the exciplex complex.
Yoshida and Greener [2] studying the effect of CQ and 2-(N,N-dimethyl-amino)ethyl methacrylate (DMAEMA) on DC showed that there were several combinations of CQ and amine (DMAEMA) that would produce maximum DC. Principally, this is in agreement with our findings that also show that there were several combinations of CQ and amine (EDMAB) that resulted in optimal conversion and Knoop hardness (Fig. 5). Precise agreement in terms of number of mole of CQ to amine necessary to cause maximum DC would not be expected given the differences in resin formulations and type of amine accelerators used in the two studies. While Yoshida and Greener's [2, 3] study suggested a plateau in DC after optimal CQ and amine concentrations were attained, our study shows a tendency for a decline in DC or KHN beyond a certain point above the optimal CQ- amine concentrations (Figs. 2-3). This is critical to materials design as incorporation of more than the optimal concentration of the photoinitiator and amine concentration in the material may not only jeopardize chances of achieving maximal conversion but also increase the concentration of residual photoinitiator and amine molecules, further compromising the biocompatibility of the material.
The reduction in properties, more evident in KHN than in DC, when CQ concentration was increased beyond the optimum value may be attributed to yellowing of the material due to the high CQ concentration that might have impeded light penetration. This absorption of light in the effective wavelength by CQ molecules in the superficial regions filter the light being transmitted to deeper layers [1] and may effectively lower the properties of the material. It is also probable that this reduction in KHN and DC was due to the decrease in effective concentration of free radicals as a result of self-annihilation of initiator radicals. Self-annihilation, the reaction between initiator radicals, is expected to increase with the increase in photoinititor concentration in the system due to a higher statistical probability of initiator radical collision. This implies that a certain percentage of the total free radicals generated are trapped at their site of production by undergoing self-annihilation instead of contributing to the polymerization process. In other words, a high CQ and amine concentration may result in the generation of very high concentration of free radicals, of which only a fraction may participate in the polymerization reaction.
The observation of two regions of optimal CQ/EDMAB concentrations that resulted in maximum KHN, one at a low and the other at a high amine (EDMAB) concentration, was unexpected. The best overlaps (mid-point) of the two regions identified at CQ: EDMAB of 1.44: 0.42mol% and 1.05: 1.65mol% at the low and high amine concentrations, respectively showed rather significant variations. The fact that only the CQ/EDMAB concentrations at a high amine concentration (i.e., CQ: EDMAB ratio1.05: 1.65mol%) resulted in maximum hardness at 5 mm implies that that may be a more preferable concentration for this particular resin formulation. This would particularly be relevant to resin-based dental materials where achieving maximal cure depth is critical. Another important consideration would be the relative toxicity of CQ in comparison to EDMAB, and the specific application of the material. If EDMAB toxicity is more of a concern than that of CQ, and yet the photoinitiator system is to be used for a resin system applied in thin layers, then choice of CQ: EDMAB of 1.44: 0.42mol%, identified at a low amine concentration would be justified. The DoC of this experimental composite was 4mm, in which case this particular CQ: EDMAB ratio may as well be applicable.
In regard to dental composites, it is also essential to evaluate the impact of the concentration of CQ and EDMAB on the magnitude of contraction stresses (CS) generated within the material, due to the close association of CS with marginal leakage and its relevancy to the clinical success of the material [13,29,30]. It is important to note that sample configuration as well as the irradiance used in evaluating the effects of CQ and EDMAB concentration on CS was different from that for DC and KHN. Our interest was to monitor the trend in CS changes as a function of CQ and EDMAB concentration and to examine its correlation with DC and KHN. As would be expected and evidenced by the results, the magnitude of CS increased with DC (Figs. 3 and 4). This is indicative of more complete monomer to polymer conversion, and in agreement with a recent study that also showed that increasing the initiator (benzoyl peroxide) and amine concentration increased the final shrinkage-strain values [31].
Overall, the variations in DC, CS and KHN as a function of CQ and EDMAB concentration followed roughly a similar trend (Figs. 2-4). A close examination of the data reveals that, i) CS cannot be reduced by lowering the CQ and EDMAB concentration below the optimal levels, determined at the low amine concentration, without compromising DC and KHN, and ii) even at the high amine concentration that resulted in the second KHN maximum, it also seems very unlikely that CQ and EDMAB concentration can be lowered as to reduce CS without compromising DC and KHN. Apparently, these findings do not support the hypothesis that CQ and EDMAB concentrations may be lowered below the optimum levels as to reduce the contraction stress generated within the material without significantly affecting its degree of conversion and Knoop hardness.
Conclusions
There are several combinations of CQ and EDMAB concentrations that produced optimal polymerization of the studied experimental resin composite. Maximum hardness could be produced at a CQ: EDMAB ratio of either 1.44: 0.42mol% or 1.05: 1.65mol%. DC was optimized at a CQ: EDMAB ratio of 2.40: 0.83mol% quite similar to that identified at the first maximum for the KHN tests, in terms of molar ratios. While optimal photoinitiator and amine concentrations that cause maximal conversion of a given resin system can be identified, the absolute values may vary depending on the material property studied. Nevertheless, it is necessary to conduct systematic studies to identify the optimal photoinitiator and amine concentrations, as usage of concentrations beyond the optimal level not only compromise the materials properties but also may impact its overall biocompatibility due to a higher concentration of residual initiator/amine molecules.
Contraction stress and DC tracked very closely, but it is unlikely that CQ and EDMAB concentrations could be adjusted as to lower CS without significantly impacting conversion and Knoop hardness of the material.
Acknowledgments
This study was supported in part by NIH/NIDCR grant DE07079. We would like to thank Adam Eggie and Lucas Ferracane for helping with the preparation of experimental materials, and Dr. Jeffrey W. Stansbury for reading the manuscript and offering his professional opinion.
Footnotes
Publisher's Disclaimer: This is a PDF file of an unedited manuscript that has been accepted for publication. As a service to our customers we are providing this early version of the manuscript. The manuscript will undergo copyediting, typesetting, and review of the resulting proof before it is published in its final citable form. Please note that during the production process errors may be discovered which could affect the content, and all legal disclaimers that apply to the journal pertain.
References
- 1.Stansbury JW. Curing dental resins and composites by photopolymerization. J Esthet Dent. 2000;12(6):300–8. doi: 10.1111/j.1708-8240.2000.tb00239.x. [DOI] [PubMed] [Google Scholar]
- 2.Yoshida K, Greener EH. Effect of photoinitiation on degree of conversion of unfilled light-cured resin. J Dent. 1994;22:296–299. doi: 10.1016/0300-5712(94)90064-7. [DOI] [PubMed] [Google Scholar]
- 3.Yoshida K, Greener EH. Effects of two amine reducing agents on the degree of conversion and physical properties of an unfilled light-cured resin. Dent Mater. 1993;9(4):246–51. doi: 10.1016/0109-5641(93)90069-3. [DOI] [PubMed] [Google Scholar]
- 4.Wataha JC, Hanks CT, Strawn SE, Fat JC. Cytotoxicity of components of resins and other dental restorative materials. J Oral Rehabil. 1994;21(4):453–62. doi: 10.1111/j.1365-2842.1994.tb01159.x. [DOI] [PubMed] [Google Scholar]
- 5.Spahl W, Budzikiewicz H, Geurtsen W. Determination of leachable components from four commercial dental composites by gas and liquid chromatography/mass spectrometry. J Dent. 1998;26(2):137–45. doi: 10.1016/s0300-5712(96)00086-3. [DOI] [PubMed] [Google Scholar]
- 6.Geurtsen W, Lehmann F, Spahl W, Leyhausen G. Cytotoxicity of 35 dental resin composite monomers/additives in permanent 3T3 and three human primary fibroblast cultures. J Biomed Mater Res. 1998;41(3):474–80. doi: 10.1002/(sici)1097-4636(19980905)41:3<474::aid-jbm18>3.0.co;2-i. [DOI] [PubMed] [Google Scholar]
- 7.Moin JC, Nomura Y, Urabe H, Okazaki H, Shintani H. The relationship between leachability of polymerization initiator and degree of conversion of visible light-cured resin. J Biomed Mater Res. 58(1):42–6. doi: 10.1002/1097-4636(2001)58:1<42::aid-jbm60>3.0.co;2-#. [DOI] [PubMed] [Google Scholar]
- 8.Asmussen E. Factors affecting the color stability of restorative resins. Acta Odontol Scand. 1983;41(1):11–8. doi: 10.3109/00016358309162298. [DOI] [PubMed] [Google Scholar]
- 9.Ferracane JL, Greener EH. The effect of resin formulation on the degree of conversion and mechanical properties of dental restorative resins. J Biomed Mater Res. 1986;20(1):121–31. doi: 10.1002/jbm.820200111. [DOI] [PubMed] [Google Scholar]
- 10.Ferracane JL, Mitchem JC, Condon JR, Todd R. Wear and marginal breakdown of composites with various degrees of cure. J Dent Res. 1997;76(8):1508–16. doi: 10.1177/00220345970760081401. [DOI] [PubMed] [Google Scholar]
- 11.Peutzfeldt A, Asmussen E. The effect of postcuring on quantity of remaining double bonds, mechanical properties and in vitro wear of two resin composites. J Dent. 2000;28(6):447–52. doi: 10.1016/s0300-5712(00)00021-x. [DOI] [PubMed] [Google Scholar]
- 12.Ledwith A. Photoinitiation of photopolymerization. J Appl Chem. 1977;49:431–441. [Google Scholar]
- 13.Ferracane JL, Mitchem JC. Relationship between composite contraction stress and leakage in Class V cavities. Am J Dent. 2003;16:239–43. [PubMed] [Google Scholar]
- 14.Calheiros FC, Sadek FT, Braga RR, Cardoso PE. Polymerization contraction stress of low-shrinkage composites and its correlation with microleakage in class V restorations. J Dent. 2004 Jul;32:407–12. doi: 10.1016/j.jdent.2004.01.014. [DOI] [PubMed] [Google Scholar]
- 15.Kleverlaan CJ, Feilzer AJ. Polymerization shrinkage and contraction stress of dental resin composites. Dent Mater. 2005;21:1150–7. doi: 10.1016/j.dental.2005.02.004. [DOI] [PubMed] [Google Scholar]
- 16.Friedl KH, Hiller KA, Schmalz G. Placement and replacement of composite restorations in Germany. Oper Dent. 1995;20:34–38. [PubMed] [Google Scholar]
- 17.Wilson NH, Burke FJ, Mjor IA. Reasons for placement and replacement of restorations of direct restorative materials by a selected group of practitioners in the United Kingdom. Quintessence Int. 1997;28:245–248. [PubMed] [Google Scholar]
- 18.Ferracane JL. Correlation between hardness and degree of conversion during the setting reaction of unfilled dental restorative resins. Dent Mater. 1985 Feb;1(1):11–4. doi: 10.1016/S0109-5641(85)80058-0. [DOI] [PubMed] [Google Scholar]
- 19.Ferracane JL, Greener EH. Fourier transform infrared analysis of degree of polymerization in unfilled resins- methods comparison. J Dent Res. 1984;63(8):1093–5. doi: 10.1177/00220345840630081901. [DOI] [PubMed] [Google Scholar]
- 20.Condon JR, Ferracane JL. Assessing the effect of composite formulation on polymerization stress. J Am Dent Assoc. 2000 Apr;131(4):497–503. doi: 10.14219/jada.archive.2000.0207. [DOI] [PubMed] [Google Scholar]
- 21.Taira M, Urabe T, Hirose K, Yamaki M. Analysis of photoinitiators in visible-light cured dental composites. J Dent Res. 1988;67(1):24–28. doi: 10.1177/00220345880670010401. [DOI] [PubMed] [Google Scholar]
- 22.Shintani H, Inoue T, Yamaki M. Analysis of camphoroquinone in visible light-cured composite resin. Dent Mater. 1985;1:124–126. doi: 10.1016/s0109-5641(85)80002-6. [DOI] [PubMed] [Google Scholar]
- 23.Liu VA, Bhatia SN. Three-dimensional photopatterning of hydrogels containing living cells. Biomedical Microdevices. 2002;4(4):257–266. [Google Scholar]
- 24.Fisher JP, Dean D, Mikos AG. Photocrosslinking characteristics and mechanical properties of diethyl fumarate/poly(propylene fumarate) biomaterials. Biomaterials. 2002;23(22):4333–4343. doi: 10.1016/s0142-9612(02)00178-3. [DOI] [PubMed] [Google Scholar]
- 25.Almany L, Seliktar D. Biosynthetic hydrogel scaffolds made from fibrinogen and polyethylene glycol for 3D cell cultures. Biomaterials. 2005;26(15):2467–2477. doi: 10.1016/j.biomaterials.2004.06.047. [DOI] [PubMed] [Google Scholar]
- 26.Rogalewicz R, Voelkel A, Kownacki I. Application of HS-SPME in the determination of potentially toxic organic compounds emitted from resin-based dental materials. Journal of Environmental Monitoring. 2006;8(3):377–383. doi: 10.1039/b517363a. [DOI] [PubMed] [Google Scholar]
- 27.Noda M, Wataha JC, Lewis JB, Kaga M, Lockwood PE, Messer RLW, Sano H. Dental adhesive compounds alter glutathione levels but not glutathione redox balance in human THP-1 monocytic cells. J Biomed Mater Res Part B-Appl Biomater. 2005;73B(2):308–314. doi: 10.1002/jbm.b.30257. [DOI] [PubMed] [Google Scholar]
- 28.Thonemann B, Schmalz G, Hiller KA, Schweikl H. Responses of L929 mouse fibroblasts, primary and immortalized bovine dental papilla-derived cell lines to dental resin components. Dent Mater. 2002;18(4):318–323. doi: 10.1016/s0109-5641(01)00056-2. [DOI] [PubMed] [Google Scholar]
- 29.Venhoven BAM, de Gee AJ, Davidson CL. Light initiation of dental resins: Dynamics of the polymerization. Biomaterials. 1996;17(24):2313–2318. doi: 10.1016/s0142-9612(96)00074-9. [DOI] [PubMed] [Google Scholar]
- 30.Braga RR, Ballester RY, Ferracane JL. Factors involved in the development of polymerization shrinkage stress in resin-composites: A systematic review. Dent Mater. 2005;21(10):962–970. doi: 10.1016/j.dental.2005.04.018. [DOI] [PubMed] [Google Scholar]
- 31.Silikas N, Al-Kheraif A, Watts DC. Influence of P/L ratio and peroxide/amine concentrations on shrinkage-strain kinetics during setting of PMMA/MMA biomaterial formulations. Biomaterials. 2005;26(2):197–204. doi: 10.1016/j.biomaterials.2004.02.028. [DOI] [PubMed] [Google Scholar]


