

Abstract
We have recently reported the creation and initial characterization of an etiology-based recombinant mouse model of a severe and inherited form of Major Depressive Disorder (MDD). This was achieved by replacing the corresponding mouse DNA sequence witha6-base DNA sequence from the human CREB1promoterthat is associated with MDD in individuals from families with recurrent, early-onset MDD (RE-MDD). In the current study, we explored the effect of the pathogenic Creb1 allele on gene expression in the mouse hippocampus, a brain region that is altered in structure and function in MDD. Mouse whole-genome profiling was performed using the Illumina MouseWG-6 v2.0 Expression BeadChip microarray. Univariate analysis identified 269 differentially-expressed genes in the hippocampus of the mutant mouse. Pathway analyses highlighted 11 KEGG pathways: the phosphatidylinositol signaling system, which has been widely implicated in MDD, Bipolar Disorder, and the action of mood stabilizers; gap junction and long-term potentiation, which mediate cognition and memory functions often impaired in MDD; cardiac muscle contraction, insulin signaling pathway, and three neurodegenerative brain disorders (Alzheimer’s, Parkinson’s, and Huntington’s Diseases) that are associated with MDD; ribosome and proteasome pathways affecting protein synthesis/degradation; and the oxidative phosphorylation pathway that is key to energy production. These findings illustrate the merit of this congenic C57BL/6 recombinant mouse as a model of RE-MDD, and demonstrate its potential for highlighting molecular and cellular pathways that contribute to the biology of MDD. The results also inform our understanding of the mechanisms that underlie the comorbidity of MDD with other disorders.
Keywords: microarray, CREB1, comorbidity, proteinopathy, mitochondria
INTRODUCTION
Major depressive disorder (MDD) has an estimated lifetime prevalence of about 16.5% (F/M ratio ~2) and is a leading cause of suffering and disability worldwide [Kessler et al., 2005; Lopez et al., 2006]. It is also an important contributor to mortality from all causes, including suicide [Zubenko et al., 2001], and has been estimated to be among the costliest and most disabling of medical disorders from an economic perspective [Greenberg et al., 2003]. Unfortunately, our understanding of the underlying causes of this disorder remains rudimentary, and existing treatments are often only partially effective or ineffective and are commonly associated with poorly tolerated side effects. Twin and adoption studies indicate that genetic factors account for 40–70% of the risk of developing MDD [for review, see Zubenko et al., 2001]. The inherited determinants appear to be many, and may differ from case to case, but some of the relevant factors are becoming known, including rare sequence variants of the human CREB1 promoter that we have discovered in families with recurrent, early-onset MDD (RE-MDD)[Zubenko et al., 2002, 2003a,b; Zubenko and Hughes, 2008, 2009, 2010; Maher et al., 2010].
A better understanding of the cellular and molecular brain mechanisms that lead to the expression of MDD and the mechanism of action of existing antidepressants seems prerequisite to preventing or reducing the global burden of this major public health problem. Studies of MDD are constrained by numerous factors including the complexity of the brain and our limited understanding of normal brain functioning, the inaccessibility of the brain in living subjects, and the limitations inherent in postmortem studies. The development of a valid animal model for any form of MDD, a model that faithfully reflects one or more brain mechanisms that lead to MDD, could significantly accelerate the pace toward achieving these goals.
The laboratory mouse has many features that make it an attractive model organism for the study of human diseases, including their striking similarity to humans in anatomy, physiology, and genetics, and shared features of the brain in limbic structures thought to mediate mood and reward. We have recently reported the creation and initial characterization of the first etiology-based recombinant mouse model of MDD [Zubenko and Hughes, 2011, 2012; Zubenko et al., 2014]. This was achieved by replacing the homologous mouse DNA sequence with a 6-base DNA sequence from the human CREB1 promoter that is associated with the development of MDD in both men and women from families identified by probands with recurrent, early-onset MDD (RE-MDD). This congenic mutant C57BL/6NTac mouse line is based on a rare, highly penetrant, pathogenic mutation in the human CREB1 promoter [Zubenko and Hughes, 2010], rather than psychological hypotheses or stress paradigms, and it mimics the brain mechanism that leads to MDD in some humans, rather than symptoms or antidepressant responsiveness. In our initial characterization, the mutant mice exhibited several features that were reminiscent of the human disorder, including alterations of Creb1 expression, brain development, behavior, and increased infant mortality [Zubenko et al., 2001, 2014 Zubenko and Hughes, 2011, 2012].
In the current study, we explored mechanistic effects of the pathogenic Creb1 allele on gene expression in the mouse hippocampus, a brain region that is altered in MDD and likely plays an important role in the expression of pathological depression in humans [Sapolsky, 2001; MacQueen et al., 2003; Campbell and MacQueen, 2004; Li et al., 2014]. The hippocampus also plays a critical role in learning and memory, brain functions that are dependent on Creb1 across a wide range of animal species, including humans [Zubenko et al., 2001; Scott et al., 2002; Weeber and Sweatt, 2002; Lee et al., 2008; Barco and Marie, 2011], and it is notable that cognitive impairment is common among individuals with MDD across the lifespan [APA, 2013]. Mouse whole-genome profiling was performed using the Illumina MouseWG-6 v2.0 Expression BeadChip microarray, which probes more than 45,200 transcripts and offers the most up-to-date content for mouse whole-genome expression profiling currently available [Jan 20, 2014: http://www.illumina.com/products/mousewg_6_expression_beadchip_kits_v2.ilmn]. The mediators of abnormal function in mood disorder are expected to be complex, and pathway analysis to define disruptions in cell processes contributed to the biological interpretations of the findings.
MATERIALS AND METHODS
Mouse Breeding, Genotyping, and Brain Dissection
The construction and initial characterization of our congenic C57BL/6NTac mouse line carrying the 5′-TCCCCG-3′sequence at positions −170 to −165 of the recombinant Creb1 allele has been previously published [Zubenko and Hughes, 2011, 2012; Zubenko et al., 2014]. Mice used in this study were bred at The Jackson Laboratory (JAX; Bar Harbor, ME) and subjected to behavioral phenotyping at PsychoGenics Inc. (PGI; Tarrytown, NY), as previously described [Zubenko and Hughes, 2011]. Both facilities are AAALAC-accredited (Association for Assessment and Accreditation of Laboratory Animal Care International) and employ specific-pathogen-free vivaria. Mice were provided fresh food and water ad libitum. Genotyping of these animals for the recombinant Creb1 allele was performed at the University of Pittsburgh, using frozen tail biopsies as previously described [Zubenko and Hughes, 2011]. Brains from mutant mice and wild-type mice were removed immediately following euthanasia and decapitation at PGI, dissected on dry ice, and stored at −80 °C. Protocols involving mice were approved by Institutional Animal Care and Use Committees of JAX, PGI, and the University of Pittsburgh. Information on mouse genes was obtained from the Mouse Genome Informatics website, The Jackson Laboratory, Bar Harbor, Maine. World Wide Web (URL: http://www.informatics.jax.org) [Blake et al., 2014].
RNA Isolation and Microarray Analysis of Hippocampal Gene Expression
Hippocampal tissue was stored at −80°C prior to RNA extraction with TRIzol® Reagent (Life Technologies; Carlsbad, CA), according to the manufacturer’s protocol. The quality of the resulting RNA preparations was affirmed by A260/A280 nm wavelength ratios of 2.09–2.10. RNA integrity was verified with an Agilent 2100 Bioanalyzer (Agilent; Santa Clara, CA) that reported RNA integrity numbers of 7.8–8.9 for the six samples [Schroeder et al., 2006].
Mouse whole-genome profiling was performed using the Illumina BeadChip® platform (Illumina; San Diego, CA). According to the manufacturer, probes on the Illumina MouseWG-6 v2.0 Expression BeadChip were derived from the National Center for Biotechnology Information Reference Sequence (NCBI RefSeq) database (Build 36, release 22), supplemented with probes derived from the Mouse Exonic Evidence Based Oligonucleotide (MEEBO) set as well as exemplar protein-coding sequences described in the RIKEN FANTOM2 database. The MouseWG-6 v2.0 BeadChip contains the full set of the MouseRef-8 Expression BeadChip probes with an additional 11,603 probes from the above databases. Hybridization of hippocampal RNA to the MouseWG-6 v2.0 Expression BeadChip was performed in duplicate using the Direct Hybridization Assay according to the manufacturer’s protocols. The resulting BeadChips were scanned and individual hybridization signals were quantified using an Illumina BeadArray Reader. These procedures were performed by the Genomics and Proteomics Core Laboratories (GPCL) of the Health Sciences at the University of Pittsburgh.
Identifying Differentially Expressed Genes
The optimal criterion for demarcation of differential expression from the replicate data obtained using hippocampal RNA samples from three 24-week-old female, homozygous mutant mice and three age/sex-matched, wild-type mice was identified using Efficiency Analysis [Jordan et al., 2008]. This objective approach allows the empirical study of the reproducibility of competing methods for the inference of differential expression via efficiency curves, which relate two measures: internal consistency and the threshold of significance. Well-applied methods have high internal consistency at reasonable, stringent levels of significance.
Efficiency analysis was implemented in caGEDA [Patel and Lyons-Weiler, 2004; http://helen.genetics.pitt.edu:8080/GE2/GEDA.html]. In total, 252 combinations of transformation, normalization and tests were evaluated for internal consistency over the complete range of thresholds for each criterion. The method combinations were evaluated at the replicate level (across arrays). Gene-level expression was determined by the replicates, and group-wise expression values were determined by averaging across replicates after normalization. The optimal threshold of expression was identified as described by Jordan et al. [2008].
Pathway Analysis
A list of accession numbers of the differentially expressed genes and their accompanying J5 scores were input into Pathway Express [Khatri et al., 2007; Draghici et al., 2007]. Pathway Express utilizes the KEGG Pathway database [Kanehisa and Goto, 2000; Kanehisa et al., 2014] and applies a hypergeometric test to identify pathways (functionally related gene sets) enriched in the list of differentially expressed genes. P-values were corrected for multiple comparisons and pathways exhibiting corrected P-values of less than 0.05 were considered significant. The identification of differentially-expressed genes and subsequent pathway analysis were performed by the Bioinformatics Analysis Core of the GPCL at the University of Pittsburgh.
Further, pathway analysis was conducted to test the hypothesis that specific pathways might be effected in a manner in which only a few of the genes exhibit high expression differences between groups in the univariate mutant vs. wild-type comparison (pathway significance test, PST). For each pathway p of interest, a statistic,(Σ|Δi|p) was calculated as the sum of the absolute value of the differences in normalized gene express for all i = 1 to g genes in the pathway. Then, 100,000 pseudopathways of size g were sampled, at random, from all the genes on the array, and (Σ|Δi|null) calculated for each pseudopathway. The pathway was considered to have a significant overall difference if, in the 100,000 draws, the proportion of draws with (Σ|Δi|null) ≥ (Σ|Δi|p) was greater than 5%. To avoid the possibility of circular inference, genes in pathways of interest that were also found to be differentially expressed by J5 were excluded.
RESULTS
Whole genome expression profiling was performed using high-quality RNA extracted from flash-frozen hippocampal tissue from three 24-week-old female, homozygous mutant mice and three age/sex-matched, wild-type mice. Adult mice of this age are old enough to have fully-developed brains and young enough that senescent changes would not yet have occurred. Mice of the same sex were used to avoid sex effects, and female mice where chosen because MDD (including RE-MDD) is more common in women than men. Hybridization of hippocampal RNA to the MouseWG-6 v2.0 Expression BeadChip was performed in duplicate, the resulting 12 microarrays were scanned, and individual hybridization signals were quantified using an Illumina BeadArray Reader.
Differentially-Expressed Hippocampal Genes in the Mutant Mouse
Efficiency Analysis indicated that the J5 Test [Patel and Lyonsweiler, 2004] with Quantile 95 normalization (threshold = 15.0) and no data transformation produced the highest amount of internal consistency, and thus was used for subsequent feature selection. A J5 test threshold of 15.0 resulted in the retention of 269 genes, and produced the following quality measurements: between-mean array correlation (after normalization) = 0.997; between array coefficient of variation (after normalization) = 0.03; confounding index (after normalization) = 1.0. A list of these 269 differentially-expressed genes is presented as supplementary online material (Table 1S) in descending magnitude of their J5 scores. Four of the differentially-expressed genes were probed twice, and the hybridization results exceeded the J5 threshold for significance independently in all eight cases. These findings support the reliability of our method for detecting differentially-expressed genes.
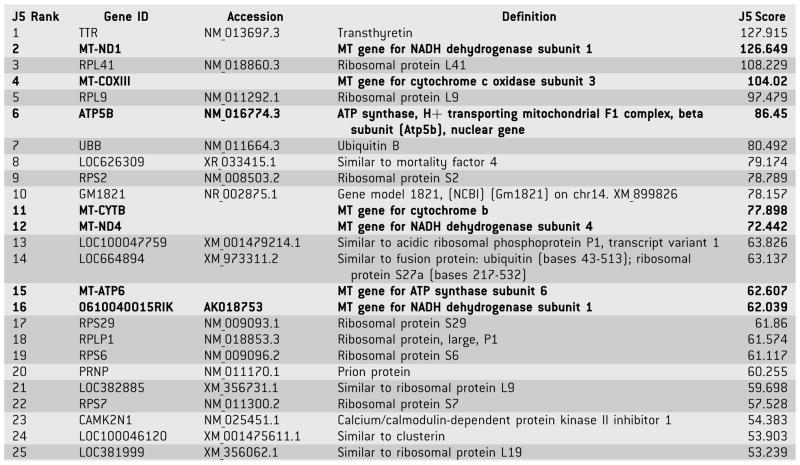
The top 25 differentially-expressed hippocampal genes from Table 1S are presented in Table I (note: MT-ND1 and 0610040O15RIK encode the same protein). All 25 genes exhibited greater expression in the hippocampi of the homozygous mutant mice compared to the brains of age/sex-matched, congenic, wild-type mice, as reflected by positive J5 scores. At least eight of these genes encode products involved in protein synthesis (7 ribosomal protein genes and 4 genes predicted to be similar to ribosomal protein genes) or protein degradation (UBB, which encodes ubiquitin, a highly conserved protein that targets proteins for degradation by the 26S proteasome). Six unique genes encode mitochondrial proteins (5 mitochondrial genome-encoded, one nuclear-encoded) required for mitochondrial function. In summary, over half of the top 25 differentially-expressed (unique) genes in Table I encode proteins that are involved in protein synthesis/degradation or mitochondrial function. The three remaining genes in Table I whose products have been identified include TTR, which exhibited the greatest differential expression and encodes the mouse gene for transthyretin, a carrier protein for thyroid hormone and retinol in serum and cerebrospinal fluid, and whose homolog has been associated with amyloid diseases in humans; PRNP, which encodes a mouse prion protein; and CAMK2N1, which encodes calcium/calmodulin-dependent protein kinase II inhibitor 1.
TABLE I.
Top 25 Differentially-Expressed Genes
|
Gene IDs beginning with MT identify mitochondrial genes that encode mitochondrial proteins. 0610040O15RIK is identical to MT-ND1. ATP5B is a nuclear gene that encodes a mitochondrial protein.
Mitochondrial genes are in bold.
Ribosomal genes and UBB are highlighted in gray.
Inspection of the remainder of the 269 differentially-expressed genes revealed an additional 11 ribosomal protein genes (along with 14 genes predicted to be similar to ribosomal protein genes), and 16 additional mitochondrial genes (1 mitochondrial genome-encoded, 15 nuclear-encoded). In total, 6 of the 13 protein genes encoded in the mouse mitochondrial genome were over-expressed in the hippocampi of the mutant mice. Not surprisingly, Creb1 was not identified as a differentially-expressed gene in this comparison, since the Creb1 promoter mutation resulted in only a 44% reduction in CREB protein in the cerebral cortex of homozygous mutant mice [Zubenko and Hughes, 2011].
Pathway Analysis
Pathway Express [Khatri et al., 2007; Draghici et al., 2007] was used to identify pathways from the KEGG Pathway database that were over-represented in the list of 269 differentially-expressed hippocampal genes (Table 1S) in the mutant mice. The KEGG Pathway database is a collection of pathway maps representing molecular interaction and reaction networks for metabolism, genetic information processing, environmental information processing, cellular processes, organismal systems, and human diseases [Kanehisa and Goto, 2000; Kanehisa et al., 2014]. Nine pathways from the KEGG pathway database were identified by this impact analysis, as reflected by P-values less than 0.05 after correction for multiple comparisons. These pathways are listed in Table II, in decreasing order of their impact factors. Table III indicates which of the 269 differentially-expressed genes participate in each of the 9 KEGG pathways identified by the impact analysis. The overlaps in the groups of differentially- expressed genes across the 9 functional pathways emphasize the inter-dependence of these pathways, which participate in the broader network of gene sets included in the KEGG Pathway database.
TABLE II.
KEGG Pathways Identified by Impact Analysis of 256 Differentially Expressed Genes
| Rank | Pathway Name | Impact Factor | Corrected P-value |
|---|---|---|---|
| 1 | Phosphatidylinositol signaling system | 22.879 | 2.59E–02 |
| 2 | Cardiac muscle contraction | 22.317 | 5.15E–10 |
| 3 | Gap junction | 7.374 | 1.46E–03 |
| 4 | Long-term potentiation | 7.268 | 1.93E–02 |
| 5 | Insulin signaling pathway | 6.614 | 5.74E–03 |
| 6 | Parkinson’s disease | 2.962 | 5.36E–13 |
| 7 | Ribosome | 1.69 | 1.16E–13 |
| 8 | Alzheimer’s disease | 1.21 | 1.50E–12 |
| 9 | Huntington’s disease | 1.056 | 9.24E–13 |
P values were corrected for multiple comparisons.
TABLE III.
Differentially-Expressed Genes that Participate in Identified KEGG Pathways
| Gene ID | Gene Product | Additional KEGG Pathways |
|---|---|---|
| Phosphatidylinositol Signaling System (PSS) | ||
| Calm2 | Calmodulin 2 | LTP. ISP. AD |
| Calm3 | Calmodulin 3 | LTP |
| Dgkg | Diacylglycerol kinase γ | |
| Cardiac Muscle Contraction (CMC) | ||
| 1110020P15 Rik | RIKEN cDNA | PD, AD, HD |
| Atp1b1 | ATPase, Na+/K+, β1 subunit | |
| Atp1b2 | ATPase, Na+/K+, β2 subunit | |
| Cox5b | Cytochrome c oxidase, subunit Vb | PD, AD, HD |
| Cox6a1 | Cytochrome c oxidase, subunit VIa, polypeptide1 | PD, AD, HD |
| Cox 6b1 | Cytochrome c oxidase, subunit VIb, polypeptide 1 | PD, AD, HD |
| Cox7a2l | Cytochrome c oxidase, subunit VIIa, polypeptide 2-like | PD, AD, HD |
| Uqcr | Ubiquinol-cytochrome c reductase subunit | PD, AD, HD |
| Uqcrc2 | Ubiquinol-cytochrome c reductase core protein 2 | PD, AD, HD |
| Uqcrh | Ubiquinol-cytochrome c reductase hinge protein | PD, AD, HD |
| Gap Junction (GJ) | ||
| Gja1 | Gap junction protein, α1 | |
| Tuba1a | Tubulin, α 1A | |
| Tuba1b | Tubulin, α 1B | |
| Tubb4 | Tubulin, β 4 | |
| Tubb5 | Tubulin, β 5 | |
| Long-Term Potentiation (LTP) | ||
| Calm2 | Calmodulin 2 | PSS |
| Calm3 | Calmodulin 3 | PSS, ISP, AD |
| Ppp1ca | Protein phosphatase 1, catalytic subunit, α isoform | ISP |
| Insulin Signaling Pathway (ISP) | ||
| Calm2 | Calmodulin 2 | PSS, LTP, AD |
| Calm3 | Calmodulin 3 | PSS, LTP, AD |
| Ppp1ca | Protein phosphatase 1, catalytic subunit, α isoform | LTP |
| Prkar1a | Protein kinase, cAMP dependent, type I, α | |
| Rps6 | Ribosomal protein S6 | R |
| Parkinson’s Disease (PD) | ||
| 1110020P15 Rik | RIKEN cDNA | CMC, AD, HD |
| Atp5b | ATP synthase, H+ transporting, MT F1 complex, β subunit | AD |
| Atp5g3 | ATP synthase, H+ transporting, MT F0 complex, subunit c, iso 3 | AD, HD |
| Cox7a2l | Cytochrome c oxidase, subunit VIIa, polypeptide 2-like | CMC, AD, HD |
| Ndufa10 | NADH dehydrogenase (ubiquinone), 1α, subcomplex 10 | AD, HD |
| Ndufa2 | NADH dehydrogenase (ubiquinone), 1α, subcomplex 2 | AD, HD |
| Ndufa3 | NADH dehydrogenase (ubiquinone), 1α, subcomplex 3 | AD, HD |
| Ndufa7 | NADH dehydrogenase (ubiquinone), 1α, subcomplex 7 | AD, HD |
| Ndufv1 | NADH dehydrogenase (ubiquinone) flavoprotein 1 | AD, HD |
| Snca | Synuclein, α | AD |
| Ubb | Ubiquitin B | |
| Uchl1 | Ubiquitin carboxyterminal hydrolase L1 | |
| Uqcr | Ubiquinol-cytochrome c reductase subunit | CMC, AD, HD |
| Uqcrc2 | Ubiquinol-cytochrome c reductase core protein 2 | CMC, AD, HD |
| Uqcrh | Ubiquinol-cytochrome c reductase hinge protein | CMC, AD, HD |
| Ribosomes (R) | ||
| Rpl10 | Ribosomal protein 10 | |
| Rpl10a | Ribosomal protein L10a | |
| Rpl24 | Ribosomal protein 24 | |
| Rpl27 | Ribosomal protein 27 | |
| Rpl41 | Ribosomal protein L41 | |
| Rpl9 | Ribosomal protein L9 | |
| Rplp1 | Ribosomal protein, large, P1 | |
| Rps12 | Ribosomal protein S12 | |
| Rps14 | Ribosomal protein S14 | |
| Rps16 | Ribosomal protein S16 | |
| Rps2 | Ribosomal protein S2 | |
| Rps6 | Ribosomal protein S6 | ISP |
| Rps21 | Ribosomal protein S21 | |
| Rps29 | Ribosomal protein S29 | |
| Rps4x | Ribosomal protein S4, X-linked | |
| Rps7 | Ribosomal protein S7 | |
| Rps9 | Ribosomal protein S9 | |
| Alzheimer’s Disease (AD) | ||
| Apbb1 | Amyloid β precursor protein-binding, family B, 1 | |
| Atp5b | ATP synthase, H+ transporting, MT F1 complex, β subunit | PD |
| Atp5g3 | ATP synthase, H+ transporting, MT F0 complex, subunit c, isoform 3 | PD, HD |
| Calm2 | Calmodulin 2 | PSS, LTP, ISP |
| Calm3 | Calmodulin 3 | PSS, LTP, ISP |
| Cox5b | Cytochrome c oxidase, subunit Vb | CMC, PD, HD |
| Cox6a1 | Cytochrome c oxidase, subunit VIa, polypeptide1 | CMC, PD, HD |
| Cox 6b1 | Cytochrome c oxidase, subunit VIb, polypeptide 1 | CMC, PD, HD |
| Cox7a2l | Cytochrome c oxidase, subunit VIIa, polypeptide 2-like | CMC, PD, HD |
| Ndufa10 | NADH dehydrogenase (ubiquinone), 1α, subcomplex 10 | PD, HD |
| Ndufa2 | NADH dehydrogenase (ubiquinone), 1α, subcomplex 2 | PD, HD |
| Ndufa3 | NADH dehydrogenase (ubiquinone), 1α, subcomplex 3 | PD, HD |
| Ndufa7 | NADH dehydrogenase (ubiquinone), 1α, subcomplex 7 | PD, HD |
| Ndufv1 | NADH dehydrogenase (ubiquinone) flavoprotein 1 | PD, HD |
| Snca | Synuclein, α | PD |
| Uqcr | Ubiquinol-cytochrome c reductase subunit | CMC, PD, HD |
| Uqcrc2 | Ubiquinol-cytochrome c reductase core protein 2 | CMC, PD, HD |
| Uqcrh | Ubiquinol-cytochrome c reductase hinge protein | CMC, PD, HD |
| Huntington’s Disease (HD) | ||
| 1110020P15Rik | RIKEN cDNA | CMC, PD, AD |
| Atp5g3 | ATP synthase, H+ transporting, MT F0 complex, subunit c, iso 3 | PD, AD |
| Cox5b | Cytochrome c oxidase, subunit Vb | CMC, PD, AD |
| Cox6a1 | Cytochrome c oxidase, subunit VIa, polypeptide1 | CMC, PD, AD |
| Cox 6b1 | Cytochrome c oxidase, subunit VIb, polypeptide 1 | CMC, PD, AD |
| Cox7a2l | Cytochrome c oxidase, subunit VIIa, polypeptide 2-like | CMC, PD, AD |
| Gpx1 | Glutathioneperoxidase 1 | |
| Ndufa10 | NADH dehydrogenase (ubiquinone), 1α, subcomplex 10 | PD, AD |
| Ndufa2 | NADH dehydrogenase (ubiquinone), 1α, subcomplex 2 | PD, AD |
| Ndufa3 | NADH dehydrogenase (ubiquinone), 1α, subcomplex 3 | PD, AD |
| Ndufa7 | NADH dehydrogenase (ubiquinone), 1α, subcomplex 7 | PD, AD |
| Ndufv1 | NADH dehydrogenase (ubiquinone) flavoprotein 1 | PD, AD |
| Uqcr | Ubiquinol-cytochrome c reductase subunit | CMC, PD, AD |
| Uqcrc2 | Ubiquinol-cytochrome c reductase core protein 2 | CMC, PD, AD |
| Uqcrh | Ubiquinol-cytochrome c reductase hinge protein | CMC, PD, AD |
Pathways are presented in decreasing order of impact factors, as in Table II. Phosphatidylinositol signaling system, PSS; Cardiac muscle contraction, CMC; Gap junction, GJ; Long-term potentiation, LTP; Insulin signaling pathway, ISP; Parkinson’s disease, PD; Alzheimer’s disease, AD; Huntington’s disease, HD.
As described in the previous section, our inspection of the list of 269 differentially-expressed genes highlighted protein metabolism (synthesis and degradation) and mitochondrial functions. Therefore, it was not surprising that the impact analysis detected the involvement of the ribosome pathway. However, the proteasome pathway only approached statistical significance (impact factor = 3.538, corrected P = 0.062), and the oxidative phosphorylation pathway did not approach statistical significance in the impact analysis. Further pathway analysis was conducted to test the hypothesis, that these two pathways might be affected in a manner in which many genes in the pathway exhibit small but consistent differences between groups in the mutant vs. wild-type comparison (pathway significance test, PST). To avoid the possibility of circular inference, genes in these two pathways that were among the 269 differentially-expressed genes listed in Table 1S were omitted from this analysis. The PST score for the proteasome pathway (a 43 gene set) was 0.086 (P = 5.4E–5), and the PST score for the oxidative phosphorylation pathway (a 90 gene set) was 0.0807 (P < 1.0E–5). Diagrams of the 11 KEGG pathways identified by impact analysis (n = 9) or the PST (n = 2) are presented as online supplementary material (Figs. 1S–11S).
DISCUSSION
We recently reported the creation and initial characterization of the first etiology-based recombinant mouse model of MDD [Zubenko and Hughes, 2011, 2012; Zubenko et al., 2014]. This was achieved by replacing the homologous mouse DNA sequence with a 6-base DNA sequence from the human CREB1 promoter that includes an A to G transition at position −115 [Zubenko and Hughes, 2010]. The human CREB1 promoter variant is associated with the development of MDD in both men and women from families identified by probands with recurrent, early-onset MDD (RE-MDD), a severe and familial form of MDD. In our initial characterization, the mutant mice exhibited several features that were reminiscent of the human disorder, including alterations of Creb1 expression, brain development, behavior, and increased infant mortality [Zubenko et al., 2001; Zubenko and Hughes, 2011; Zubenko et al., 2014].
Since, CREB has been estimated to control the expression of several thousand mammalian genes [Zhang et al., 2005; Pfenning et al., 2007], we considered the possibility that hippocampal gene expression might be so extensively disrupted by the Creb1 mutation that comparisons of transcriptomes of the mutant and wild type mice might not be interpretable or informative. On the contrary, we detected the differential expression of a manageable number of hippocampal genes (n = 269) in the mutant mouse that supported meaningful pathway analyses. Our findings support this congenic C57BL/6 recombinant mouse as a model of RE-MDD, and demonstrate its potential for highlighting molecular and cellular pathways that contribute to the biology of RE-MDD in the mammalian brain. The results also inform our understanding of the mechanisms that may underlie the comorbidity of MDD with heart disease, diabetes mellitus, and neurodegenerative disorders.
Alterations of the phosphatidylinositol signaling pathway in the brain and peripheral tissues of patients with bipolar disorder or MDD have been widely reported, and mood-stabilizing medications such a lithium and valproate appear to at least partially remediate these abnormalities [Berridge et al., 1982; Manji et al., 1995; Jope et al., 1996; Manji and Lenox, 1999; Tomita et al., 2013]. Of the nine KEGG pathways identified by Impact Analysis of the 269 differentially-expressed hippocampal genes (Table II), the phosphatidylinositol signaling pathway exhibited the highest impact factor. Consistent with the common features of cognitive and memory impairment in MDD, abnormalities of the gap junction and long-term potentiation pathways were also identified in the hippocampus of the mutant mouse. These findings illustrate the value of the recombinant mouse model of RE-MDD, and affirm the role of the hippocampus in the pathophysiology of this disorder.
MDD is associated with increased rates of heart disease [Glassman and Shapiro, 1998; U.S. Department of Health and Human Services, 2011b; Charlson et al., 2013], diabetes [Eaton et al., 1996; Anderson et al., 2001; U.S. Department of Health and Human Services, 2011a], and neuordegenerative diseases, including Alzheimer’s disease [Zubenko and Moossy, 1988; Zubenko et al., 2003; Zubenko, 2004; Jeste et al., 2006], Parkinson’s disease[Cummings, 1992; U.S. Department of Health and Human Services, 2011c], and Huntington’s disease [Folstein et al., 1983; Paulsen et al., 2005; Perlis et al., 2010]. Probands and family members of individuals with RE-MDD suffer from an elevated risk of AD-like dementia [Zubenko et al., 2001]. Similarly, young people with a family history of MDD affecting a parent, but no personal history of MDD, have been reported to manifest elevated risk profiles for cardiovascular disease and diabetes [Mannie et al., 2013]. These family studies suggest that the comorbidity of heart disease, diabetes, and AD, as well as other brain and systemic illnesses associated with MDD may be related in part to shared risk alleles, including those that reside in the CREB1 promoter, as proposed in a number of our previous publications. Consistent with this hypothesis, the KEGG pathways identified by Impact Analysis of the 269 differentially-expressed hippocampal genes (Table II) included the cardiac muscle contraction pathway, the insulin signaling pathway, and the pathways for all three of these neurodegenerative disorders. These expression profiling results further illustrate the merit of the recombinant mouse as a model of MDD, and suggest that continued studies of this model may advance our understanding of the concept of MDD “comorbidity” by suggesting elements of common pathophysiology and therapeutic advances that are beneficial to multiple clinical syndromes.
Our whole transcriptome-based expression study highlighted alterations of two particular metabolic/cellular pathways in the hippocampus of the mutant mouse model of MDD. Inspection of the top 25 differentially-expressed (overexpressed) hippocampal genes (Table I) revealed a conspicuous over-representation of genes involved in protein synthesis/degradation (ribosomal proteins and ubiquitin), as well as mitochondrial genes that participate in energy production (oxidative phosphorylation). Analysis of the 269 differentially-expressed hippocampal genes by Impact Analysis identified the KEGG ribosome pathway, while the KEGG proteasome and oxidative phosphorylation pathways reached statistical significance using the PST. The merits of pathway analysis using the KEGG Pathway database in translating the results of expression profiling to alterations in functional pathways and extending these findings to subcellular organelles are evident from these findings.
While MDD has not previously been linked to altered protein metabolism, the comorbid neurodegenerative disorders Alzheimer’s disease, Parkinson’s disease, and Huntington’s disease are all associated with alterations in protein metabolism [Zubenko, 1997]. Indeed, they all result in the formation of proteinaceous cellular or extracellular “bodies” whose presence is identifiable in histologic brain sections and, in the case of Alzheimer’s (senile plaques and neurofibrillary tangles) and Parkinson’s (Lewy bodies) diseases, have diagnostic significance. Our observations warrant a systematic survey of the brains of the mutant mice for evidence of proteinopathy, including the presence of unanticipated histopathologic lesions such as these. It should be noted that the mutant mouse was created by replacing the homologous mouse DNA sequence with a 6-base DNA sequence from the human CREB1 promoter, without any change in the coding sequence of the gene. As a result, the alteration of hippocampal protein metabolism in the mutant mouse did not result from the creation of a foreign protein, or from the non-physiological control of CREB expression by a promoter of convenience.
The brain utilizes about twenty times the energy budget of the rest of the human body by weight [Kety, 1950], so it is not surprising that the brain would be especially vulnerable to conditions that impair energy production. Several postmortem [Kato et al., 1997; Konradi et al., 2004; Munakata et al., 2005; Iwamoto et al., 2005; Sun et al., 2006], imaging [Keener and Phillips, 2007; Frey et al., 2007], genetic [Kato et al., 1997; Kato and Kato, 2000; Konradi et al., 2004; Munakata et al., 2004, 2005; Washizuka et al., 2005; Benes et al., 2006; Iwamoto et al., 2005; Sun et al., 2006; Naydenov et al., 2007], and cellular [Cataldo et al., 2010] studies suggest that mitochondrial dysfunction may play an important role in the pathophysiology of bipolar disorder, an illness usually associated with recurrent major depressive episodes [APA, 2013]. The alterations in the expression of mitochondrial genes and the KEGG oxidative phosphorylation pathway observed in the hippocampus of the mutant mouse suggest that mitochondrial dysfunction may also play an important role in the biology of MDD. Further exploration of this hypothesis is underway in both the recombinant mouse model and humans with MDD.
Supplementary Material
Acknowledgments
This work was supported by research grant MH47346 (GSZ, PI).
Footnotes
Additional supporting information may be found in the online version of this article at the publisher’s web-site.
References
- American Psychiatric Association. Diagnostic and Statistical Manual for Mental Disorders. 5. Arlington, VA: American Psychiatric Association; 2013. [Google Scholar]
- Anderson RJ, Freedland KE, Clouse RE, Lustman PJ. The prevalence of comorbid depression in adults with diabetes. Diabetes Care. 2001;24(6):1069–1078. doi: 10.2337/diacare.24.6.1069. [DOI] [PubMed] [Google Scholar]
- Barco A, Marie H. Genetic approaches to investigate the role of CREB in neuronal plasticity and memory. Mol Neurobiol. 2011;44(3):330–349. doi: 10.1007/s12035-011-8209-x. [DOI] [PubMed] [Google Scholar]
- Benes FM, Matzilevich D, Burke RE, Walsh J. The expression of proapoptosis genes is increased in bipolar disorder, but not in schizophrenia. Mol Psychiatry. 2006;11:241–251. doi: 10.1038/sj.mp.4001758. [DOI] [PubMed] [Google Scholar]
- Berridge MJ, Downes CP, Hanley MR. Lithium amplifies agonist-dependent phosphatidylinositol responses in brain and salivary glands. Biochem J. 1982;206:587–595. doi: 10.1042/bj2060587. [DOI] [PMC free article] [PubMed] [Google Scholar]
- Blake JA, Bult CJ, Eppig JT, Kadin JA, Richardson JE The Mouse Genome Database Group. The Mouse Genome Database: integration of and access to knowledge about the laboratory mouse. Nucleic Acids Res. 2014;42(D1):D810–D817. doi: 10.1093/nar/gkt1225. [DOI] [PMC free article] [PubMed] [Google Scholar]
- Campbell S, MacQueen G. The role of the hippocampus in the pathophysiology of major depression. J Psychiatry Neurosci. 2004;29(6):417–426. [PMC free article] [PubMed] [Google Scholar]
- Cataldo Am, Mcphie DL, Lange NT, Punzell S, Elmiligy S, Ye NZ, Froimowitz MP, Hassinger LC, Menesale EB, Sargent LW, Logan DJ, Carpenter AE, Cohen BM. Abnormalities in mitochondrial structure in cells from patients with bipolar disorder. Am J Pathol. 2010;177 (2):575–585. doi: 10.2353/ajpath.2010.081068. [DOI] [PMC free article] [PubMed] [Google Scholar]
- Charlson FJ, Moran AE, Freedman G, Norman RE, Stapelberg NJC, Baxter AJ, Vos T, Whiteford HA. The contribution of Major depression to the global burden of ischemic heart disease: a comparative risk assessment. BMC Medicine. 2013;11:250. doi: 10.1186/1741-7015-11-250. [DOI] [PMC free article] [PubMed] [Google Scholar]
- Draghici S, Khatri P, Tarca AL, Amin K, Done A, Voichita C, Georgescu C, Romero R. A systems biology approach for pathway level analysis. Genome Res. 2007;17(10):1537–1545. doi: 10.1101/gr.6202607. [DOI] [PMC free article] [PubMed] [Google Scholar]
- Eaton WW, Armenian H, Gallo J, Pratt L, Ford DE. Depression and the risk for onset of type II diabetes. Diabetes Care. 1996;19(10):1097–1102. doi: 10.2337/diacare.19.10.1097. [DOI] [PubMed] [Google Scholar]
- Folstein S, Abbott MH, Chase GA, Jensen BA, Folstein MF. The association of affective disorder with Huntington’s disease in a case series and in families. Psychol Med. 1983;13(3):537–542. doi: 10.1017/s0033291700047966. [DOI] [PubMed] [Google Scholar]
- Frey BN, Stanley JA, Nery FG, Monkul ES, Nicoletti MA, Chen HH, Hatch JP, Caetano SC, Ortiz O, Kapczinski F, Soares JC. Abnormal cellular energy and phospholipid metabolism in the left dorsolateral prefrontal cortex of medication-free individuals with bipolar disorder: an in vivo 1H MRS study. Bipolar Disord. 2007;9(Suppl 1):119–127. doi: 10.1111/j.1399-5618.2007.00454.x. [DOI] [PubMed] [Google Scholar]
- Glassman AH, Shapiro PA. Depression and coronary artery disease. Am J Psychiatry. 1998;155:4–11. doi: 10.1176/ajp.155.1.4. [DOI] [PubMed] [Google Scholar]
- Greenberg PE, Kessler RC, Birnbaum HG, Leong SA, Lowe SW, Berglund PA, Corey-Lisle PK. The economic burden of depression in the United States: How did it change between 1990 and 2000? J Clin Psychiatry. 2003;64:1465–1475. doi: 10.4088/jcp.v64n1211. [DOI] [PubMed] [Google Scholar]
- Iwamoto K, Bundo M, Kato T. Altered expression of mitochondria related genes in postmortem brains of patients with bipolar disorder or schizophrenia, as revealed by large-scale DNA microarray analysis. Hum Mol Genet. 2005;14:241–253. doi: 10.1093/hmg/ddi022. [DOI] [PubMed] [Google Scholar]
- Jeste DV, Meeks TW, Kim DS, Zubenko GS. Research agenda for DSM-V: Diagnostic categories and criteria for neuropsychiatric syndromes in dementia. J Geriatr Pyschiatry Neurol. 2006;19:160–171. doi: 10.1177/0891988706291087. [DOI] [PubMed] [Google Scholar]
- Jope RS, Song L, Li PP, Yound LT, Kish SJ, Pacheco MA, Warsh JJ. The phosphoinositide signal transduction system is impaired in bipolar affective disorder brain. J Neurochem. 1996;66(6):2402–2409. doi: 10.1046/j.1471-4159.1996.66062402.x. [DOI] [PubMed] [Google Scholar]
- Jordan R, Patel S, Hu H, Lyons-Weiler J. Efficiency analysis of competing tests for finding differentially expressed genes in lung adenocarcinoma. Cancer Informatics. 2008;6:389–421. doi: 10.4137/cin.s791. [DOI] [PMC free article] [PubMed] [Google Scholar]
- Kanehisa M, Goto S. KEGG: Kyoto Encyclopedia of Genes and Genomes. Nucleic Acids Res. 2000;28:27–30. doi: 10.1093/nar/28.1.27. [DOI] [PMC free article] [PubMed] [Google Scholar]
- Kanehisa M, Goto S, Sato Y, Kawashima M, Furumichi M, Tanabe M. Data, information, knowledge and principle: back to metabolism in KEGG. Nucleic Acids Res. 2014;42:D199–D205. doi: 10.1093/nar/gkt1076. [DOI] [PMC free article] [PubMed] [Google Scholar]
- Kato T, Kato N. Mitochondrial dysfunction in bipolar disorder. Bipolar Disord. 2000;2:180–190. doi: 10.1034/j.1399-5618.2000.020305.x. [DOI] [PubMed] [Google Scholar]
- Kato T, Stine OC, McMahon FJ, Crowe RR. Increased levels of a mitochondrial DNA deletion in the brain of patients with bipolar disorder. Biol Psychiatry. 1997;42:871–875. doi: 10.1016/S0006-3223(97)00012-7. [DOI] [PubMed] [Google Scholar]
- Keener MT, Phillips ML. Neuroimaging in bipolar disorder: a critical review of current findings. Curr Psychiatry Rep. 2007;9:512–520. doi: 10.1007/s11920-007-0070-2. [DOI] [PMC free article] [PubMed] [Google Scholar]
- Kessler RC, Chiu WT, Demler O, Merikangus KR, Walters EE. Prevalence, severity, and comorbidity of 12-month DSM-IV disorders in the National Comorbidity Survey Replication. Arch Gen Psychiatry. 2005;62(6):617–627. doi: 10.1001/archpsyc.62.6.617. [DOI] [PMC free article] [PubMed] [Google Scholar]
- Kety SS. Blood flow and metabolism of the human brain in health and disease. Transactions and Studies of the College of Physicians of Philadelphia. 1950;18:103–108. [PubMed] [Google Scholar]
- Khatri P, Voichita C, Kattan K, Ansari N, Khatri A, Georgescu C, Tarca AL, Draghici S. Onto-Tools: New additions and improvements in 2006. Nucleic Acids Res. 2007;35(Web Server issue):W206–211. doi: 10.1093/nar/gkm327. Epub 2007 Jun 21. [DOI] [PMC free article] [PubMed] [Google Scholar]
- Konradi C, Eaton M, MacDonald ML, Walsh J, Benes FM, Heckers S. Molecular evidence for mitochondrial dysfunction in bipolar disorder. Arch Gen Psychiatry. 2004;61:300–308. doi: 10.1001/archpsyc.61.3.300. [DOI] [PubMed] [Google Scholar]
- Lee YS, Bailey CH, Kandel ER, Kaang BK. Transcriptional regulation of long-term memory in the marine snail Aplysia. Mol Brain. 2008;1:3. doi: 10.1186/1756-6606-1-3. [DOI] [PMC free article] [PubMed] [Google Scholar]
- Li M, Luo X-J, Rietschel M, Lewis CM, Mattheisen M, Muller-Myhsok B, Jamain S, Leboyer M, Lande M, Thompson PM, Cichon S, Nothen MM, Schulze TG, Sullivan PF, Bergen SE, Donohoe G, Morris DW, Hargreaves A, Gill M, Corvin A, Hultman C, Toga AW, Shi1 L, Lin Q, Shi H, Gan L, Meyer-Lindenberg A, Czamara D, Henry C, Etain B, Bis JC, Ikram MA, Fornage M, Debette S, Launer LJ, Seshadri S, Erk S, Walter H, Heinz A, Bellivier F, Stein LJ, Medland SE, AriasVasquez A, Hibar DP, Franke B, Martin NG, Wright MJ, Moo DS, Su B Bipolar Consortium. The Swedish Bipolar Study Group, The Alzheimer’s Disease Neuroimaging Initiative. ENIGMA Consortium, CHARGE Consortium. Allelic differences between Europeans and Chinese for CREB1 SNPs and their implications in gene expression regulation, hippocampal structure and function, and bipolar disorder susceptibility. Mol Psychiatry. 2014;19:452–461. doi: 10.1038/mp.2013.37. [DOI] [PMC free article] [PubMed] [Google Scholar]
- Lopez AD, Mathers CD, Ezzati M, Jamison DT, Murray CL. Measuring the global burden of disease and risk factors, 1990–2001. In: Lopez AD, Mathers CD, Ezzati M, Jamison DT, Murray CL, editors. Global burden of disease and risk factors. New York: The World Bank and Oxford University Press; 2006. pp. 1–13. [Google Scholar]
- MacQueen GM, Campbell S, McEwen BS, Macdonald K, Amano S, Joffe RT, Nahmias C, Young LT. Course of illness, hippocampal function, and hippocampal volume in major depression. Proc Natl Acad Sci USA. 2003;100(3):1387–1392. doi: 10.1073/pnas.0337481100. [DOI] [PMC free article] [PubMed] [Google Scholar]
- Maher BS, Hughes HB, III, Zubenko WN, Zubenko GS. Genetic linkage of region containing the CREB1 gene to depressive disorders in families with recurrent, early-onset, major depression: A re-analysis and confirmation of sex-specific effect. Am J Med Genet B. 2010;153B(1):10–16. doi: 10.1002/ajmg.b.30987. [DOI] [PMC free article] [PubMed] [Google Scholar]
- Manji HK, Lenox RH. Protein kinase C signaling in the brain: molecular transduction of mood stabilization in the treatment of manic-depressive illness. Biol Psychiatry. 1999;46:1328–1351. doi: 10.1016/s0006-3223(99)00235-8. [DOI] [PubMed] [Google Scholar]
- Manji HK, Potter WZ, Lenox RH. Signal transduction pathways. Arch Gen Psychiatry. 1995;52:531–543. doi: 10.1001/archpsyc.1995.03950190013003. [DOI] [PubMed] [Google Scholar]
- Mannie ZN, Williams C, Diesch J, Steptoe A, Leeson P, Cowen P. Cardiovascular and metabolic risk profile in young people at familial risk of depression. Br J Psychiatry. 2013;203:18–23. doi: 10.1192/bjp.bp.113.126987. [DOI] [PubMed] [Google Scholar]
- Munakata K, Iwamoto K, Bundo M, Kato T. Mitochondrial DNA3243A> G mutation and increased expression of LARS2 gene in the brains of patients with bipolar disorder and schizophrenia. Biol Psychiatry. 2005;57:525–532. doi: 10.1016/j.biopsych.2004.11.041. [DOI] [PubMed] [Google Scholar]
- Munakata K, Tanaka M, Mori K, Washizuka S, Yoneda M, Tajima O, Akiyama T, Nanko S, Kunugi H, Tadokoro K, Ozaki N, Inada T, Sakamoto K, Fukunaga T, Iijima Y, Iwata N, Tatsumi M, Yamada K, Yoshikawa T, Kato T. Mitochondrial DNA 3644T > C mutation associated with bipolar disorder. Genomics. 2004;84:1041–1050. doi: 10.1016/j.ygeno.2004.08.015. [DOI] [PubMed] [Google Scholar]
- Naydenov AV, MacDonald ML, Ongur D, Konradi C. Differences in lymphocyte electron transport gene expression levels between subjects with bipolar disorder and normal controls in response to glucose deprivation stress. Arch Gen Psychiatry. 2007;64:555–564. doi: 10.1001/archpsyc.64.5.555. [DOI] [PubMed] [Google Scholar]
- Patel S, Lyons-Weiler J. caGEDA: A web application for the integrated analysis of global gene expression patterns in cancer. Applied Bioinformatics. 2004;3(1):49–62. doi: 10.2165/00822942-200403010-00007. [DOI] [PubMed] [Google Scholar]
- Paulsen JS, Nehl C, Hoth KF, Kanz JE, Benjamin M, Conybeare R, McDowell B, Turner B The Huntington Study Group. J Neuropsychiatr Clin Neurosci. 2005;17:496–502. doi: 10.1176/jnp.17.4.496. [DOI] [PubMed] [Google Scholar]
- Perlis RH, Smoller JW, Mysore J, Sun M, Gillis T, Purcell S, Tietschel M, Nothen MM, Witt S, Maier W, Iosifescu DV, Sullivan P, Rusb AJ, Fava M, Breitner H, MacSonald M, Gusella J. Prevalence of incompletely penetrant Huntington’s disease alleles among individuals with major depressive disorder. Am J Psychiatry. 2010;167:574–5769. doi: 10.1176/appi.ajp.2009.09070973. [DOI] [PMC free article] [PubMed] [Google Scholar]
- Pfenning AR, Schwartz R, Barth AI. A comparative genomics approach to identifying the plasticity transcriptome. BMC Neuroscience. 2007;8:20. doi: 10.1186/1471-2202-8-20. [DOI] [PMC free article] [PubMed] [Google Scholar]
- Sapolsky RM. Depression, antidepressants, and the shrinking hippocampus. Proc Natl Acad Sci USA. 2001;98(22):12320–12322. doi: 10.1073/pnas.231475998. [DOI] [PMC free article] [PubMed] [Google Scholar]
- Schroeder A, Mueller O, Stocker S, Salowsky R, Leiber M, Gassmann M, Lightfoot S, Menzel W, Graznow M, Ragg T. The RIN: an RNA integrity number for assigning integrity values to RNA measurements. BMC Molecular Biology. 2006;7:3. doi: 10.1186/1471-2199-7-3. [DOI] [PMC free article] [PubMed] [Google Scholar]
- Scott R, Bourtchuladze R, Gossweiler S, Dubnau J, Tully T. CREB and the discovery of cognitive enhancers. J Mol Neurosci. 2002;19(1–2):171–177. doi: 10.1007/s12031-002-0029-z. [DOI] [PubMed] [Google Scholar]
- Sun X, Wang JF, Tseng M, Young LT. Down regulation in components of the mitochondrial electron transport chain in the postmortem frontal cortex of subjects with bipolar disorder. J Psychiatry Neurosci. 2006;31:189–196. [PMC free article] [PubMed] [Google Scholar]
- Tomita H, Ziegler ME, Kim HB, Evans SJ, Choudary PV, Li JZ, Meng F, Dai M, Meyers RM, Neal CR, Speed TP, Barchas JD, Schatzberg AF, Watson SJ, Akil H, Jones EG, Bunney WE, Vawter MP. G protein-linked signaling pathways in bipolar and major depressive disorders. Front Genet. 2013;4:297. doi: 10.3389/fgene.2013.00297. [DOI] [PMC free article] [PubMed] [Google Scholar]
- U.S., Department of Health and Human Services, National Institutes of Health, National Institute of Mental Health. Depression and diabetes. 2011a NIH Publication No. 11-5003. [Google Scholar]
- U.S. Department of Health and Human Services, National Institutes of Health, National Institute of Mental Health. Depression and heart disease. 2011b NIH Publication No. 11-5004. [Google Scholar]
- U.S. Department of Health and Human Services, National Institutes of Health, National Institute of Mental Health. Depression and Parkinson’s disease. 2011c NIH Publication No. 11-5007. [Google Scholar]
- Washizuka S, Kakiuchi C, Mori K, Tajima O, Akiyama T, Kato T. Expression of mitochondria-related genes in lymphoblastoid cells from patients with bipolar disorder. Bipolar Disord. 2005;7:146–152. doi: 10.1111/j.1399-5618.2005.00184.x. [DOI] [PubMed] [Google Scholar]
- Weeber EJ, Sweatt JD. Molecular neurobiology of human cognition. Neuron. 2002;33(6):845–848. doi: 10.1016/s0896-6273(02)00634-7. [DOI] [PubMed] [Google Scholar]
- Zhang X, Odom DT, Koo S-H, Conkright MD, Canettieri G, Best J, Chen H, Jenner R, Herbolshmeimer E, Jacobsen E, Kadam S, Ecker JR, Emerson B, Hogennesch JB, Unterman T, Young RA, Montminy M. Genome-wide analysis of cAMP-response element binding protein occupancy, phosphorylation, and target gene activation in human tissues. Proc Natl Acad Sci USA. 2005;102(12):4459–4464. doi: 10.1073/pnas.0501076102. [DOI] [PMC free article] [PubMed] [Google Scholar]
- Zubenko GS. Major depressive disorder in Alzheimer’s disease. In: Roose S, Sackheim H, editors. Late Life Depression. New York: Oxford University Press; 2004. pp. 361–369. [Google Scholar]
- Zubenko GS. Molecular Biology of Alzheimer’s disease (syndrome?) Harv Rev Psychiatry. 1997;5:177–213. doi: 10.3109/10673229709000303. [DOI] [PubMed] [Google Scholar]
- Zubenko GS, Hughes HB., III Effects of the G(-656)A variant on CREB1 promoter activity in a glial cell line: Interactions with gonadal steroids and stress. Am J Med Genet B. 2008;147B:579–585. doi: 10.1002/ajmg.b.30708. [DOI] [PubMed] [Google Scholar]
- Zubenko GS, Hughes HB., III Effects of the G(-656)A variant on CREB1 promoter activity in a neuronal cell line: Interactions with gonadal steroids and stress. Mol Psychiatry. 2009;14:390–397. doi: 10.1038/mp.2008.23. [DOI] [PMC free article] [PubMed] [Google Scholar]
- Zubenko GS, Hughes HB., III Effects of the A(-115)G variant on CREB1promoter activity in two brain cell lines: Interactions with gonadal steroids. Am J Med Genet B. 2010;153B:1365–1372. doi: 10.1002/ajmg.b.31133. [DOI] [PMC free article] [PubMed] [Google Scholar]
- Zubenko GS, Hughes HB., III Replacement of homologous mouse DNA sequence with pathogenic 6-base human CREB1 promoter sequence creates murine model of major depressive disorder. Am J Med Genet B. 2011;156:517–531. doi: 10.1002/ajmg.b.31197. [DOI] [PMC free article] [PubMed] [Google Scholar]
- Zubenko GS, Hughes HB., III No evidence of non-homologous insertions in mouse model of MDD created by replacement of homologous mouse DNA sequence with pathogenic 6-base human CREB1 promoter sequence. Am J Med Genet B. 2012;159B(1):1–4. doi: 10.1002/ajmg.b.32006. [DOI] [PMC free article] [PubMed] [Google Scholar]
- Zubenko GS, Hughes HB, III, Hitchens TK, Cohen BM. Alterations of brain anatomy in mouse model of MDD created by replacement of homologous mouse DNA sequence with an illness-associated 6-base human CREB1 promoter sequence. Am J Med Gene B. 2014;165B(1):1–8. doi: 10.1002/ajmg.b.32198. [DOI] [PubMed] [Google Scholar]
- Zubenko GS, Hughes HB, III, Maher BS, Stiffler JS, Zubenko WN, Marazita ML. Genetic linkage of region containing the CREB1 gene to depressive disorders in women from families with recurrent, early-onset, major depression. Am J Med Genet B. 2002;114:980–987. doi: 10.1002/ajmg.b.10933. [DOI] [PubMed] [Google Scholar]
- Zubenko GS, Hughes HB, Stiffler JS, Brechbiel A, Zubenko WN, Maher B, Marizita M. Sequence variations in CREB1 cosegregate with depressive disorders in women. Mol Psychiatry. 2003a;8:611–618. doi: 10.1038/sj.mp.4001354. [DOI] [PubMed] [Google Scholar]
- Zubenko GS, Maher BS, Hughes HB, III, Zubenko WN, Stiffler JS, Kaplan BB, Marazita ML. Genome-wide linkage survey for genetic loci that influence the development of depressive disorders in families with recurrent, early-onset, major depression. Am J Med Genet B. 2003b;123B:1–18. doi: 10.1002/ajmg.b.20073. [DOI] [PubMed] [Google Scholar]
- Zubenko GS, Moossy J. Major depression in primary dementia. Clinical and neuropathologic correlates. Arch Neurol. 1988;45:1182–1186. doi: 10.1001/archneur.1988.00520350020008. [DOI] [PubMed] [Google Scholar]
- Zubenko GS, Zubenko WN, McPherson S, Spoor E, Marin DB, Farlow MR, Smith GE, Geda YE, Cummings JL, Petersen RC, Sunderland T. A collaborative study of the emergence and clinical features of the major depressive syndrome of Alzheimer’s disease. Am J Psychiatry. 2003;160:857–866. doi: 10.1176/appi.ajp.160.5.857. [DOI] [PubMed] [Google Scholar]
- Zubenko GS, Zubenko WN, Spiker DG, Giles DE, Kaplan BB. The malignancy of recurrent, early-onset major depression: A family study. Am J Med Genet Part B. 2001;105(8):690–699. doi: 10.1002/ajmg.1554. [DOI] [PubMed] [Google Scholar]
Associated Data
This section collects any data citations, data availability statements, or supplementary materials included in this article.