

Abstract
Purpose
These studies determined (1) age and sex-related differences in steadiness of isometric contractions when high cognitive demand was imposed across a range of forces with the elbow flexor muscles (study 1) and, (2) sex differences in steadiness among older adults when low cognitive demand was imposed (study 2).
Methods
36 young adults (18–25 years; 18 women) and 30 older adults (60–82 years; 17 women) performed isometric contractions at 5%, 30% and 40% of maximum voluntary contraction (MVC). Study 1 involved a high-cognitive demand session (serial subtractions by 13 during the contraction) and a control session (no mental math). Study 2 (older adults only) involved a low-cognitive demand session (subtracting by 1s).
Results
Older individuals exhibited greater increases in force fluctuations (coefficient of variation of force, CV) with high cognitive demand than young adults, with the largest age difference at 5% MVC (P = 0.01). Older adults had greater agonist EMG activity with high-cognitive demand and women had greater coactivation than men (P<0.05). In study 2, CV of force increased with low cognitive demand for the older women but not for the older men (P = 0.03).
Conclusion
Older adults had reduced steadiness and increased muscle activation when high cognitive demand was imposed while low cognitive demand induced increased force fluctuations in older women but not older men. These findings have implications for daily and work-related tasks that involve cognitive demand performed simultaneously during submaximal isometric contractions in an aging workforce.
Keywords: stress, arousal, gender, aging, force fluctuations, women
Introduction
The western world population is progressively aging so that the proportion of older adults (60 years and above) will increase substantially over the next 30 years in the general population and the workforce (Toossi 2002; Brown 2003; WHO 2011). For both young and older adults, activities of daily living and work-related tasks often involve simultaneous performance of a cognitive and a motor task such as controlling electronic devices, interacting with credit card machines, handling cutlery and performing medical procedures as surgery. While aging is associated with subclinical impairments in cognitive and motor function (Salthouse 2009), many older individuals can function quite well when performing one task at time (Corp et al. 2013). When attention is divided, however, performance declines substantially in older adults (Beurskens and Bock 2012; Al-Yahya et al. 2011). Thus, cognitive demand imposed during sustained contractions may be a sensitive tool to detect subclinical impairments in cortical processes and also could have direct functional applications to activities of daily living and work-related tasks.
The ability to sustain steady contractions decreases with advancing age especially at low forces (Tracy 2007; Tracy and Enoka 2002; Vanden Noven et al. 2014; Christou 2011). Steadiness is quantified as the amplitude (standard deviation) of force exerted by a muscle group around a mean value (coefficient of variation for force, CV). The magnitude of the age-related reductions in steadiness (or increase in force fluctuations) will vary with the muscle group involved (Enoka et al. 2003) and will be greater after exposure to a stressor (e.g., unpredictable electrical stimulation of the hand) especially in older women (Christou et al. 2004). Presumably, the release of catecholamines, which typically occurs during exposure to a stressor, increases the excitability of the motoneuron pool (Heckman and Enoka 2013) and the amplitude of the force fluctuations.
Stress and anxiety can also be increased with a cognitive task and a recent studies showed that in young adults, steadiness of the upper limb decreased when a high-cognitive demand task was imposed during a static fatiguing contraction (Yoon et al. 2009; Keller-Ross et al. 2014). Similarly, for the precision grip pinch task, steadiness decreased and older adults had greater force fluctuations than young when either a low- or a high-cognitive demand task was imposed (Voelcker-Rehage et al. 2006). Although steadiness was not reduced for the ankle dorsiflexor muscles in young adults when the stressor was imposed, in older adults the steadiness was reduced significantly during very light contractions (5% MVC) when a low-cognitive demand task was imposed, and even more so with a high-cognitive demand task in both older men and women (Vanden Noven et al. 2014). Thus, age-related decreases in steadiness are likely to be greater when a cognitive task is imposed during a motor task with the upper limb compared with the lower limb, possibly because of the greater number of direct corticospinal connections that can be modulated by cortical inputs to the upper limb (Brouwer and Ashby 1990).
Sex differences in steadiness are also reported among young adults (Brown et al. 2010), but may be even greater among older adults in the upper limb for several reasons. First, for the intrinsic muscles of the hand, older women have exhibited greater increases in force fluctuations than men after exposure to a noxious stressor at very low forces (Christou et al. 2004). Second, women have a greater sympathetic response to a stressor than men (Kajantie and Phillips 2006; Christou et al. 2004; Kudielka and Kirschbaum 2005), which potentially interferes with motor control. Finally, in the upper extremity work-related muscle disorders, pain and injuries increase with age and are twice as prevalent in women compared with men (Jensen et al. 1998; Gerr et al. 2002). Whether there are sex differences among young and older adults in steadiness during submaximal tasks with the upper limb when a cognitive task is simultaneously imposed is not yet known.
Thus, a primary purpose of this study was to compare force fluctuations of young and older men and women while performing isometric contractions in the presence and absence of high cognitive demand across a range of forces (Study 1). We hypothesized that older adults would have greater increases in force fluctuations of the elbow flexor muscles than young adults when high cognitive demand was imposed during a low-force isometric contraction because of the age-related changes in the cortex and motoneuron pool (Raz et al. 2005; Tracy et al. 2005). We also hypothesized that young and older women would have greater increases in force fluctuations than men when high cognitive demand was imposed.
A second purpose determined whether there was a sex differences in force fluctuations among older adults when a low-cognitive demand task was imposed during isometric contractions with the upper limb (Study 2). We hypothesized that older women would have greater increases in force fluctuations than older men when a low-cognitive demand task was superimposed because of the physiological sex differences in response to arousal especially in older adults (Kudielka and Kirschbaum 2005; Christou et al. 2004).
Methods
Participants
Study 1: 36 young adults (18–25 years) and 30 older adults (60–82 years) were recruited for study 1 (details of physical characteristics are displayed in Table 1). Study 2 involved the same cohort of old adults only (no young adults) who visited the laboratory for an additional test session. All individuals were healthy without any neurological, orthopedic or cardiovascular condition and were naive to the protocol. All older women were post-menopausal and none were on hormone replacement therapy at the time of the study. 61% of young women (n = 11) were on birth control and there was no influence of menstrual cycle on the results; therefore, all young women were grouped for the analysis. Physical activity levels were assessed with questionnaire that estimated the relative kilocalorie expenditure of energy per week (Kriska and Bennett 1992). Each participant provided written informed consent to participate in the study and was given compensation. The protocol was approved by the Institutional Review Board.
Table 1.
Demographic and physical characteristics (mean ± SD) for control, low-cognitive demand and high-cognitive demand sessions.
| Variable | Session | Young Men | Young Women | Older Men | Older Women |
|---|---|---|---|---|---|
| n | 18 | 18 | 13 | 17 | |
|
| |||||
| Age (years) | 20.6 ± 1.8 | 20.6 ± 1.1 | 70.5 ± 5.6 | 70.3 ± 6.2 | |
|
| |||||
| Height (cm) | 185.9 ± 20.1 | 173.3 ± 11.8 | 173.8 ± 8.1 | 162.6 ± 5.1 | |
|
| |||||
| Mass (kg) | 73.8 ± 8.0 | 65.8 ± 7.5 | 88.8 ± 21.3 | 64.4 ± 8.2 | |
|
| |||||
| Physical Activity (MET-hour/week) | 57.2 ± 39.2 | 77.6 ± 38.3 | 39.5 ± 34.6 | 33.7 ± 27.9 | |
|
| |||||
| Trait anxiety (a.u) | 30.5 ± 6.1 | 30.6 ± 5.1 | 30.3 ± 4.4 | 29.5 ± 6.5 | |
|
| |||||
| MVC Torque (Nm) | Control | 72.3 ± 11.3* | 44.8 ± 6.8 | 66.7 ± 11.6 † | 32.3 ± 3.87 |
| Low-CD | 65.7 ±10.9 † | 32.6 ± 3.7 | |||
| High-CD | 71.0 ± 12.1* | 44.9 ± 7.6 | 65.0 ± 10.9 † | 31.9 ± 4.3 | |
|
| |||||
| Average | 71.7 ± 11.6* | 44.8 ± 7.1 | 65.9 ± 10.8 † | 32.1 ± 3.9 | |
sex difference for young adults (P<0.001)
sex difference for old adults (P<0.001)
a.u = arbitrary unit
High-CD = High-level cognitive demand session
Low-CD = Low-level cognitive demand session
MVC = Maximal voluntary contraction
MET = Metabolic equivalents
Trait anxiety was estimated using the State-Trait Anxiety Inventory at baseline
Study 1. Control versus High Cognitive Demand in Young and Older Men and Women
Participants reported to the laboratory for an initial familiarization session followed by two experimental sessions (>7 days apart) counterbalanced between groups; a) a high-cognitive demand session (cognitive task described below) and b) control session. The non-dominant arm was tested to minimize variability between participants that can occur due to differences in activities performed with the dominant arm. In the control session, contractions were performed without performing the cognitive task. During the high-cognitive demand session, each participant performed the cognitive task at rest before the contractions and also during each submaximal contraction.
Mechanical recordings of force
Each participant was seated upright in an adjustable chair with the non-dominant arm abducted slightly and the elbow resting on a padded support with the elbow joint flexed to 90°. The setup was similar to that described elsewhere (Yoon et al. 2007). In brief the hand and forearm were placed in a modified wrist-hand-thumb orthosis (Orthomerica, Newport Beach, CA), and the forearm was placed midway between pronation and supination. Elbow flexion force was measured with a transducer (JR-3 Force-Moment Sensor; JR-3, Woodland, CA, range ± 800 N; resolution: 0.10 N) and displayed on a 22-inch monitor. Force was recorded online at 500 samples/s using a Power 1401 analog-to-digital (AD) converter and Spike 2 software [Cambridge Electronic Design (CED), Cambridge, UK] with no amplification or filtering of the force signal.
Electromyography (EMG)
EMG was recorded with bipolar surface electrodes (Ag-AgCl, 8-mm diameter; 16 mm between electrodes) placed over biceps brachii, brachioradialis, and triceps brachii muscles. The recording electrodes on each muscle were placed over the muscle belly in accordance with locations recommended by the European Recommendations for Surface Electromyography (Hermens et al. 2000). Reference electrodes were placed on a bony prominence at the elbow. The EMG signal was amplified (100×) and band-pass filtered (13–1000 Hz) with Coulbourn modules (Coulbourn Instruments, Allentown, PA) before being recorded directly to a computer with the Power 1401 A-D converter and Spike 2 software (CED). The EMG signals were digitized at 2,000 samples/s and analyzed offline using Spike2 software (CED).
Cardiovascular Measurements
Blood pressure and heart rate were monitored before and during contractions with an automated beat-by-beat blood pressure monitor (NIBP-100D noninvasive blood pressure system coupled with a MP150 data acquisition system; Biopac, Goleta, California, USA). A blood pressure cuff was placed around the index and middle finger of the relaxed dominant hand with the arm placed on a table adjacent to the subject at heart level. Blood pressure and heart rate signals were recorded onto computer with the Power 1401 A-D converter and Spike 2 software (CED) at 500 samples/s.
Assessment of Anxiety
Levels of anxiety were assessed throughout the protocol with a visual analogue scale (VAS, 1 to 10) anchored at the far left by “not at all anxious” and at the far right by “very anxious”(Yoon et al. 2009). The right anchor corresponded to the most anxious moment in the life of the subject. Anxiety was defined as the negative feelings regarding the immediate future. VAS for anxiety was recorded at five time points during the protocol: two baselines, one before and one after the MVCs (T1 and T2 respectively); after the first and second 2 min bouts of cognitive demand at rest (high-cognitive demand session) or 2 min of quiet sitting (control session) (T3 and T4 respectively), and; after the submaximal contractions (T5) (Figure 1).
Figure 1.
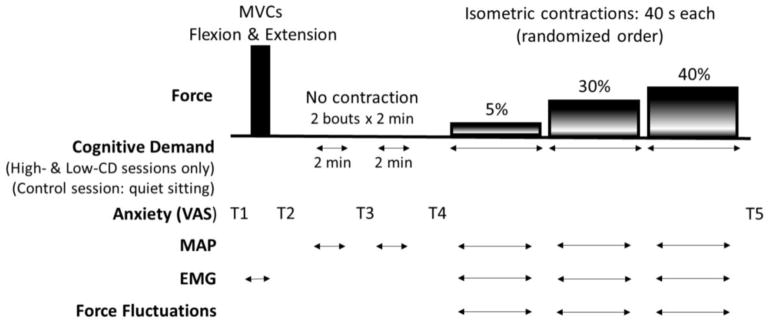
Experimental Protocol. Force tasks performed by each participant with the elbow flexor muscles and elbow extensors (MVC only) are shown in the top panel. Force fluctuations were quantified during each submaximal contraction (5, 30 and 40% of MVC). Bottom panels show horizontal arrows indicating when cognitive demand was performed during the high- and low-cognitive demand sessions. Mental math was performed at rest for 4 minutes [divided in 2 periods of 2 minutes (2 min × 2 min)] and continuously during submaximal contractions. In the control session, each subject sat quietly for the 4 minutes (2 min × 2 min) and performed the brief isometric contraction with no cognitive demand. Horizontal arrows indicate when MAP and EMG were recorded during each test session. Time points to estimate anxiety levels with VAS for anxiety are indicated (T1-T5). The schematic is not to scale for time or force. MVC: maximal voluntary contractions; MAP: mean arterial pressure; VAS: visual analog scales; EMG: electromyography, High-CD: High-Cognitive Demand Session; Low-CD: Low-Cognitive Demand Session.
The trait portion of the State-Trait Anxiety Inventory (STAI) (20 questions in a four-point Likert-type scale) was used to estimate overall individual differences in anxiety proneness (Spielberger et al. 1970).
High-Cognitive Demand Task
Difficult mental math is an established psychosocial technique to induce arousal and stress (Kajantie and Phillips 2006). As such, it was used as the high-cognitive demand task. Each participant performed serial subtraction from a four-digit number by 13 with one response required every 3 s (Noteboom et al. 2001). If the participant made an error in serial subtraction or was unable to provide the correct answer within 3 s, the mental math procedure was restarted with a new four-digit number (Yoon et al. 2009; Keller-Ross et al. 2014). Mental math was performed before the submaximal contractions while at rest (2 × 2-min bouts) and then continuously during the submaximal contractions in the high-cognitive demand session (Figure 1).
Experimental protocol
The protocol for each experimental session (control and high-cognitive demand session) involved the following procedures: 1) maximal voluntary isometric contractions (MVC) of the elbow flexor muscles and elbow extensor muscles; 2) assessment of anxiety before and after 2 × 2-min bouts of either quiet sitting (control session) or mental math (high cognitive demand); 3) submaximal contractions at 5, 30 and 40% of MVC force with mental math (high-cognitive demand session) or no mental math (control session); and 4) assessment of anxiety (VAS) immediately after the submaximal contractions (Figure 1).
MVC task
The participant performed 3–4 MVC trials with the elbow flexor muscles followed by MVCs with the elbow extensor muscles with 60-s rest between each trial. If the peak force achieved for two of the first three trials was not within 5% of each other, additional trials were performed until this criterion was met. The greatest force achieved with the elbow flexor muscles was taken as the MVC force and used to calculate the target forces for the submaximal contractions.
Mental Math at Rest
After the MVCs, the mental math task (2 bouts × 2 min) was conducted while at rest. During the control sessions, the mental-math task was substituted by quiet sitting during the 2 × 2 min intervals.
Submaximal Contractions
Isometric contractions were performed at 5%, 30% and 40% of MVC for 40 s each. During the high-cognitive demand session, participants began the subtraction by 13 from a 4-digit number once they were at the target force required during each submaximal contraction. During the control session each participant performed submaximal contraction only. A very low intensity of 5% MVC was chosen because previous studies indicate that age differences in steadiness are more likely present at lower contraction intensities (Enoka et al. 2003). For contraction intensities greater than 40% MVC, it was difficult for subjects to maintain a long enough contraction to impose cognitive demand without inducing confounding effects of fatigability. However, 30% and 40% MVC were adequate to increase the requirements of the motor task to stress the interaction between the cognitive and motor task.
Study 2. Control versus Low Cognitive Demand in Older Men and Women
The experimental setup and protocol for study 2 was the same as outlined for study 1 with the exception that cognitive demand involved subtracting by 1 from 100 and was considered a low-cognitive demand tasks. For study 2, each of the 30 older adults (17 women and 13 men) that participated in study 1 were recruited for an additional session (7 days apart from other sessions). As in study 1, the submaximal contractions involved maintaining a force that was equivalent to 5, 30 and 40% of MVC as steady as possible. The low-cognitive demand session was counterbalanced with the control and high-cognitive demand sessions for the older adults.
Data analysis
For each study the torque for the MVC and submaximal contractions were calculated as the product of force and the distance between the elbow joint and the point at which the wrist was attached to the force transducer. The MVC torque was quantified as the average value over a 0.5-s interval that was centered about the peak. The maximal EMG for each muscle was determined as the Root Mean Square (RMS) value over a 0.5-s interval about the same interval of the MVC torque. The maximal EMG value of the involved muscles was then used to normalize the RMS of EMG values recorded during brief submaximal contractions.
The steadiness was calculated as the amplitude of the force fluctuations using the coefficient of variation of the force (CV = Standard deviation of the force/mean of force × 100). The CV of force was calculated over the middle 30 s period of each 40 s submaximal contraction. The RMS of EMG values were also quantified over the same time epoch during each submaximal contraction.
For each cognitive demand period at rest (2 × 2 min at rest) and submaximal contractions, the blood pressure signal was analyzed for the mean peaks [systolic blood pressure (SBP)], mean troughs [diastolic blood pressure (DBP)]. Mean Arterial Pressure (MAP) was calculated for each epoch with the following equation: MAP = DBP + 1/3 (SBP - DBP). Heart rate was also collected during each session but results are not shown because they were similar to the findings for MAP.
Coactivation was quantified as the ratio of the antagonist and agonist muscles (Rudroff et al. 2010) so that the RMS of triceps brachii (antagonist) was normalized to the EMG during the elbow extension MVC and then divided by RMS of biceps brachii normalized to the EMG during the elbow flexion MVC (triceps brachii/ biceps brachii × 100). EMG data from triceps brachii or biceps brachii were excluded from coactivation analysis in cases when the signal-to-noise ratio was less than 5% (~50% of the data as indicated by the degrees of freedom reported in the results). All analysis were performed in Spike 2 software (Cambridge Electronic Design, Cambridge, UK).
Statistical analysis
Data are reported as means ± SD within the text and displayed as means ± SE in the figures. Repeated measures Analysis of Variance (ANOVA) with age and sex as between-subject factors and with repeated measures on combinations of sessions, time and intensities were used to detect differences in the dependent variables including force fluctuations (CV, %), MAP, RMS EMG activity, coactivation, error rates and VAS for anxiety. Specifically, separate repeated measures ANOVAs were used to compare: a) control session vs. high cognitive demand, with age and sex as between-subject factor (study 1) and b) control session vs. low-cognitive demand session vs. high-cognitive demand session, with sex as between subject factor (study 2). For study 2, the 3 sessions were included in the repeated measures ANOVA to determine if the effects of low cognitive demand differed to high cognitive demand. Physical activity levels and trait-anxiety scores were compared between groups using a two factor ANOVA with age and sex as independent variables. For each ANOVA the sphericity of data was verified with Mauchly’s test and technical corrections were performed whenever necessary. In cases where F test was significant, post hoc t-tests with Bonferroni corrections were performed to detect differences among pairs.
To determine the influence of physical activity levels on force fluctuations with cognitive demand, the Person product-moment correlation coefficient for each submaximal contraction was performed. To determine any influence of baseline MVC on changes in coactivation with cognitive demand, the Spearman’s rank correlation coefficient was used due to non-normality of the coactivation data (verified with the Shapiro-Wilk test). After checking for the absence of colinearity using the variance inflation factor, stepwise multiple regressions were also performed to identify whether age or sex could predict the increase in coactivation with cognitive demand (criterion variable). The statistical significance was considered as P < 0.05 and all analysis were performed in IBM Statistical Package for Social Sciences (SPSS) version 21.
RESULTS
Study 1. Control versus High Cognitive Demand in Young and Older Men and Women
Baseline MVC and physical activity levels
At baseline, men were stronger than women (sex effect: F1,62=184.76, P < 0.001 ) for both young and older adults (37% and 50% respectively, P < 0.001) (Table 1). The age difference in baseline MVC however, was greater for the women (28% difference between the young and older women: 44.8 ± 7.1 vs. 32.1 ± 3.9 Nm respectively; P < 0.001) than the men who differed by 8.3% (71.7 ± 11.6 vs. 65.9 ± 10.8 Nm; age × sex interaction, F1, 62 = 3.99; P = 0.04). There were no effects of session, and no interactions with age or sex (P > 0.05).
Young adults reported higher levels of physical activity than older adults (67.4 ± 39.5 vs. 36.4 ± 31.3 MET-hour/week respectively; age effect: F1,62 = 11.81, P = 0.001) for both men and women (age × sex interaction: F1,62 = 2.26, P = 0.14).
Force fluctuations
For the control session, the amplitude of force fluctuations (CV) was larger for the 5% than the 30% and 40% MVC tasks (intensity effect: F2,61 = 21.2, P < 0.001). Older adults however, had a larger CV at 5% MVC compared with young adults (2.6 ± 0.9 vs. 1.9 ± 0.9 % respectively; age × intensity: F2,61 = 9.29, P < 0.001) for both men and women (sex × intensity: F2,61 = 1.01, P = 0.37; sex × age × intensity: F2,61 = 0.58, P = 0.56) (Figure 2).
Figure 2.

Force fluctuations quantified as the coefficient of variation of force (CV, %) during contractions at 5, 30 and 40% of maximal voluntary contraction (MVC) force for young adults (A) and older adults (B). Values are means ± SE for men (closed symbols) and women (open symbols) during the control session (circles) and high-cognitive demand session (High-CD, squares). (C) Shown are the 5% MVC force records for a control and high-cognitive demand session for a young and older woman. [*session × intensity × age, P = 0.01].
When high cognitive demand was imposed, CV was greater for both young and older adults than control (session effect: F1,62 = 84.1, P < 0.001); however, older adults had greater increases in CV than young adults (session × age: F1,62 = 46.0, P < 0.001). The increase in CV with high cognitive demand in older adults was greater at the 5% MVC than 30 and 40 % MVC (session × intensity × age: F2,61 = 4.88, P = 0.01) for both men and women (session × intensity × sex: F2,61 = 0.38, P = 0.68) (Figure 2). However, women [both young and older (session × age × sex: F2,61 = 0.78, P = 0.38)] had greater increases between control and high cognitive demand than men (2.2 ± 0.8 to 5.0 ± 2.2 % vs. 2.2 ± 0.8 to 3.9 ± 2.2 % respectively; session × sex: F1,62 = 4.48, P = 0.03).
There was no association between physical activity levels and the increased force fluctuations with high cognitive demand for the 5% MVC [r(64)= −0.18, P = 0.13], 30% MVC [r(64) = −0.11, P = 0.36] or 40% MVC [r(64) = −0.01, P = 0.98].
EMG activity of agonist muscles
The biceps brachii EMG activity (% MVC) was similar between young and older adults (19.2 ± 6.3 vs. 21.8 ± 6.4 % of MVC respectively; age effect: F1,62 = 2.54, P = 0.12) and between men and women (19.1 ± 6.4 vs. 21.9 ± 6.3 % of MVC respectively; sex effect: F1,62 = 3.48, P = 0.07). Biceps brachii EMG activity (% MVC) increased with contraction intensity (intensity effect: F2,61 = 319.13, P < 0.001). When high cognitive demand was imposed during the submaximal contractions, older adults had a greater EMG activity relative to control compared with young adults (session × age: F1,62 = 5.34, P = 0.02) for both men and women (session × sex: F1,62 = 0.30, P = 0.59; session × sex × age: F1,62 = 2.59, P = 0.11). These interactions were consistent across all contraction intensities (session × intensity: F2,61 = 1.02, P = 0.37; session × age × intensity: F2,61 = 2.55, P = 0.09) (Figure 3A). There was no association between the relative change in EMG activity of the biceps brachii between control and the high-cognitive demand session with the relative increase in CV for older adults [5% MVC: r(28) = 0.15, P = 0.44; 30% MVC: r(28) = −0.16, P = 0.38; 40% MVC: r(28) = 0.10, P = 0.59].
Figure 3.

Electromyographic activity (EMG, % MVC) during control and high cognitive demand (High-CD) sessions with all contraction intensities in all panels. A–B: EMG activity of the biceps brachii (A) and brachioradialis muscle (B) in young and older adults. C–D: Coactivation of young (C) and older (D) men and women. All values are means ± SE. MVC, maximal voluntary contraction. [* session × age, P < 0.05; # session effect, P < 0.05; &: session × sex, P < 0.05].
For the brachioradialis, EMG activity (% MVC) of young adults was lower than for older adults (16.7 ± 5.7 % vs. 22.3 ± 5.8 % respectively; age effect: F1,62= 15.3, P < 0.001) with no difference between men and women (20.1 ± 5.8 vs. 18.2 ± 5.8 % of MVC; sex effect: F1,62 = 3.58, P = 0.06). The EMG activity of brachioradialis also increased as contraction intensity increased (intensity effect: F2,61 = 328.0, P < 0.001) with lower EMG activity during the high-cognitive demand session than the control session (session effect: F1,62 = 6.36, P = 0.01) for both age groups (session × age: F1,62 = 0.06, P = 0.81) and for both men and women (session × sex: F1,62 = 0.41, P = 0.52) (Figure 3B). There was no association between the relative change in brachioradialis EMG from control to the high-cognitive demand session with the relative increase in CV for young and older adults [5% MVC: r(64) = −0.04, P = 0.77; 30% MVC: r(64) = 0.02, P = 0.88; 40% MVC: r(28) = −0.17, P = 0.18].
Coactivation
Coactivation increased for women but not for men during the high-cognitive demand session compared with control (session × sex: F1,32 = 4.89, P = 0.03) and this was similar for young and older adults (session × sex × age: F1,32= 0.04, P = 0.84) (Figure 3C and 3D). The coactivation levels were similar for young and older adults (age effect: F1,32 = 1.85, P = 0.18). Coactivation was similar for all levels of contraction (intensity effect: F2,31 = 0.44, P = 0.65) for young and older adults (intensity × age: F2,31 = 0.22, P = 0.80) with no other interactions with intensity, sex and age (P > 0.05).
The increase in coactivation with high cognitive demand (increase between control and high-cognitive demand session) was not correlated with the increase (%) in force fluctuations for young adults [5% MVC: (r (18) = 0.37, P = 0.10), 30% MVC: (r(30) = 0.07, P = 0.72) or 40% MVC: (r(31)= −0.31, P = 0.08)] or older adults [(5% MVC: (r(13) = 0.07, P = 0.80), 30% MVC: (r(26) = 0.01, P = 0.97, 40% MVC: (r(26) = −0.18, P =0.35)].
During contractions at 5% MVC, association analysis between baseline MVC and the change in coactivation, showed that weaker individuals at baseline (mostly women) had greater increases in coactivation when high cognitive demand was imposed (r(33) = −0.35, P = 0.04). For the other contraction intensities, there was no association between baseline MVC and the increase in coactivation with high-cognitive demand [30% MVC: r(58) = −0.05, P = 0.70 and 40% MVC: r(59) = 0.10, P = 0.43].
Anxiety levels
Table 1 indicates that there was no difference in the trait portion of the STAI (i.e. proneness to anxiety) between young and older adults (age effect: F1,62 = 0.26, P = 0.61) and for men and women (sex effect: F1,62 = 0.04, P = 0.84) with no interaction of age and sex (F1,62 = 0.08, P = 0.78).
VAS for anxiety increased during the high-cognitive demand session compared with the control session for all groups (session × time: F4,59 = 43.89, P < 0.01, Figure 4A and 4B). For VAS there was no main effect for age (F1,62 = 1.04, P = 0.31) or sex (F1,62 = 3.27, P = 0.08) and no interactions (P > 0.05).
Figure 4.

Anxiety and Mean Arterial Pressure (MAP) for young adults (A & C respectively) and old adults (B & D respectively). Time intervals at which anxiety was recorded with the visual analogue scale (VAS) are baseline (T1, T2), after the first and 2nd bout of cognitive demand (CD) or quiet sitting (control) at rest (T3, T4), and after submaximal contractions (T5). MAP during each period of cognitive demand or quiet sitting at rest are shown (bout 1 and 2: B1, B2 respectively) and also during the submaximal contractions at 5%, 30% and 40% MVC. The values are means ± SE during the control session (circles), low-cognitive demand session (Low-CD, triangles) and high cognitive demand (High-CD, squares). MAP is the average of 15-s intervals. [* session × time, P < 0.05; # session effect, P < 0.05].
MAP
When cognitive demand was performed at rest (i.e. without the submaximal contraction), there was an increase in the MAP during high cognitive demand compared with the control session of quiet sitting (session effect: F1,62 = 86.6, P < 0.001) (B1 and B2 in Figure 4C and 4D). Older adults however, had a greater increase in MAP between control and high cognitive demand (83.3 ± 16.5 to 101.86 ± 19.4 mmHg) than young adults (75.2 ± 14.9 to 85.5 ± 17.5 mmHg, respectively; session × age: F1,62 = 7.15, P = 0.01) and this greater increase with age was similar for men and women (session × age × sex: F1,62 = 0.02, P = 0.87).
During contraction, MAP was greater during the high-cognitive demand session than control (session effect: F62,1 = 35.6, P < 0.001) for young and older adults (session × age: F1,62 = 1.83, P = 0.18) and for men and women (session × sex: F1,62 = 0.19, P = 0.65). The MAP was greater during the higher force contractions (intensity effect: F1,62 = 23.7, P<0.001) (Figure 4C and 4D). However, the increase in MAP between control and the high cognitive demand contractions were relatively larger for the 5% MVC task than the 30% and 40% MVC (session × intensity: F1,62 =3.75, P = 0.03) in both older and young adults (session × intensity × age: F1,62 = 0.11, P = 0.89) and for men and women (session × intensity × sex: F1,62 = 0.24, P = 0.78) (Figure 4C and 4D).
Error rates in mental math during high cognitive demand
The error rates during the mental math performed at rest were greater during the first 2-min bout than the second bout (bout effect: 3.6 ± 1.2 errors.min−1 vs. 3.0 ± 1.0 errors.min−1, respectively; F1,61 = 14.7, P<0.001). This bout effect did not differ for the young and older adults (bout × age: F1,61 = 3.44, P = 0.07), nor for men and women (bout × sex: F1,61= 2.32, P = 0.13). During rest there was no main effect of age or sex (P > 0.05).
During submaximal contractions, the error rates were similar for young and older adults (age effect: F1,62 = 2.34, P = 0.13) and men and women (sex effect: F1,62=1.24, P = 0.27). However, error rates were greater during 40% MVC task than 30% and 5% MVC (3.7 ± 1.3 vs. 3.2 ± 1.6 vs. 3.4 ± 1.4 errors.min−1 respectively, intensity effect: F2,124 = 3.18, P = 0.04). This occurred for both young and older (intensity × age: F2,124 = 0.27, P = 0.76) and both sexes (intensity × sex: F2,124 = 2.56, P = 0.81).
Study 2: Control versus Low Cognitive Demand in Older Men and Women
Baseline MVC
Baseline strength was similar for the low-cognitive demand session compared with the control and high-cognitive demand sessions (session effect: F2,56 = 2.40, P = 0.10) for older men and women (session × sex: F2,56 = 1.22, P = 0.30). Older men were stronger than older women (sex effect: F1,28 = 137.0, P < 0.001) (Table 1).
Force Fluctuations
CV of force was greater in the low- and high-cognitive demands session than the control session, but more so the for the older women than older men (session × sex: F1,28 = 4.95; P = 0.03) across all intensities of contractions (session × intensity × sex: F4,25 = 0.65, P = 0.63) (Figure 5). The increase in CV of force was less during low- than high-cognitive demand session (P < 0.001) for both men and women (P = 0.37).
Figure 5.
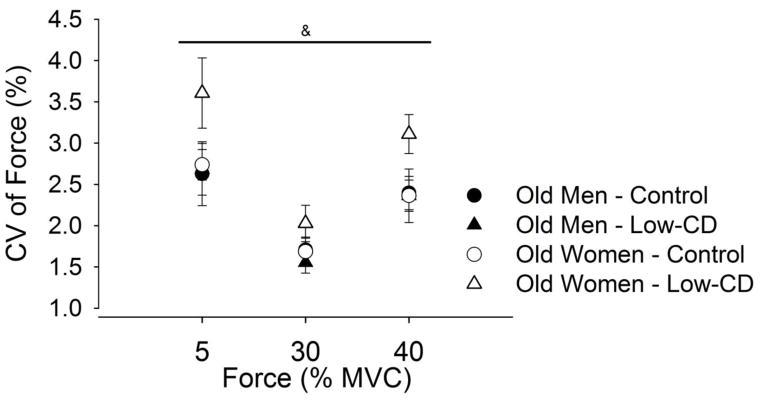
Force fluctuations, quantified as the coefficient of variation of force (CV, %), during contractions at 5, 30 and 40% of maximal voluntary contraction (MVC) force for older men and women (study 2). Values are means ± SE for men (closed symbols) and women (open symbols) during the control session (circles) and low-cognitive demand session (Low-CD, triangles). [& session × sex, P < 0.05].
EMG activity of agonist muscles
For older adults biceps brachii EMG activity did not differ between low-cognitive demand and control sessions (session effect: F2,27 = 2.28, P = 0.12) for both sexes and all contractions (P > 0.05). Similar results were found for the brachioradialis; there was no increase in EMG activity with low cognitive demand (session effect: F2,27 =1.45, P = 0.25) for both men and women and across contraction intensities (P > 0.05).
Coactivation
Control and low-level cognitive demand sessions had similar coactivation levels (triceps/biceps brachii × 100) for 5%, 30% and 40% of MVC during the control session (19.1 ± 16.3% vs. 19.5 ± 16.2% vs. 19.0 ± 12.7%, respectively) and low-cognitive demand session (18.3 ± 16.6% vs. 21.5 ± 19.2% vs. 19.5 ± 17.6% respectively; session × intensity: F2,14 = 1.30, P = 0.30) and no interactions (P > 0.05).
Anxiety levels
For older adults the anxiety (VAS) increased as cognitive demand increased throughout the session (session × time: F8,21 = 8.45, P < 0.001) similarly for men and women (session × time × sex: F8,21 = 0.60, P = 0.76). Post hoc analysis indicate that anxiety levels was greater over time with low-cognitive demand compared with control session (P < 0.001). However, the anxiety levels over time during high-cognitive demand session were higher than low-cognitive demand session (P < 0.001) (Figure 4B).
MAP
When cognitive demand was performed at rest (i.e. without the submaximal contraction), MAP increased when low cognitive demand was imposed (session effect: F2,56 = 29.5, P < 0.001) and this effect was similar for older men and women (session × sex: F2,56 = 1.32, P = 0.27). MAP increased to similar levels for the low- and high-cognitive demand sessions (P > 0.05) (Figure 4D).
For older adults during submaximal contractions there was an increase in MAP with both low and high cognitive demand compared with the control session (session effect: F2,27 = 13.7, P < 0.001). This effect was similar for older men and women (session × sex: F2,27 = 0.19, P = 0.83). Post hoc analysis indicated that low cognitive demand had greater MAP than control session (P < 0.001) and reached the same levels as the high-cognitive demand session (P = 1.00). MAP increased with cognitive demand similarly for all the intensities of contraction (session × intensity: F4,25 = 1.85, P = 0.15) in both older men and older women (session × intensity × sex: F4,25 = 0.45, P = 0.77) (Figure 4D).
Discussion
The results of this study were novel, demonstrating that older adults had greater increases in force fluctuations with the elbow flexors muscles across a range of submaximal forces when a high cognitive demand was imposed, and the greatest increase was at a low force (5% MVC) (study 1). These findings were accompanied by greater muscle activation of the biceps brachii during the high-cognitive demand task in the older adults, indicating that altered motor unit behavior of agonist muscles are involved. Further, we identified sex differences in coactivation and therefore muscle activation strategies when high cognitive demand was imposed during the submaximal task. We also observed an age difference in steadiness for the elbow flexor muscles during control isometric contractions which is typically not seen (Tracy et al. 2007b; Graves et al. 2000) and showed that imposition of low cognitive demand resulted in greater force fluctuations for the older women but not in the older men (study 2). These results have important implications for older adults who are required to perform simultaneously low force contractions and a cognitively demanding task in daily and work-related tasks with the upper limb.
High and low-cognitive demand tasks increased anxiety and MAP in older adults
Mental math is a known cognitive stressor (Kajantie and Phillips 2006), which we manipulated to induce two levels of anxiety and cognitive load. As such, reported VAS for anxiety was elevated with high cognitive demand at rest (i.e. without the submaximal contraction shown as T3 and T4 in figure 4A–B) relative to control (study 1) and to similar magnitudes in young and older men and women. These results indicate similar perceptions of heightened arousal for each age group and sex. The low-cognitive demand task (subtracting by 1, study 2), which involved older men and women only, also evoked increased VAS for anxiety, although these levels were less than the high-cognitive demand task and the response was similar for the older men and women.
Accordingly, both young and older adults experienced elevated MAP at rest in response to the high-cognitive demand task (study 1) indicating the task was sufficient to induce arousal. In contrast to others (Ng et al. 1994) however, older adults had greater increases in MAP than the young during the high-cognitive demand task performed at rest (prior to the contractions) indicating a more hypertensive reaction to the same perceived level of anxiety than the young. MAP also increased during the low-cognitive demand task in the older adults to similar levels as the high-cognitive demand task for both older men and women. Thus, despite older adults reporting lower levels of anxiety to a low- than the high-cognitive demand task (at rest and during contraction), the physiological response (MAP) was similar for the two cognitive demand conditions. The older women however, had greater reductions in steadiness with low cognitive demand than men despite a similar increase in MAP and VAS anxiety.
Reduced Steadiness with Age and High Cognitive Demand
Importantly, there was an age-related reduction in steadiness during control contractions, which is typically observed for other muscles (Tracy and Enoka 2002; Galganski et al. 1993; Burnett et al. 2000), but has not been shown before for the elbow flexor muscles (Graves et al. 2000; Tracy et al. 2007b) possibly due to a small effect size for the elbow flexor muscles compared with other muscles. The age difference in steadiness for the elbow flexors was probably due to age-related changes in the inputs to the motoneuron pool (Barry et al. 2007) possibly with some influence of greater motor unit discharge rate variability in older adults at the very low forces (Tracy et al. 2005; Kornatz et al. 2005; Laidlaw et al. 2000; Negro et al. 2009; Barry et al. 2007).
When high cognitive demand was imposed during isometric contractions in our study, the older adults had large increases in CV of force across all intensities of contraction with the greatest increase at 5% MVC task. Because motor unit discharge rate variability can contribute to the force fluctuations at very low forces (Jesunathadas et al. 2012; Tracy et al. 2005; Negro et al. 2009), increased variability of motor unit discharge rates in the older adults may have had an even larger effect at the 5% force than the higher forces when high cognitive demand was imposed in the upper limb.
We also showed that the age-related increases in force fluctuations with imposed high cognitive demand at the low force (5% MVC) was greater (~500% relative increase and a ~7% absolute change in CV) than we had previously observed for the lower limb muscles (41% relative increase and a 4.9% absolute change in CV) (Vanden Noven et al. 2014). Older adults having a larger force CV during control contractions with the ankle dorsiflexion compared with elbow flexion (11.9% vs 2.6%) possibly influenced the lesser increase in CV with high cognitive demand in the dorsiflexor muscles. Alternatively, the greater number of corticospinal connections onto the motoneuron pool of the arm muscles (Brouwer and Ashby 1990; Meier et al. 2008; Chen et al. 1998) may further amplify any age-related differences in excitation or decreased inhibition to the motor neuron pool (Sale and Semmler 2005; Peinemann et al. 2001; Hunter et al. 2008) when there is altered motoneuronal inputs from increased cognitive demand and arousal. The interconnections between premotor and the prefrontal cortical areas (Takahara et al. 2012) can also explain the findings. Because the difficult mental math induced stress (reported as increased anxiety and MAP) and taxed working memory, both of which rely on similar circuitry in the prefrontal cortex (Schweizer et al. 2013), any age-related shrinkage in the pre-frontal cortex (Raz et al. 2005) and its connection to the premotor areas (Takahara et al. 2012) may lead to a decline in motor performance in the old adults, especially in the upper limb muscles.
Other variables provided insight into the age-related loss of steadiness when high cognitive demand was imposed. First, the decrease in steadiness in the older adults was not related to error rates of mental math during the sustained contractions and so did not explain age- or sex-related differences in force fluctuations when cognitive demand was imposed during the contraction. Although age-related changes in visual-motor processing may contribute to increased force fluctuations during static contractions with age (Henningsen et al. 1997; Seidler-Dobrin and Stelmach 1998; Tracy et al. 2007a; Fox et al. 2013; Christou 2011), the visual gain was similar across the control and cognitive demand sessions for each participant so likely had minimal influence on the stress-related changes in force fluctuations.
Age-related differences in muscle activation could be related to the increase in force fluctuations with imposition of high cognitive demand. Activation of the biceps brachii muscles were greater for the older adults but not young when the high cognitive demand was imposed and this was universal to all the contraction intensities (Figure 3A). Accordingly, the brachioradialis muscle showed decreased activation with high cognitive demand although this occurred for both young and older adults. The altered activation strategies and the greater activation of biceps with high cognitive demand appeared to have a greater impact on the steadiness of the older adults. The effect of increased activation of the biceps in the older adults may have been amplified at low intensities because few motor units are discharge during low than higher forces (Heckman and Enoka 2013). A change in activation to the motoneuron pool (either increase excitation or decreased inhibition) such as that elicited with the high-cognitive demand task is more likely to have a larger impact on force variability at lower forces than when excitation is large at higher forces.
Coactivation (activation of the triceps brachii relative to the biceps brachii) also increased with high cognitive demand but only in the young and older women across all forces and not on average for the men. Thus, coactivation did not explain the change in age-related increase in force fluctuations in response to the high cognitive demand. These sex differences in coactivation indicate that men and women used different neural activation strategies when high-cognitive demand was imposed and are likely related to sex differences in response to stress. Perhaps modulation of synaptic input to agonist and antagonist muscles were altered due to the neuromodulatory effects of catecholamines that are released with stress (Kajantie and Phillips 2006; Kudielka and Kirschbaum 2005). For example, animal experiments show that the gain of motoneurons are modulated by both neuromodulatory and ionotropic inputs that can differ in strength between low- and high-threshold motoneurons (Heckman and Enoka 2013) and may also vary in effects as the distribution of low- and high-threshold motor units differ between the sexes and age groups. Nonetheless, future studies need to address the potential mechanisms for the sex differences in coactivation when cognitive demand was imposed.
Reduced Steadiness in Older Women with Low Cognitive Demand
Another notable finding was that with low cognitive demand among older adults (counting backwards by 1), the older women only and not the older men exhibited increased force fluctuations across all intensities of contraction (Figure 5). For the ankle dorsiflexor muscles the same mental math task increased force fluctuations similarly for both men and women and only at low forces (Vanden Noven et al. 2014), so the sex difference is specific to the upper limb. Muscle activation strategies (both agonist and antagonist) did not explain the increased force fluctuations with the low cognitive demand in the women. Arousal induced by a noxious stimuli prior to the task, decreased steadiness for a pinch grip in older women (Christou et al. 2004) and similar to our findings, changes in force fluctuations were not associated with muscle activation.
There was no sex differences among the older adults in the cardiovascular response and therefore sympathetic activation with low cognitive demand, however, the older women had greater force fluctuations than the old men indicating a greater gain in variability of the motor output of the women. Potential mechanisms involve sex differences in neuromuscular physiology and brain activation. Women, for example, typically have greater proportion of Type I fibers than men (Hunter 2014) that are typically activated by low threshold motoneurons. Low threshold motoneurons have strong bistability and long lasting persistent inward currents (Heckman and Enoka 2013) so the effects of cathecolamines during increased anxiety are potentially larger in women for similar neuromodulatory and ionotropic inputs. Another possibility is a sex difference in brain activation. For example, regulation of emotion relies on similar neural circuitry to that of working memory (targeted in our mental math task) in the prefrontal cortex (Schweizer et al. 2013). Because men and women use different mechanisms to regulate emotions and respond to stress (Taylor et al. 2000), any sex differences in brain activation (Stevens and Hamann 2012) and potential differences in the connectivity between prefrontal cortex and premotor areas (Takahara et al. 2012; Meier et al. 2008) may lead to differences force fluctuations even when a low cognitive demand is imposed.
Conclusion
Older adults were less steady (greater amplitude of force fluctuations) than young for the elbow flexor muscles under control conditions and this was amplified up to 5-fold with high cognitive demand superimposed, especially at very low levels of contraction. Further, these effects in the elbow flexors were greater than previously observed for the ankle dorsiflexor muscles (Vanden Noven et al. 2014). Activation strategies of agonist muscles were likely involved in the age-related increase in force fluctuations during high cognitive demand. In addition, during low cognitive demand, older women were less steady than older men suggesting they are more likely to exhibit reduced force control when performing activities of daily living that require cognitive demand during steady motor tasks.
Abbreviations
- CV
Coefficient of variation
- High-CD
High-level cognitive demand
- Low-CD
Low-level cognitive demand
- MAP
Mean arterial pressure
- MVC
Maximal voluntary isometric contractions
- RMS
Root mean square
- STAI
State-trait anxiety inventory
- VAS
Visual analogue scale
Footnotes
Conflict of interest: none
Disclosure of Funding: This study was supported by a NIA R15AG039697 award to SKH and KAN. Fulbright program and CAPES foundation supported HMP.
References
- Al-Yahya E, Dawes H, Smith L, Dennis A, Howells K, Cockburn J. Cognitive motor interference while walking: a systematic review and meta-analysis. Neuroscience and biobehavioral reviews. 2011;35 (3):715–728. doi: 10.1016/j.neubiorev.2010.08.008. [DOI] [PubMed] [Google Scholar]
- Barry BK, Pascoe MA, Jesunathadas M, Enoka RM. Rate coding is compressed but variability is unaltered for motor units in a hand muscle of old adults. Journal of neurophysiology. 2007;97 (5):3206–3218. doi: 10.1152/jn.01280.2006. [DOI] [PubMed] [Google Scholar]
- Beurskens R, Bock O. Age-related deficits of dual-task walking: a review. Neural plasticity. 2012;2012:131608. doi: 10.1155/2012/131608. [DOI] [PMC free article] [PubMed] [Google Scholar]
- Brouwer B, Ashby P. Corticospinal projections to upper and lower limb spinal motoneurons in man. Electroencephalography and clinical neurophysiology. 1990;76 (6):509–519. doi: 10.1016/0013-4694(90)90002-2. [DOI] [PubMed] [Google Scholar]
- Brown RE, Edwards DL, Jakobi JM. Sex differences in force steadiness in three positions of the forearm. European journal of applied physiology. 2010;110 (6):1251–1257. doi: 10.1007/s00421-010-1600-x. [DOI] [PubMed] [Google Scholar]
- Brown SK. Staying Ahead of the Curve. Washington DC: The AARP Working Retirement Study; 2003. [Google Scholar]
- Burnett RA, Laidlaw DH, Enoka RM. Coactivation of the antagonist muscle does not covary with steadiness in old adults. J Appl Physiol. 2000;89 (1):61–71. doi: 10.1152/jappl.2000.89.1.61. [DOI] [PubMed] [Google Scholar]
- Chen R, Tam A, Butefisch C, Corwell B, Ziemann U, Rothwell JC, Cohen LG. Intracortical inhibition and facilitation in different representations of the human motor cortex. Journal of neurophysiology. 1998;80 (6):2870–2881. doi: 10.1152/jn.1998.80.6.2870. [DOI] [PubMed] [Google Scholar]
- Christou EA. Aging and variability of voluntary contractions. Exercise and sport sciences reviews. 2011;39 (2):77–84. doi: 10.1097/JES.0b013e31820b85ab. [DOI] [PMC free article] [PubMed] [Google Scholar]
- Christou EA, Jakobi JM, Critchlow A, Fleshner M, Enoka RM. The 1- to 2-Hz oscillations in muscle force are exacerbated by stress, especially in older adults. J Appl Physiol. 2004;97 (1):225–235. doi: 10.1152/japplphysiol.00066.2004. [DOI] [PubMed] [Google Scholar]
- Corp DT, Drury HG, Young K, Do M, Perkins T, Pearce AJ. Corticomotor responses to attentionally demanding motor performance: a mini-review. Frontiers in psychology. 2013;4 (165):1–5. doi: 10.3389/fpsyg.2013.00165. [DOI] [PMC free article] [PubMed] [Google Scholar]
- Enoka RM, Christou EA, Hunter SK, Kornatz KW, Semmler JG, Taylor AM, Tracy BL. Mechanisms that contribute to differences in motor performance between young and old adults. J Electromyogr Kinesiol. 2003;13 (1):1–12. doi: 10.1016/s1050-6411(02)00084-6. [DOI] [PubMed] [Google Scholar]
- Fox EJ, Baweja HS, Kim C, Kennedy DM, Vaillancourt DE, Christou EA. Modulation of force below 1 Hz: age-associated differences and the effect of magnified visual feedback. PloS one. 2013;8 (2):e55970. doi: 10.1371/journal.pone.0055970. [DOI] [PMC free article] [PubMed] [Google Scholar]
- Galganski ME, Fuglevand AJ, Enoka RM. Reduced control of motor output in a human hand muscle of elderly subjects during submaximal contractions. Journal of neurophysiology. 1993;69 (6):2108–2115. doi: 10.1152/jn.1993.69.6.2108. [DOI] [PubMed] [Google Scholar]
- Gerr F, Marcus M, Ensor C, Kleinbaum D, Cohen S, Edwards A, Gentry E, Ortiz DJ, Monteilh C. A prospective study of computer users: I. Study design and incidence of musculoskeletal symptoms and disorders. American journal of industrial medicine. 2002;41 (4):221–235. doi: 10.1002/ajim.10066. [DOI] [PubMed] [Google Scholar]
- Graves AE, Kornatz KW, Enoka RM. Older adults use a unique strategy to lift inertial loads with the elbow flexor muscles. Journal of neurophysiology. 2000;83 (4):2030–2039. doi: 10.1152/jn.2000.83.4.2030. [DOI] [PubMed] [Google Scholar]
- Heckman CJ, Enoka RM. Motor unit. Compr Physiol. 2013;2 (4):2629–2682. doi: 10.1002/cphy.c100087. [DOI] [PubMed] [Google Scholar]
- Henningsen H, Knecht S, Ende-Henningsen B. Influence of afferent feedback on isometric fine force resolution in humans. Experimental brain research Experimentelle Hirnforschung. 1997;113 (2):207–213. doi: 10.1007/BF02450319. [DOI] [PubMed] [Google Scholar]
- Hermens HJ, Freriks B, Disselhorst-Klug C, Rau G. Development of recommendations for SEMG sensors and sensor placement procedures. J Electromyogr Kinesiol. 2000;10(5):361–374. doi: 10.1016/s1050-6411(00)00027-4. S1050-6411(00)00027-4 [pii] [DOI] [PubMed] [Google Scholar]
- Hunter SK. Sex differences in human fatigability: mechanisms and insight to physiological responses. Acta physiologica (Oxford, England) 2014;210 (4):768–789. doi: 10.1111/apha.12234. [DOI] [PMC free article] [PubMed] [Google Scholar]
- Hunter SK, Todd G, Butler JE, Gandevia SC, Taylor JL. Recovery from supraspinal fatigue is slowed in old adults after fatiguing maximal isometric contractions. J Appl Physiol. 2008;105 (4):1199–1209. doi: 10.1152/japplphysiol.01246.2007. [DOI] [PubMed] [Google Scholar]
- Jensen C, Borg V, Finsen L, Hansen K, Juul-Kristensen B, Christensen H. Job demands, muscle activity and musculoskeletal symptoms in relation to work with the computer mouse. Scandinavian journal of work, environment & health. 1998;24 (5):418–424. [PubMed] [Google Scholar]
- Jesunathadas M, Klass M, Duchateau J, Enoka RM. Discharge properties of motor units during steady isometric contractions performed with the dorsiflexor muscles. J Appl Physiol. 2012;112 (11):1897–1905. doi: 10.1152/japplphysiol.01372.2011. [DOI] [PMC free article] [PubMed] [Google Scholar]
- Kajantie E, Phillips DI. The effects of sex and hormonal status on the physiological response to acute psychosocial stress. Psychoneuroendocrinology. 2006;31 (2):151–178. doi: 10.1016/j.psyneuen.2005.07.002. [DOI] [PubMed] [Google Scholar]
- Keller-Ross ML, Pereira HM, Pruse J, Yoon T, Schlinder-Delap B, Nielson KA, Hunter SK. Stress-induced increase in muscle fatigability of young men and women is predicted by strength but not voluntary activation. J Appl Physiol (1985) 2014;116 (7):767–778. doi: 10.1152/japplphysiol.01129.2013. [DOI] [PMC free article] [PubMed] [Google Scholar]
- Kornatz KW, Christou EA, Enoka RM. Practice reduces motor unit discharge variability in a hand muscle and improves manual dexterity in old adults. J Appl Physiol. 2005;98 (6):2072–2080. doi: 10.1152/japplphysiol.01149.2004. [DOI] [PubMed] [Google Scholar]
- Kriska AM, Bennett PH. An epidemiological perspective of the relationship between physical activity and NIDDM: from activity assessment to intervention. Diabetes/metabolism reviews. 1992;8 (4):355–372. doi: 10.1002/dmr.5610080404. [DOI] [PubMed] [Google Scholar]
- Kudielka BM, Kirschbaum C. Sex differences in HPA axis responses to stress: a review. Biological psychology. 2005;69 (1):113–132. doi: 10.1016/j.biopsycho.2004.11.009. [DOI] [PubMed] [Google Scholar]
- Laidlaw DH, Bilodeau M, Enoka RM. Steadiness is reduced and motor unit discharge is more variable in old adults. Muscle & nerve. 2000;23 (4):600–612. doi: 10.1002/(sici)1097-4598(200004)23:4<600::aid-mus20>3.0.co;2-d. [DOI] [PubMed] [Google Scholar]
- Meier JD, Aflalo TN, Kastner S, Graziano MS. Complex organization of human primary motor cortex: a high-resolution fMRI study. Journal of neurophysiology. 2008;100 (4):1800–1812. doi: 10.1152/jn.90531.2008. [DOI] [PMC free article] [PubMed] [Google Scholar]
- Negro F, Holobar A, Farina D. Fluctuations in isometric muscle force can be described by one linear projection of low-frequency components of motor unit discharge rates. The Journal of physiology. 2009;587 (Pt 24):5925–5938. doi: 10.1113/jphysiol.2009.178509. [DOI] [PMC free article] [PubMed] [Google Scholar]
- Ng AV, Callister R, Johnson DG, Seals DR. Sympathetic neural reactivity to stress does not increase with age in healthy humans. The American journal of physiology. 1994;267 (1 Pt 2):H344–353. doi: 10.1152/ajpheart.1994.267.1.H344. [DOI] [PubMed] [Google Scholar]
- Noteboom JT, Fleshner M, Enoka RM. Activation of the arousal response can impair performance on a simple motor task. J Appl Physiol. 2001;91 (2):821–831. doi: 10.1152/jappl.2001.91.2.821. [DOI] [PubMed] [Google Scholar]
- Peinemann A, Lehner C, Conrad B, Siebner HR. Age-related decrease in paired-pulse intracortical inhibition in the human primary motor cortex. Neuroscience letters. 2001;313 (1–2):33–36. doi: 10.1016/s0304-3940(01)02239-x. [DOI] [PubMed] [Google Scholar]
- Raz N, Lindenberger U, Rodrigue KM, Kennedy KM, Head D, Williamson A, Dahle C, Gerstorf D, Acker JD. Regional brain changes in aging healthy adults: general trends, individual differences and modifiers. Cereb Cortex. 2005;15 (11):1676–1689. doi: 10.1093/cercor/bhi044. [DOI] [PubMed] [Google Scholar]
- Rudroff T, Justice JN, Matthews S, Zuo R, Enoka RM. Muscle activity differs with load compliance during fatiguing contractions with the knee extensor muscles. Experimental brain research Experimentelle Hirnforschung. 2010;203 (2):307–316. doi: 10.1007/s00221-010-2233-3. [DOI] [PubMed] [Google Scholar]
- Sale MV, Semmler JG. Age-related differences in corticospinal control during functional isometric contractions in left and right hands. J Appl Physiol. 2005;99 (4):1483–1493. doi: 10.1152/japplphysiol.00371.2005. [DOI] [PubMed] [Google Scholar]
- Salthouse TA. When does age-related cognitive decline begin? Neurobiology of aging. 2009;30 (4):507–514. doi: 10.1016/j.neurobiolaging.2008.09.023. [DOI] [PMC free article] [PubMed] [Google Scholar]
- Schweizer S, Grahn J, Hampshire A, Mobbs D, Dalgleish T. Training the emotional brain: improving affective control through emotional working memory training. J Neurosci. 2013;33 (12):5301–5311. doi: 10.1523/JNEUROSCI.2593-12.2013. [DOI] [PMC free article] [PubMed] [Google Scholar]
- Seidler-Dobrin RD, Stelmach GE. Persistence in visual feedback control by the elderly. Experimental brain research Experimentelle Hirnforschung. 1998;119 (4):467–474. doi: 10.1007/s002210050362. [DOI] [PubMed] [Google Scholar]
- Spielberger CD, Gorsuch RL, Lushene PR, Vagg PR, Jacobs AG. State-Trait Anxiety Inventoy Manual. 1970. [Google Scholar]
- Stevens JS, Hamann S. Sex differences in brain activation to emotional stimuli: a meta-analysis of neuroimaging studies. Neuropsychologia. 2012;50 (7):1578–1593. doi: 10.1016/j.neuropsychologia.2012.03.011. [DOI] [PubMed] [Google Scholar]
- Takahara D, Inoue K, Hirata Y, Miyachi S, Nambu A, Takada M, Hoshi E. Multisynaptic projections from the ventrolateral prefrontal cortex to the dorsal premotor cortex in macaques - anatomical substrate for conditional visuomotor behavior. The European journal of neuroscience. 2012;36 (10):3365–3375. doi: 10.1111/j.1460-9568.2012.08251.x. [DOI] [PubMed] [Google Scholar]
- Taylor SE, Klein LC, Lewis BP, Gruenewald TL, Gurung RA, Updegraff JA. Biobehavioral responses to stress in females: tend-and-befriend, not fight-or-flight. Psychological review. 2000;107 (3):411–429. doi: 10.1037/0033-295x.107.3.411. [DOI] [PubMed] [Google Scholar]
- Toossi M. A century of change: The US Labor Force, 1950–2050. Monthly Labor Review. 2002:15–18. [Google Scholar]
- Tracy BL. Force control is impaired in the ankle plantarflexors of elderly adults. European journal of applied physiology. 2007;101 (5):629–636. doi: 10.1007/s00421-007-0538-0. [DOI] [PubMed] [Google Scholar]
- Tracy BL, Dinenno DV, Jorgensen B, Welsh SJ. Aging, visuomotor correction, and force fluctuations in large muscles. Medicine and science in sports and exercise. 2007a;39 (3):469–479. doi: 10.1249/mss.0b013e31802d3ad3. [DOI] [PubMed] [Google Scholar]
- Tracy BL, Enoka RM. Older adults are less steady during submaximal isometric contractions with the knee extensor muscles. J Appl Physiol. 2002;92 (3):1004–1012. doi: 10.1152/japplphysiol.00954.2001. [DOI] [PubMed] [Google Scholar]
- Tracy BL, Maluf KS, Stephenson JL, Hunter SK, Enoka RM. Variability of motor unit discharge and force fluctuations across a range of muscle forces in older adults. Muscle & nerve. 2005;32 (4):533–540. doi: 10.1002/mus.20392. [DOI] [PubMed] [Google Scholar]
- Tracy BL, Mehoudar PD, Ortega JD. The amplitude of force variability is correlated in the knee extensor and elbow flexor muscles. Experimental brain research Experimentelle Hirnforschung. 2007b;176 (3):448–464. doi: 10.1007/s00221-006-0631-3. [DOI] [PubMed] [Google Scholar]
- Vanden Noven ML, Pereira HM, Yoon T, Stevens AA, Nielson KA, Hunter SK. Motor Variability during Sustained Contractions Increases with Cognitive Demand in Older Adults. Frontiers in aging neuroscience. 2014;6:97. doi: 10.3389/fnagi.2014.00097. [DOI] [PMC free article] [PubMed] [Google Scholar]
- Voelcker-Rehage C, Stronge AJ, Alberts JL. Age-related differences in working memory and force control under dual-task conditions. Neuropsychology, development, and cognition. 2006;13 (3–4):366–384. doi: 10.1080/138255890969339. [DOI] [PubMed] [Google Scholar]
- WHO. Global health and ageing: brief report. 2011. [Google Scholar]
- Yoon T, Keller ML, De-Lap BS, Harkins A, Lepers R, Hunter SK. Sex differences in response to cognitive stress during a fatiguing contraction. J Appl Physiol. 2009;107 (5):1486–1496. doi: 10.1152/japplphysiol.00238.2009. [DOI] [PMC free article] [PubMed] [Google Scholar]
- Yoon T, Schlinder Delap B, Griffith EE, Hunter SK. Mechanisms of fatigue differ after low- and high-force fatiguing contractions in men and women. Muscle & nerve. 2007;36 (4):515–524. doi: 10.1002/mus.20844. [DOI] [PubMed] [Google Scholar]