Abstract
Purpose
The purpose of this study was to quantify the frequency and clinical severity of quality deficiencies in intensity-modulated radiotherapy (IMRT) planning on the RTOG0126 protocol.
Methods and Materials
219 IMRT patients from the high-dose arm (79.2Gy) of RTOG0126 were analyzed. To quantify plan quality, we used established knowledge-based methods for patient-specific DVH prediction of organs-at-risk and a Lyman-Kutcher-Burman (LKB) model for Grade ≥2 rectal complications to convert DVHs into normal tissue complication probabilities (NTCPs). The LKB model was validated by fitting dose-response parameters against observed toxicities. The 90th-percentile (22/219) of plans with the lowest excess risk (difference between clinical and model-predicted NTCP) were used to create a model for the presumed best practices in the protocol (pDVH0126,top10%). Applying the resultant model to the entire sample enabled comparisons between DVHs that patients could have received to DVHs they actually received. Excess risk quantified the clinical impact of sub-optimal planning. Accuracy of pDVH predictions was validated by re-planning 30/219 (13.7%) patients, including equal numbers of presumed “high-quality”, “low-quality”, and randomly-sampled plans. NTCP-predicted toxicities were compared to adverse events on protocol.
Results
Existing models showed that bladder sparing variations were less prevalent than rectum quality variations, and increased rectal sparing was not correlated with target metrics (D98%,D2%). Observed toxicities were consistent with current LKB parameters. Converting DVH and pDVH0126,top10% to rectal NTCP, we observed 94/219 (42.9%) with ≥5% excess risk, 20/219 (9.1%) with ≥10% excess risk, and 2/219 (0.9%) with ≥15% excess risk. Re-planning demonstrated the predicted NTCP reductions while maintaining target V100%. An equivalent sample of high-quality plans showed fewer toxicities than low-quality plans, 6/73 vs. 10/73 respectively, though these differences were not significant (p=0.21) due to insufficient statistical power in this retrospective study.
Conclusions
Plan quality deficiencies in RTOG0126 exposed patients to substantial excess risk for rectal complications.
I. Introduction
Though intensity-modulated radiotherapy (IMRT) has become the standard treatment for several cancers, single-institution1, 2 and single-dataset3 plan quality investigations have shown that patients who should have had low risk OAR DVHs were at considerably higher risk due to sub-optimal planning. Further, several studies on large-scale clinical trials found that non-adherence to protocol guidelines is correlated with worsened outcome4-8. Recent work has focused on developing models trained from prior patients to predict achievable organ-at-risk (OAR) DVHs for individual patients9, 10. These methods assist clinicians by identifying suboptimal treatment plans as those where DVHs deviate greatly from model predictions. As these estimations are available for new patients based on their individual anatomy, this quality control (QC) mechanism can also form the basis for automated treatment planning9, 11, 12.
The full clinical impact of sub-optimal planning is, as yet, unknown. The purpose of this work is to combine model-based treatment plan QC with a multi-institutional clinical trial to assess the frequency and clinical severity of sub-optimal treatment planning on a large scale. NRG Oncology's Radiation Therapy Oncology Group (RTOG) 0126 protocol, A Phase III Randomized Study of High Dose 3DCRT/IMRT versus Standard Dose 3DCRT/IMRT in Patients Treated for Localized Prostate Cancer 13, 14, was selected to study treatment plan quality variations. With accrual of 1532 patients from 88 participating institutions, RTOG0126 ran from 10/2004-03/2010, with the final trial results recently presented15. This work focused on high-dose IMRT patients, with 219 fitting the inclusion criteria. To our knowledge, this represents both the largest and most institutionally-diverse IMRT plan quality survey to date. While this study can only draw conclusions on the analyzed plans, by extension the observed quality variations in RTOG0126 give insight into the need for enacting QC measures on other multi- institutional radiotherapy trials, as well as the importance of eliminating sub-optimal planning in the wider practice of radiotherapy.
II. Methods and Materials
i. Patient Data
226 IMRT patients were available for analysis on the RTOG0126 high-dose arm (79.2Gy in 44 fractions). CTV was defined as prostate+proximal seminal vesicles; PTV margins were 5-10mm13, 14. Because of known negative correlations between target coverage and organ-at-risk (OAR) sparing, six outliers with respect to PTV coverage were censored with a threshold of D98≥95%: D98=[84.0%;88.4%;93.0%;93.1%;93.4%;94.9%]. One case (D98=88.4%) underdosed the PTV protecting the penile bulb, the remaining cases protected the rectum. One additional patient was censored because a hip prosthesis necessitated nonstandard beam angles. Thus, 219 patients were used for this study.
ii. Predictive DVH Program
Following Ref. [9], we used a model-based QC paradigm that predicts achievable DVHs based on statistical analysis of previously-treated patients. Briefly, this methodology quantifies the correlation between dose in an OAR voxel and its geometric relationship to the PTV. The primary geometric quantity of interest is the boundary distance, defined as the distance between an OAR voxel and the closest voxel on the PTV. OAR sub-volumes, defined as voxels that share a range of boundary distances, represent finite volumes with their own differential DVHs. The sub-volume DVHs of prior plans comprise a training cohort, subsequently fit by a three parameter skew-normal distribution. The parameter evolution feeds the model's DVH predictions for individual sub-volumes; summation over all sub-volumes yields full DVH prediction (pDVH) based on the quantitative experience of the training cohort.
iii. “Best practices” determination with pDVH models
An existing prostate pDVH model was used to evaluate rectal and bladder sparing in the RTOG0126 cohort. This pDVH model was trained from 20 high-quality prostate plans, culled from a random sample of 100 patients treated at UC San Diego, with selection criteria being maximal OAR sparing; PTV coverage was consistently set at V100%≥97%. Training plans were treated in the 2008-2012 timeframe using 7-field technique, 15MV photons, DMLC delivery, and optimization in Eclipse (Varian Medical Systems, Palo Alto,CA). All would satisfy the RTOG0126 protocol constraints, though we note for completeness that standard PTV margins (3mm posterior, 7mm elsewhere) were different than those used in the RTOG0126 sample (minimum 5mm around CTV); ultimately, these margin differences make no difference to the results of this study because this cohort is used only for initial quality stratification.
The existing pDVH model was used to (a) initially assess quality variations in the OARs and (b) locate presumed high-quality plans for “best practices” model training. DVH cutpoints at V40, V65, and V75 assessed intermediate, high, and near-prescription doses for bladder and rectum16, 17. As described in the Results, highest quality plans were found to be those that maximally spared the rectum. To ensure that PTV metrics were not unduly sacrificed, Pearson's correlation coefficients (r) were computed between PTV D98%,D2% and rectum ΔV75 = DVH(75 Gy) − pDVH (75 Gy) to determine whether achieving predicted rectal sparing was correlated with compromise of target coverage and/or heterogeneity.
iv. Excess risk quantification
Normal tissue complication probability (NTCP) models provide quantification of the hazard posed by particular DVHs. The well-established Lyman-Kutcher-Burman (LKB) model is commonly cast with the effective dose to the whole organ calculated as
| (1) |
where Di is the dose to the differential volume vi for the ith dose bin, . The parameter n describes the volume effect. Complication probability is thus
| (2) |
where
| (3) |
TD50 is the dose at which 50% are predicted to develop complications, and m describes the steepness of the dose-response curve. For Grade 2+ rectal toxicities, QUANTEC recommendations for LKB parameters were {TD50 = 76.9Gy; m = 0.13; n = 0.09}18. The excess risk posed by clinical DVHs over pDVH predictions is NTCP(DVH) – NTCP(pDVH).
The presumed highest-quality plans were identified as those plans with the smallest excess risk over the NTCP predicted by our Institutional pDVH models. The 10% (22/219) of plans with the smallest NTCP(DVH) – NTCP(pDVHUCSD) were used to train a new model, pDVH0126,top10%. The resultant pDVH0126,top10% model represents attainable DVHs according protocol best practices. By applying the pDVH0126,top10% model to the entire cohort, we are benchmarking all plans against the presumed 90th percentile of plan quality on RTOG0126. This approach yields the primary objective of this analysis: quantifying the excess complication risk to which patients were exposed due to sub-optimal IMRT planning. Wilcoxon rank-sum test compared excess risk quantification between groups of NTCP(pDVH0126,top10%) to assess any correlations of plan quality with the degree of predicted risk.
v. Validation #1 – Comparing NTCP model against observed late rectal toxicities
QUANTEC cautions against naïvely extending NTCP models based on 3D-CRT data to IMRT18. The first stage of validation involves confirming that the QUANTEC LKB model is consistent with toxicities in the protocol sample. The QUANTEC LKB parameters TD50 and m were re-fit using the 219-patient sample. The best-fitting values were obtained using maximum likelihood analysis19, 95% confidence intervals were calculated using profile likelihood method, and χ2/degree-of-freedom goodness-of-fit were used to compare dose-response curves.
vi. Validation #2 – Re-planning study to confirm model predictions for rectal sparing and NTCPs
Definitive validation of pDVH predictions can only be accomplished by direct re-planning. For samples of this size it is not practical to manually re-plan every patient, so a subset was selected for re-plan validation. Using the pDVH0126,top10% model, we selected the 10 presumed “high-quality” plans (lowest excess risk), the 10 presumed “low-quality” plans (highest excess risk), and 10 plans selected at random, collectively representing 13.7%(30/219) of the cohort.
All re-plans employed seven static fields, 15MV photons, and were optimized in a commercial planning system (Varian Eclipse v10). Re-planning guidelines were:
Maintain PTV volume receiving prescription dose (V100%)
PTV high dose not to exceed minor deviation levels (D2%<110%)
Bladder DVH maintained/improved
With pDVH0126,top10% as guidance, improve rectal sparing as much as possible
In addition to comparisons between clinical DVHs, re-plan DVHs, and pDVHs, the 30 re-plans’ rectal NTCPs were compared to model-predicted NTCPs to validate excess risk predictions.
vii. Validation #3 – Effect of sub-optimal planning on observed toxicities
The excess risk gives the means to compare outcomes between patients who received sub-optimal plans to those who received superior IMRT. However, a complicating factor emerged in that patients with larger predicted NTCP generally had lower excess risk, so simply grouping the sample into high and low excess risk categories does not yield statistically equivalent samples in terms of exposed NTCP. Thus, each patient was classified into one of four categories: LL=low predicted NTCP, low excess risk; LH=low predicted NTCP, high excess risk; HL=high predicted NTCP, low excess risk; HH=high predicted NTCP, high excess risk. The number of patients in each respective grouping is NLL, NLH, NHL, NHH; the number of toxicity events in each group is ELL, ELH, EHL, EHH.
Irrespective of low/high thresholds for predicted NTCP and excess risk, it was found that very few patients could be reasonably categorized in the HH group. Thus, the respective low/high thresholds were set by attempting to equalize the populations NLL=NLH=(NHL+NHH). Given the inequality between NHL and NHH it was not possible to compare outcomes in the high absolute risk group, but as NLL=NLH the observed toxicities in the sub-optimal group (ELH/NLH) can be compared against a roughly equivalent group with higher quality plans (ELL/NLL). One-sided Fisher's Exact Test was used to assess whether LH and LL stratification yielded statistically significant differences in outcomes. The LKB model also allowed a comparison of the observed toxicities in each category to the predicted rate from the expectation value .
III. Results
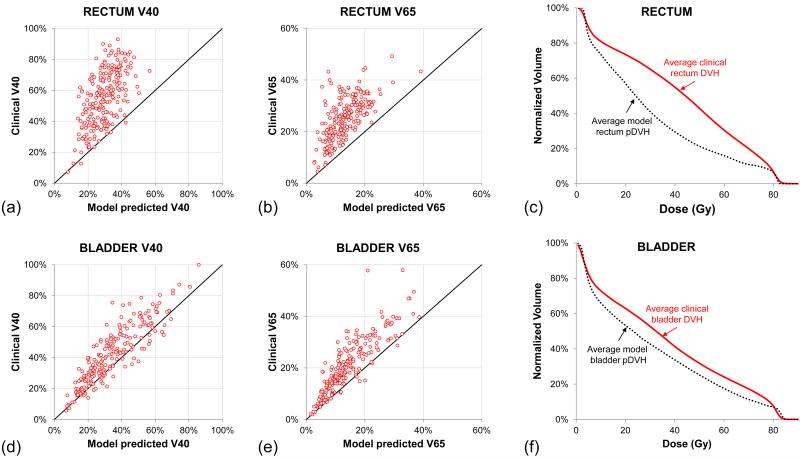
Applying existing pDVH models to the RTOG0126 cohort showed that a clear majority of plans gave excess dose to the rectum, as seen in scatter plots of V40 and V65 for clinical DVHs and Institutional pDVHs (Fig.1a-b). Averaging over all rectum DVHs and pDVHs (Fig.1c) shows the degree to which rectal sparing was unrealized in the clinical sample. Comparing V40 and V65 cutpoints for the bladder DVHs and pDVHs (Fig.1d-e) exhibited less dramatic overdosing than the rectum, and comparison of the average bladder DVH and pDVH (Fig.1f) similarly showed much less disagreement. The better concordance between DVHs and pDVHs in the bladder could be due to better planning for this organ or, perhaps as likely, that bladder DVHs are simply less sensitive than the rectum to plan quality deficiencies. Given this, as well as the challenges in converting bladder DVHs to urinary complications20, rectal sparing was focused upon as the primary quality marker.
Fig.1.
Rectum and bladder DVHs compared to UC San Diego model-predicted pDVHs. Scatter plots of specific rectum DVH points (a)V40 and (b)V65 show that the large majority of treatment plans are delivering more rectal dose than needed. (c)Averaging across the 219-patient sample shows the spread between clinical rectum DVHs and pDVHs. Scatter plots of (d)V40 and (e)V65 in the bladder, as well as the (f)average bladder DVH and pDVH demonstrate greater agreement between clinical DVHs and bladder pDVHs.
To ascertain whether increased rectal sparing was detrimental to PTV quality measures, the protocol-specified metrics D98% and D2% were compared to ΔV75 = DVH(75 Gy) − pDVH(75 Gy) . There was no correlation for either variable, with r=0.11 for D98% and ΔV75 and r=-0.12 for D2% and ΔV75, implying that achieving the pDVH-predicted rectal sparing would not have affected the target metrics.
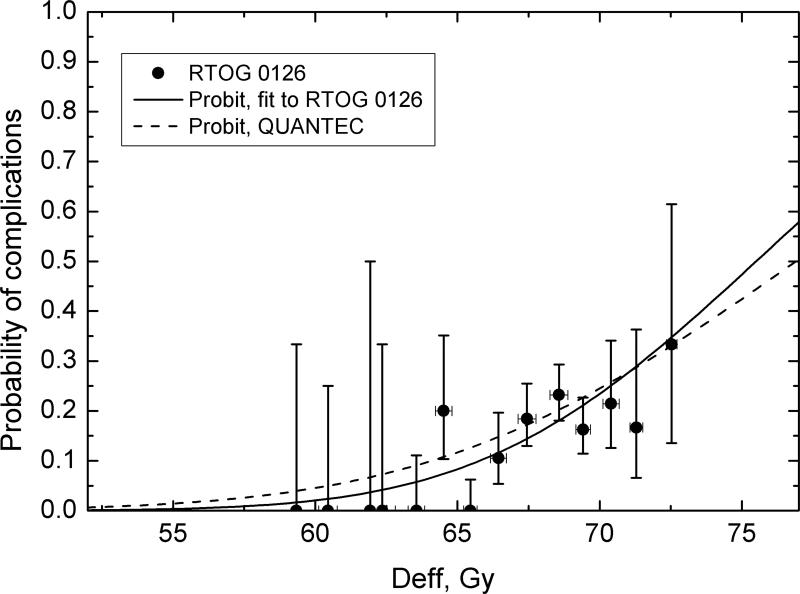
The LKB model parameters obtained for the protocol toxicity data were TD50= 75.5(72.1,100.8)Gy and m=0.10(0.06,0.33), with χ2/d=0.974 and logML=-94.72. Fig.2 shows late rectal toxicities in the sample, the dose-response curve obtained as fit to the trial data, and the QUANTEC-recommended dose-response curve. Parameter values obtained for the RTOG0126 data are in excellent agreement with QUANTEC values of TD50=76.9Gy and m=0.13. Calculating the QUANTEC dose-response on the sample yields χ2/d=0.87 and logML=-95.29, virtually equivalent to directly fitting the data, so the QUANTEC-recommended model parameters were deemed suitable for this study.
Fig.2.
Validation of QUANTEC LKB NTCP model. Observed Gr2+ late GI toxicities agree with predictions based on QUANTEC18 recommended LKB parameters (dotted line). Dose-response curve obtained with parameters fitted to RTOG0126 data is shown for comparison (solid line). Vertical error bars are 68% binomial confidence intervals, error bars on effective dose values are standard deviations.
After generating the pDVH0126,top10% model from the identified 90th percentile plans, using the pDVH0126,top10% model to pick out the top 10% in the overall cohort resulted in 20 out of 22 plans in common. We thus conclude that the impact of the UCSD model used to initially filter the RTOG0126 cohort had little to no impact on the final results.
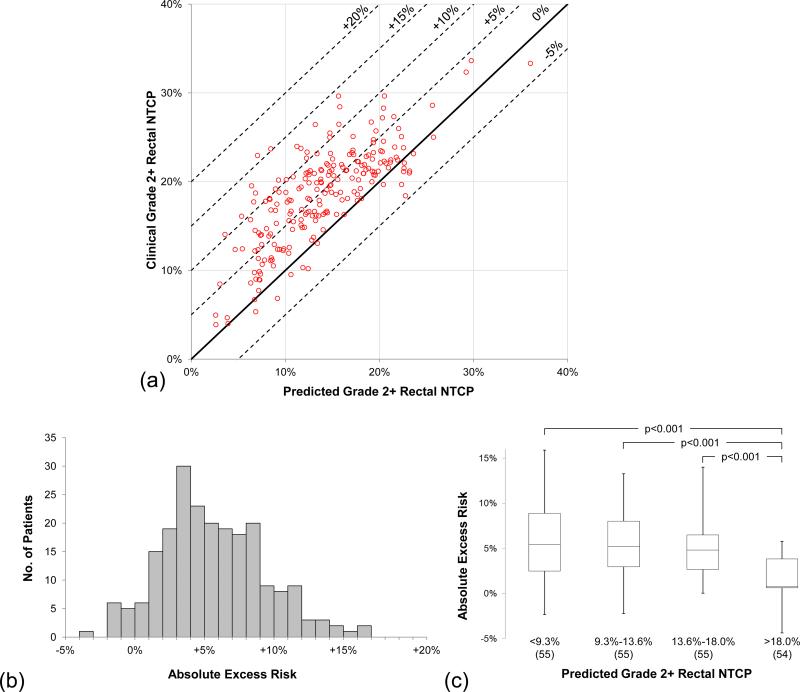
Using the pDVH0126,top10% model and the QUANTEC LKB model for Grade 2+ rectal complications, Fig.3a shows each patient's clinical complication probability NTCP(DVHrect) set against the model-predicted NTCP(pDVH0126,top10%). The bands of excess risk show the large population of patients that reside in the positive excess risk region. 94/219(42.9%) received ≥5% excess risk, 20/219(9.1%) received ≥10% excess risk, and 2/219(0.9%) received ≥15% excess risk. The data below 0% excess risk represent patients whose plans bettered the NTCP(pDVH0126,top10%) prediction by reducing high doses in rectum. Fig.3b depicts the same data as a histogram, with the entire cohort exhibiting a mean excess risk of 4.7% ± 3.9%. Grouping the patients in quartiles of predicted risk, Fig.3c shows that patients most at risk for rectal complications NTCP(pDVH0126,top10%) < 18.0% showed a statistically significant difference (p<0.001) in absolute excess risk distribution when compared to the other quartiles, suggesting that planners delivered better results when patient anatomy confounded meeting protocol requirements for rectal sparing.
Fig.3.
Absolute excess risk due to sub-optimal planning. (a)Scatter plot shows NTCP(pDVH0126,top10%) vs. the treated plans’ NTCP. Solid line represents 0% excess risk (model and observed NTCP identical), and dotted lines denote excess risk thresholds in 5% increments. (b)Frequency histogram exhibits a mean excess risk of 4.7% ± 3.9%. (c)Box-and-whisker plots show excess risk distributions in quartiles of predicted NTCP. Using Wilcoxon rank-sum test, the fourth quartile NTCP(pDVH0126,top10%) > 18.0% was highly significant (p<0.001) when compared to the other quartile distributions; no other quartile comparisons were statistically significant (p>0.05).
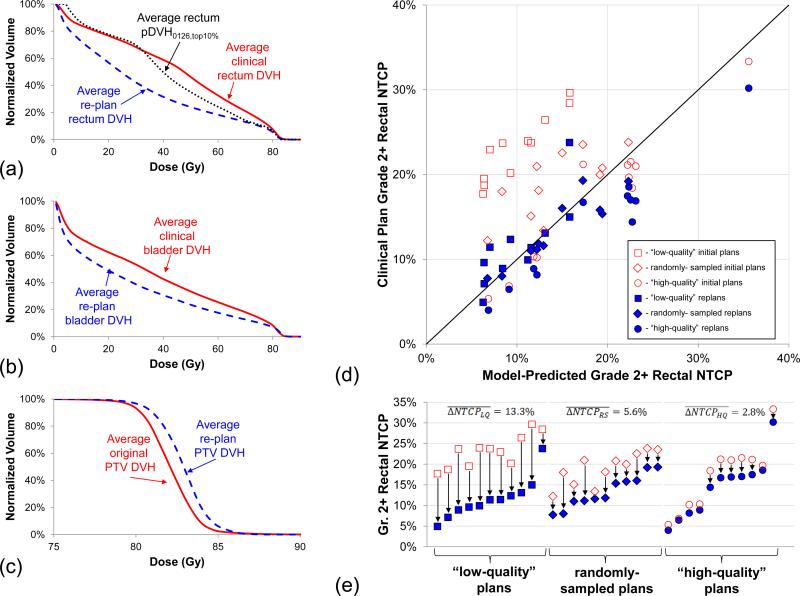
To confirm pDVH0126,top10% predictions, a 30-patient validation sample was re-planned according to the guidelines in Section II.iv. Fig.4a-c show the average rectum, bladder, and PTV DVHs before and after re-planning. All rectum and bladder DVHs were improved, and the predicted rectal sparing was attainable in all but one instance due to above-average PTV coverage. On average the PTV heterogeneity was increased, though all D2% values were held within minor deviation of protocol specifications.
Fig.4.
Re-planning validation of pDVH predictions. (a)Average rectum DVHs from the 30-patient re-planning sample shows that pDVH0126,top10% predictions were not only possible but could be further improved. (b)Re-plan bladder DVHs were also significantly improved. (c)Holding PTV V100% fixed, average re-plan PTV DVH exhibited more heterogeneity than the clinical DVHs as the cost of OAR dose reductions. (d)Rectal NTCP scatter plot shows model-predicted NTCP vs. the original plans’ NTCP, which included 10 “high-quality” protocol plans (circles), 10 “low-quality” protocol plans (squares), and 10 randomly-sampled protocol plans (diamonds), with clear gains in the re-plans (closed markers) over clinically-delivered plans (open markers). (e)Comparing quality groups, average NTCP reductions were greatest in the “low-quality” plans.
Fig.4d-e show the NTCP comparison of the clinical plans and re-plans against the model-predicted NTCP(pDVH0126,top10%). NTCP reductions under re-planning were observed in all groups: the “high-quality” cohort showed , the randomly-sampled cohort showed , and the “low-quality” cohort showed .
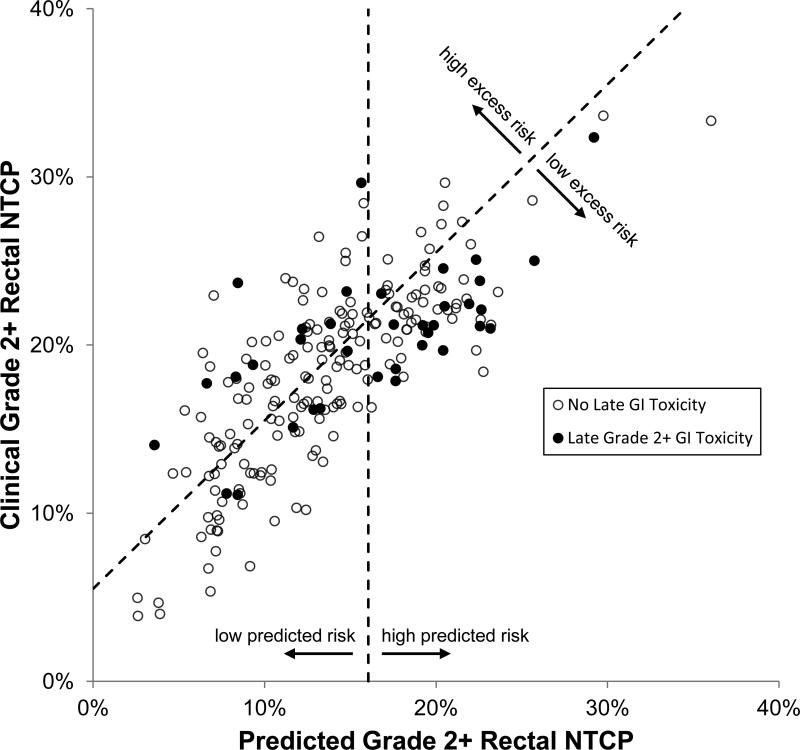
Stratification by absolute predicted risk (16.5% threshold) and excess risk (+5.5% threshold) yielded equal populations in absolute/excess risk grouping: NLL=73, NLH=73, (NHL+NHH)=73. Fig.5 depicts this excess risk stratification, as well as identifying the patients that experienced grade 2+ late rectal toxicities. Fewer toxicities were observed in the LL category (ELL/NLL=6/73) than in LH (ELH/NLH=10/73). In the high absolute risk groups, toxicities were EHL/NHL=19/61 and EHH/NHH=1/12. These were all in line with expectation values: 〈ELL/NLL〉 = 9/73, 〈ELH/NLH〉 = 14/73, 〈EHL/NHL〉 = 14/61, 〈EHH/NHH〉 = 3/12. The key comparison of ELL/NLL=6/73 vs. ELH/NLH=10/73 exhibited the expected lower toxicity rate, though these differences were not statistically significant (p=0.21). While this level of statistical significance is insufficient to support the claim that worse planning led to worsened outcome, the lack of power in the sample was not unexpected given NTCP predictions for toxicity rates (〈ELL/NLL〉 = 9/73 and 〈ELH/NLH〉 = 14/73 yield p=0.18).
Fig.5.
Observed toxicities with absolute (16.5%) and excess risk (+5.5%) boundaries stratifying LL (lower left region), LH (upper left region), HL (upper right region), and HH (lower right region).
IV. Discussion
The results of this study demonstrate that poor quality IMRT planning frequently put RTOG0126 patients at substantial and unnecessary risk of late rectal toxicities. The strengths of this study are two-fold. First, the frequency of sub-optimal IMRT planning has been quantified on a large diverse sample, most notably in that 42.9% of these patients were exposed >5% excess risk of late rectal complications. Second, the quantified excess risks were directly demonstrated to be unnecessary, as the validated LKB model quantified the potential risk reductions and the re-planning study demonstrated the achievability of this reduction.
The characterization of +4.7% average excess risk as “substantial” requires context, to which two key points of comparison are available from Michalski et al14. On the high-dose arm of RTOG0126, at 3 years, patients treated with 3D-CRT had a 22.0% cumulative incidence of Grade 2+ GI toxicity while IMRT patients had only 15.1% cumulative incidence (p=0.039). A 4.7% risk reduction in the IMRT group rate might have cut the incidence by nearly a third. Further, the predicted 4.7% risk reduction is on par with the toxicity rate difference between 3D-CRT and IMRT of 22.0%-15.1%=7.1%, implying that quality-controlled IMRT planning offers nearly as much clinical benefit as uncontrolled IMRT planning offered over 3D-CRT.
One obvious limitation of the current study is the insufficient statistical power to make the even stronger claim that sub-optimal planning directly compromises patient outcomes. Even with 219 patients, this study was not powered to state this conclusively because late rectal complications were still relatively infrequent.
While several studies in recent years have examined patient-specific assessments of IMRT treatment plan quality1, 2, 9, 11, 12, 21-23, this study enters the literature as the largest and most institutionally-diverse study of IMRT plan quality to date. This also adds to the larger body of work that has examined the negative effect of protocol deviations on clinical trials4-8. Notably, many of the plans in this study did meet RTOG0126 protocol constraints for the rectum but were flagged as “low quality” because there was much greater rectal sparing achievable at no cost. In this we can highlight the need for clinical trial compliance parameters that are patient-specific with respect to organ-at-risk dosimetry. As quantitative plan QC tools become more widely available they could be explicitly incorporated into the quality assurance framework of cooperative group trials, but to the authors’ knowledge this has not yet occurred.
Regarding the implications for the radiotherapy community at large, we consider it likely this study is representative of the plan quality variations in the general population over the same time period. Given the types of institutions that participate in national trials and the efforts expended to meet protocol requirements, it is plausible that the plan quality variations in this work actually underestimate the variability in wider clinical practice. As prostate IMRT is considered one of the easier sites to plan, the observed quality variations in this study hint, troublingly, at potentially larger variations in sites where the spread between the prescription dose and organ tolerances is even wider, e.g. the parotid glands in head-and-neck cancer1.
Summary.
IMRT prostate plans from RTOG0126 were analyzed with knowledge-based DVH prediction to quantify clinical effect of plan quality deficiencies. Focusing on Grade 2+ late rectal toxicities with an outcomes-validated LKB model, comparisons between rectal and model-predicted DVHs yielded absolute excess risk from sub-optimal planning: 94/219 (42.9%) had ≥5% excess risk, 20/219 (9.1%) had ≥10% excess risk, and 2/219 (0.9%) had ≥15% excess risk.
Acknowledgements
This project was supported by RTOG grant U10 CA21661, and ATC grant U24 CA81647 from the National Cancer Institute (NCI). R. Schmidt acknowledges support from AAPM Undergraduate Research Fellowship. This manuscript's contents are solely the responsibility of the authors and do not necessarily represent the official views of the National Cancer Institute.
Footnotes
Publisher's Disclaimer: This is a PDF file of an unedited manuscript that has been accepted for publication. As a service to our customers we are providing this early version of the manuscript. The manuscript will undergo copyediting, typesetting, and review of the resulting proof before it is published in its final citable form. Please note that during the production process errors may be discovered which could affect the content, and all legal disclaimers that apply to the journal pertain.
Conflict of interest:
Kevin Moore – Research grant, consulting, and licensing agreement with Varian Medical Systems.
Lindsey Olsen – Research grant, consulting, and licensing agreement with Varian Medical Systems.
Sasa Mutic – Research grant, consulting, and licensing agreement with Varian Medical Systems; Ownership - Radialogica, LLC; Licensing agreement - Modus Medical.
References
- 1.Moore KL, Brame RS, Low DA, Mutic S. Experience-based quality control of clinical intensity-modulated radiotherapy planning. Int J Radiat Oncol Biol Phys. 2011;81:545–551. doi: 10.1016/j.ijrobp.2010.11.030. [DOI] [PubMed] [Google Scholar]
- 2.Wu B, Ricchetti F, Sanguineti G, Kazhdan M, Simari P, Chuang M, Taylor R, Jacques R, McNutt T. Patient geometry-driven information retrieval for IMRT treatment plan quality control. Med Phys. 2009;36:5497–5505. doi: 10.1118/1.3253464. [DOI] [PubMed] [Google Scholar]
- 3.Nelms BE, Robinson G, Markham J, Velasco K, Boyd S, Narayan S, Wheeler J, Sobczak ML. Variation in external beam treatment plan quality: An inter-institutional study of planners and planning systems. Practical Radiation Oncology. 2012;2:296–305. doi: 10.1016/j.prro.2011.11.012. [DOI] [PubMed] [Google Scholar]
- 4.Peters LJ, O'Sullivan B, Giralt J, Fitzgerald TJ, Trotti A, Bernier J, Bourhis J, Yuen K, Fisher R, Rischin D. Critical impact of radiotherapy protocol compliance and quality in the treatment of advanced head and neck cancer: results from TROG 02.02. Journal of clinical oncology. 2010;28:2996–3001. doi: 10.1200/JCO.2009.27.4498. [DOI] [PubMed] [Google Scholar]
- 5.Fitzgerald TJ. What We Have Learned: The Impact of Quality From a Clinical Trials Perspective. Seminars in Radiation Oncology. 2012;22:18–28. doi: 10.1016/j.semradonc.2011.09.004. [DOI] [PMC free article] [PubMed] [Google Scholar]
- 6.Abrams RA, Winter KA, Regine WF, Safran H, Hoffman JP, Lustig R, Konski AA, Benson AB, Macdonald JS, Rich TA. Failure to adhere to protocol specified radiation therapy guidelines was associated with decreased survival in RTOG 9704—a phase III trial of adjuvant chemotherapy and chemoradiotherapy for patients with resected adenocarcinoma of the pancreas. International Journal of Radiation Oncology* Biology* Physics. 2012;82:809–816. doi: 10.1016/j.ijrobp.2010.11.039. [DOI] [PMC free article] [PubMed] [Google Scholar]
- 7.Fairchild A, Straube W, Laurie F, Followill D. Does quality of radiation therapy predict outcomes of multicenter cooperative group trials? A literature review. International Journal of Radiation Oncology* Biology* Physics. 2013;87:246–260. doi: 10.1016/j.ijrobp.2013.03.036. [DOI] [PMC free article] [PubMed] [Google Scholar]
- 8.Ohri N, Shen X, Dicker AP, Doyle LA, Harrison AS, Showalter TN. Radiotherapy protocol deviations and clinical outcomes: a meta-analysis of cooperative group clinical trials. Journal of the National Cancer Institute. 2013:djt001. doi: 10.1093/jnci/djt001. [DOI] [PMC free article] [PubMed] [Google Scholar]
- 9.Appenzoller LM, Michalski JM, Thorstad WL, Mutic S, Moore KL. Predicting dose-volume histograms for organs-at-risk in IMRT planning. Medical physics. 2012;39:7446. doi: 10.1118/1.4761864. [DOI] [PubMed] [Google Scholar]
- 10.Zhu X, Ge Y, Li T, Thongphiew D, Yin FF, Wu QJ. A planning quality evaluation tool for prostate adaptive IMRT based on machine learning. Med Phys. 2011;38:719–726. doi: 10.1118/1.3539749. [DOI] [PubMed] [Google Scholar]
- 11.Wu B, Ricchetti F, Sanguineti G, Kazhdan M, Simari P, Jacques R, Taylor R, McNutt T. Data-Driven Approach to Generating Achievable Dose–Volume Histogram Objectives in Intensity-Modulated Radiotherapy Planning. International Journal of Radiation Oncology*Biology*Physics. 2011;79:1241–1247. doi: 10.1016/j.ijrobp.2010.05.026. [DOI] [PubMed] [Google Scholar]
- 12.Wu B, McNutt T, Zahurak M, Simari P, Pang D, Taylor R, Sanguineti G. Fully Automated Simultaneous Integrated Boosted–Intensity Modulated Radiation Therapy Treatment Planning Is Feasible for Head-and-Neck Cancer: A Prospective Clinical Study. International Journal of Radiation Oncology* Biology* Physics. 2012;84:e647–e653. doi: 10.1016/j.ijrobp.2012.06.047. [DOI] [PubMed] [Google Scholar]
- 13.RTOG 0126 - A Phase III Randomized Study of High Dose 3DCRT/IMRT versus Standard Dose 3DCRT/IMRT in Patients Treated for Localized Prostate Cancer.
- 14.Michalski JM, Yan Y, Watkins-Bruner D, Bosch WR, Winter K, Galvin JM, Bahary J-P, Morton GC, Parliament MB, Sandler HM. Preliminary Toxicity Analysis of 3-Dimensional Conformal Radiation Therapy Versus Intensity Modulated Radiation Therapy on the High-Dose Arm of the Radiation Therapy Oncology Group 0126 Prostate Cancer Trial. International Journal of Radiation Oncology* Biology* Physics. 2013;87:932–938. doi: 10.1016/j.ijrobp.2013.07.041. [DOI] [PMC free article] [PubMed] [Google Scholar]
- 15.Michalski J.e.a. presented at the Plenary Session, American Society for Radiation Oncology Annual Meeting; San Francisco. 2014; (unpublished) [Google Scholar]
- 16.Tucker SL, Dong L, Michalski JM, Bosch WR, Winter K, Cox JD, Purdy JA, Mohan R. Do intermediate radiation doses contribute to late rectal toxicity? An analysis of data from radiation therapy oncology group protocol 94-06. International Journal of Radiation Oncology* Biology* Physics. 2012;84:390–395. doi: 10.1016/j.ijrobp.2011.11.073. [DOI] [PMC free article] [PubMed] [Google Scholar]
- 17.Fellin G, Rancati T, Fiorino C, Vavassori V, Antognoni P, Baccolini M, Bianchi C, Cagna E, Borca VC, Girelli G. Long term rectal function after high-dose prostatecancer radiotherapy: Results from a prospective cohort study. Radiotherapy and Oncology. 2014;110:272–277. doi: 10.1016/j.radonc.2013.09.028. [DOI] [PubMed] [Google Scholar]
- 18.Michalski JM, Gay H, Jackson A, Tucker SL, Deasy JO. Radiation Dose-Volume Effects in Radiation-Induced Rectal Injury. Int J Radiat Oncol Biol Phys. 2010;76:S123–S129. doi: 10.1016/j.ijrobp.2009.03.078. [DOI] [PMC free article] [PubMed] [Google Scholar]
- 19.Roberts SA, Hendry JH. The delay before onset of accelerated tumour cell repopulation during radiotherapy: a direct maximum-likelihood analysis of a collection of worldwide tumour-control data. Radiotherapy and Oncology. 1993;29:69–74. doi: 10.1016/0167-8140(93)90175-8. [DOI] [PubMed] [Google Scholar]
- 20.Viswanathan AN, Yorke ED, Marks LB, Eifel PJ, Shipley WU. Radiation dose–volume effects of the urinary bladder. International Journal of Radiation Oncology* Biology* Physics. 2010;76:S116–S122. doi: 10.1016/j.ijrobp.2009.02.090. [DOI] [PMC free article] [PubMed] [Google Scholar]
- 21.Petit SF, Wu B, Kazhdan M, Dekker A, Simari P, Kumar R, Taylor R, Herman JM, McNutt T. Increased organ sparing using shape-based treatment plan optimization for intensity modulated radiation therapy of pancreatic adenocarcinoma. Radiotherapy and Oncology. 2012;102:38–44. doi: 10.1016/j.radonc.2011.05.025. [DOI] [PMC free article] [PubMed] [Google Scholar]
- 22.Zhu X, Ge Y, Li T, Thongphiew D, Yin F-F, Wu QJ. A planning quality evaluation tool for prostate adaptive IMRT based on machine learning. Medical Physics. 2011;38:719–726. doi: 10.1118/1.3539749. [DOI] [PubMed] [Google Scholar]
- 23.Yuan L, Ge Y, Lee WR, Yin FF, Kirkpatrick JP, Wu QJ. Quantitative analysis of the factors which affect the interpatient organ-at-risk dose sparing variation in IMRT plans. Medical physics. 2012;39:6868–6878. doi: 10.1118/1.4757927. [DOI] [PubMed] [Google Scholar]


