

Abstract
Structure based virtual screening has largely been limited to protein targets for which either an experimental structure is available or a strongly homologous template exists so that a high-resolution model can be constructed. The performance of state of the art protein structure predictions in virtual screening in systems where only weakly homologous templates are available is largely untested. Using the challenging DUD database of structural decoys, we show here that even using templates with only weak sequence homology (<30% sequence identity) structural models can be constructed by I-TASSER which achieve comparable enrichment rates to using the experimental bound crystal structure in the majority of the cases studied. For 65% of the targets, the I-TASSER models, which are constructed essentially in the apo conformations, reached 70% of the virtual screening performance of using the holo-crystal structures. A correlation was observed between the success of I-TASSER in modeling the global fold and local structures in the binding pockets of the proteins versus the relative success in virtual screening. The virtual screening performance can be further improved by the recognition of chemical features of the ligand compounds. These results suggest that the combination of structure-based docking and advanced protein structure modeling methods should be a valuable approach to the large-scale drug screening and discovery studies, especially for the proteins lacking crystallographic structures.
Keywords: Virtual screening, Enrichment rate, Ligand docking, Protein structure prediction
1. Introduction
Virtual screening is a computational approach to detect potential leads from compound libraries that has become a standard technology in modern drug discovery pipelines [1]. The total number of potential ligands for drug development is much larger than what can be feasibly tested. While estimates of the total number of synthetically accessible small molecules vary, even the smallest number indicates a drug-like chemical space that is much larger than what can be efficiently explored experimentally through blind screening. Given the common estimate that a single industrial lab can only test 10,000–100,000 compounds in a day with standard high throughput screening, the smallest estimate [2] of drug-like chemical molecules (1.5 × 10⁷) still presents a formidable task for lead selection. If larger estimates of 1023–1060 possible drug-like molecules are considered [3], the total number of potential ligands for drug development is much larger than what can be feasibly tested experimentally. The main goal of virtual screening is therefore to identify a limited set of candidates to be synthesized for the much more expensive next step of experimentally examining their biological activities [1].
Historically, virtual screening approaches in the drug development process have been divided into structure- and ligand-based algorithms [4,5]. Structure-based computational modeling approaches such as molecular docking use the full three dimensional structure of the protein target for lead optimization and hit discovery [6]. The ligand-based approach, by contrast, ignores the structural details of the protein target and finds ligands with pharmacophores similar to known hits to generate a model of the pharmacodynamics of a potential hit, or to perform quantitative structure–activity relationship studies [5]. In principle, the structure-based methods might be expected to give better results than the ligand-based approaches, because they try to simulate the intrinsic character of protein–ligand interactions [7]. However, a major drawback of the structure-based technique is a structural model of the protein, which usually needs to have high-resolution, must be available, which is frequently not the case for many protein families of interest in drug development. If a high-resolution structural model cannot be created, only ligand-based approaches may be used.
Although the amount of high-resolution protein structures has increased dramatically in recent years, the structures of some important protein targets implicated in the etiology of deadly diseases remain unsolved [8,9]. What can be done if the 3D protein structure of the drug target is not available? Fortunately, many computational methods have successfully predicted accurate 3D structures from only the amino-acid sequence of the target. Several methods have been used for protein structure prediction including homology modeling [10,11], threading [12,13], and ab initio folding [14–16].
Most virtual screening studies using predicted structures have been relied on homology modeling, which is based on the general observation that proteins with similar sequences can be expected to possess similar structures. Homology modeling of proteins consists of identification of related proteins with a known 3D structure that can serve as a template, followed by sequence alignment of the target and template, and the refinement of the structural model. Although there are specific cases where a template with low sequence similarity may adopt similar structure folds (e.g. 27 different homologous subfamilies from 60 different enzyme classifications, which have no sequence similarity, have the same TIM barrel fold [17]), homologous templates generally refers to a known protein that shares strong sequence similarity to the target. Thus, the final quality of a homology model for virtual screening often depends on the level of sequence identity between the target and template. Multiple studies have attempted to assess the degree of sequence identity needed for effective virtual screening for different classes of protein targets. As an approximate rule, ≥50% sequence identity is believed to be sufficient for drug discovery [18–20], although this number varies widely among the target class and a strong correlation between sequence identity of the template and virtual screening success has not been verified for most targets at high sequence identity levels [21,22]. On the other hand, the accuracy of the structural model has been shown to correlate with virtual screening success [23]. The accuracy of homology modeling significantly declines when a template above 30% sequence identity cannot be found.
However, approaches based on advanced algorithms including threading and ab initio folding can increase the success rate for modeling the structure of distantly- or non-homologous protein targets [24]. The Iterative threading assembly refinement (I-TAS-SER) is one of such approaches that was designs to combine multiple pipelines of threading, ab initio folding and atomic-level structure refinement for full-length protein structure prediction [25]. In the recent community-wide blind structure prediction experiments, the Critical Assessment of Structure Prediction (CASP), I-TASSER has shown advantages over peer modeling programs in automated 3D structure predictions [26–30].
In this work, we tested the use of the I-TASSER models in large-scale structure-based virtual screening of the Directory of Useful Decoys (DUD) database [31]. The 3D structures of protein targets from the DUD database are first constructed by the I-TASSER program from the amino acid sequence alone, where template structures with a sequence identity >30% were excluded from the threading library. Next, atomic level refinement is performed by fragment guided molecular dynamics, FG-MD [32], to relax the predicted structures. The actual virtual screening is performed by molecular docking using the GRID score of DOCK 6.3 [33,34] to measure the binding site complementarity. While the performance of virtual screening using I-TASSER models did not match that of virtual screening using the experimental crystal structure, good enrichment rates (~70%) relative to using crystal structures could be achieved in most cases (65% of the structures tested) using the automatic structure prediction and docking pipelines without human intervention. The rate of success correlates well with the accuracy of I-TASSER in predicting the global fold and local structure of the binding pockets of the proteins. These results suggest that 3D models built by the state of the art structure prediction methods can provide a useful starting point of structure based virtual screening for the many cases where neither an experimental structure nor a clearly homologous template is available.
2. Materials and methods
2.1. Target set of proteins and ligands for virtual screening
We used the Directory of Useful Decoys (DUD) [31], one of the largest freely available databases for evaluating docking based virtual screening methods, to benchmark the performance of both crystal structure and I-TASSER predicted model based virtual screening. The DUD database consists of 40 protein targets from the Protein Data Bank (PDB). For each protein target, there are on average 74 active compounds (or 2950 active compounds in total), where for each active compound there are on average 36 inactive compounds (called decoys) with similar physical properties to the active compound but with dissimilar chemical topology [31]. Three out of the forty proteins in the DUD target set, including HIV-PR (1hpx), FXa (1f0r), HMGR (1hw8), are multi-chain proteins, the models of which should be constructed by the combination of I-TASSER with quaternary structure modeling tools [35]. Since the focus of this study is on automatic I-TASSER-based modeling and docking, these three proteins were removed from the test set. Finally, a crystal structure is not available for the kinase PDGFrb making a comparison impossible. The 36 remaining proteins are listed in Table 1, along with the PDB codes of the proteins and the number of actives and decoys for each target. In this study, only the decoys associated with a target were docked to that target (DUD-self), rather than all decoys for all targets.
Table 1.
A set of proteins from the DUD dataset used for virtual screening test.
| sTarget | PDB ID | Protein name | Class | # Decoys | # Actives |
|---|---|---|---|---|---|
| ACE | 1o86 | Angiotensin-converting enzyme | Metalloenzyme | 1787 | 49 |
| ACHE | 1eve | Acetylcholine esterase | Other enzyme | 3867 | 106 |
| ADA | 1ndw | Adenosine deaminase | Metalloenzyme | 904 | 37 |
| ALR2 | 1ah3 | Aldose reductase | Other enzyme | 985 | 26 |
| AMPC | 1xgj | Ampc beta lactamase | Other enzyme | 781 | 21 |
| AR | 2ao6 | Androgen receptor | NH Receptor | 2792 | 74 |
| CDK2 | 1ckp | Cyclin dependent kinase 2 | Kinase | 2015 | 58 |
| COMT | 1h1d | Catechol O-methyltransferase | Metalloenzyme | 459 | 11 |
| COX1 | 1q4g | Cyclooxygenase 1 | Other enzyme | 908 | 24 |
| COX2 | 1cx2 | Cyclooxygenase 2 | Other enzyme | 13,158 | 412 |
| DHFR | 3dfr | Dihydrofolate reductase | Folate enzyme | 8147 | 408 |
| EGFR | 1m17 | Epidermal growth factor receptor kinase | Kinase | 15,750 | 458 |
| ER agonist | 1l2i | Estrogen receptor agonist | NH Receptor | 2517 | 67 |
| ER antagonist | 3ert | Estrogen receptor antagonist | NH Receptor | 1434 | 39 |
| FGFR1 | 1agw | Fibroblast growth factor receptor kinase | Kinase | 4490 | 120 |
| GART | 1c2t | Glycinamide ribonucleotide transformylase | Folate enzyme | 863 | 31 |
| GPB | 1a8i | Glycogen phosphorylase beta | Other enzyme | 2115 | 52 |
| GR | 1m2z | Glutocorticoid receptor | NH Receptor | 2922 | 78 |
| HIVRT | 1rt1 | HIV reverse transcriptase | Other enzyme | 1495 | 42 |
| HSP90 | 1uy6 | Human heat shock protein 90 kinase | Kinase | 965 | 25 |
| INHA | 1p44 | Enoyl ACP reductase | Other enzyme | 3232 | 86 |
| MR | 2aa2 | Mineral corticoid receptor | NH Receptor | 630 | 15 |
| NA | 1a4g | Neuraminidase | Other enzyme | 1866 | 49 |
| P38 | 1kv2 | P38 mitogen activated protein kinase | Kinase | 9041 | 353 |
| PARP | 1efy | Poly(ADP-ribose) polymerase | Other enzyme | 1331 | 35 |
| PDE5 | 1xp0 | Phosphodiesterase V | Metalloenzyme | 1972 | 76 |
| PNP | 1b8o | Purine nucleoside phosphorylase | Other enzyme | 1017 | 30 |
| PPAR-γ | 1fm9 | Peroxisome proliferator activated receptor gamma | NH Receptor | 3071 | 82 |
| PR | 1sr7 | Progesterone receptor | NH Receptor | 1019 | 27 |
| RXRa | 1mvc | Retinoic X receptor alpha | NH Receptor | 744 | 20 |
| SAHH | 1a7a | S-adenosyl-homocysteine hydrolase | Other enzyme | 1312 | 33 |
| SRC | 2src | Tyrosine kinase SRC | Kinase | 6217 | 159 |
| Thrombin | 1ype | Thrombin | Protease | 2425 | 68 |
| TK | 1kim | Thymidine kinase | Kinase | 876 | 22 |
| Trypsin | 1bju | Trypsin | Protease | 1644 | 46 |
| VEGFR2 | 1y6b | Vascular endothelial growth factor receptor kinase | Kinase | 2849 | 78 |
Crystallographic structures of the bound proteins were used without further refinement after removing water and heavy metal atoms and adding polar hydrogens with ANTECHAMBER [36]. AM1-BCC partial charges [37,38] were added to both the crystallographic structures and I-TASSER models with ANTECHAMBER.
2.2. Creation of protein models by I-TASSER
The predicted structure models used for virtual screening were generated by the automated I-TASSER pipeline [27]. While the I-TASSER method has been described in previous work [17,20], we give an outline of the pipeline below.
In the first step of the I-TASSER modeling, the target sequences are threaded by LOMETS [39], a locally installed meta-server platform consisting of 8 threading proteins (FFAS [40], HHsearch [41], MUSTER [42], PPA [43], PRC [44], PROSPECT2 [45], SAM-T02 [46], SP3 [47], and SPARKS [48]), through a representative PDB library to search for possible folds or super-secondary structure segments matching the target sequence. In this benchmark test, all templates with a sequence identity >30% to the target are excluded to filter out homology contaminants. This cutoff corresponds to the “twilight zone” where structure prediction becomes significantly more difficult and therefore represents a challenging test where conventional homology modeling frequently fails [49].
Following the template detections, continuous fragments are excised from the LOMETS alignments, which are used to reassemble the full-length structure models. The threading unaligned regions (mainly loops and tails) are built by ab initio folding based on an on-lattice system. The structural assembly procedure is implemented by the replica-exchange Monte Carlo simulation [50], with an optimized knowledge-based force field. The models with the lowest free-energy are identified by SPICKER that clusters all structure decoys in the MC simulations [51].
Because I-TASSER models were built on reduced models as specified by the C-alpha and side-chain center of mass and the SPICKER clustering procedure generates models by coordinate averaging which often result in atom overlaps, we conduct a fragment-guided molecule dynamic simulation, FG-MD [32], to add full-atom coordinates and to remove the local overlaps. In FG-MD, simulated annealing molecular dynamics simulations were implemented using a modified LAMMPS algorithm [52], where the force field consists of four energy terms from the distance map restraints from I-TASSER, explicit hydrogen binding, a repulsive potential, and the AMBER99 force field [53]. To further improve the topology of the reduced I-TASSER models, substructures consisting of three consecutive secondary structure elements are excised from the I-TASSER models and used as probe to search through a non-redundant PDB library by TM-align [54] to detect the analogous structure fragments that are closest to the substructures. Spatial constraints were collected from these analogous fragments and used as an additional term to guide the FG-MD simulations. The final refined models from the FG-MD simulations were selected based on the sum of the Z-score of hydrogen bonds, the Z-score of the number of steric clashes, and the Z-score of FG-MD energy. This procedure was fully automated (http://zhang-lab.ccmb.med.umich.edu/FG-MD/) with a running time for each refinement target of less than 2 h for a 2.4 GHz CPU.
As a control, a similar process of the FG-MD refinement simulation was also implemented on the experimental crystal structures to create a separate set of protein models for comparison, termed the relaxed crystal set. Because the X-ray structure often exists as a global fold with idealized local structure (e.g. free of overlaps), the application of the FG-MD procedure to the crystal structures only results in a negligible change to backbone structure (<0.3 Å RMSD). But the side-chain packing is re-calculated, which may occupy the void formerly occupied by the ligand since the ligand is not included in the FG-MD relaxation.
2.3. Molecular docking
Virtual screening on the I-TASSER models and the experimental X-ray structures was performed by molecular docking using the DOCK 6.3 program, selected for its known accuracy and speed [33]. DOCK first generates a negative image of the receptor by making use of spheres that fill the binding pocket. The algorithm then attempts to superimpose the ligand atoms onto the centers of the spheres. For bound crystal structures, a receptor box centered on the bound ligand with an additional 5 Å boundary was used to define the active site for docking. For the I-TASSER predicted models a similar box was made by a superposition of the crystallographic structures onto the I-TASSER models. The DMS program distributed with DOCK 6.3 was used to generate the molecular surface for each receptor while the SPHGEN utility was then used to create the negative image of the surface with the sphere set for each complex composed of all spheres found within 10 Å of any ligand atoms. Scoring function potential grids for the receptor were pre-calculated prior to docking by the GRID utility to increase computational efficiency. Finally, the incremental anchor-and-grow strategy was used to incorporate ligand flexibility in the docking process [55]. Virtual screening with docking was carried out on a Linux Cluster Platform which contains 2200 CPUs (Inter(R) Xeon(R) 2.27 GHz) on 266 computing nodes.
2.4. Virtual screening and enrichment rate
For each target, compounds were sorted and ranked based on the docking pose with the lowest GRID energy. It is important to have an objective criteria for evaluating the quality of the protocol and the performance of an in silico virtual screening method. The enrichment rate is a practical statistic geared towards one of the main goals of virtual screening, identification of rare potential lead compounds amongst a large set of similar but inactive compounds (decoys) [31]. The enrichment rate (ER) is defined as:
| (1) |
where is the number of hits found at x% of the database screened, is the number of compounds screened at x% of the database, Hitstotal is the number of actives in entire database, and Ntotal is the number of compounds in entire database. It can easily be seen that enrichment rate has a fixed maximum at any given percentage of the database screened. At 1%, the maximum is 100, at 2% the maximum is 50, and at 10% screened the maximum enrichment rate obtainable is 10. This enrichment rate reflects the capability of a screening application to detect active ligands (true positives) compared to random selection.
3. Results and discussion
3.1. Virtual screening and enrichment evaluation based on crystallographic structures of proteins
In the docking approach, the test molecules were docked with the target proteins and sorted according to their docking scores. The enrichment curve plot of the percentage of actives found for different levels of hypothetical database screening is shown in Fig. 1 with the enrichment curve docking against the crystallographic bound structure colored in blue and the enrichment curve for random screening colored in green. Random screening gives an enrichment value near 1, which is expected by consideration of the form of the enrichment factor.
Fig. 1.

The enrichment curves using the experimental X-ray crystal protein structures in the virtual screening (blue) compared to random selection (green) and 10 times the performance of random selection (black).
It can be seen from Fig. 1 that docking against the crystal structure is a successful strategy for some proteins targets but not others, in agreement with other studies using docking-based virtual screening [56]. To eliminate intractable targets, a threshold of 10 times the enrichment over random selection was selected as a cutoff for successful docking. This cutoff is roughly 2.5 times the enrichment rate usually obtained for ligand based virtual screening and 5 times that for virtual screening based on simple molecular descriptors like atom counting. This threshold was met for 20 out of the 36 proteins tested. Docking was judged to be unsuccessful for the remaining 16 out of the 36 proteins tested and these targets were eliminated for further consideration, as it is less likely (but not impossible) [21] that a predicted model will succeed in virtual screening where a high resolution experimental structure has failed.
3.2. Quality of I-TASSER based structure prediction on the DUD protein targets
The sequences of the remaining 20 protein targets were used to generate the 3D theoretical models by the I-TASSER program, to test how close the predicted models could reproduce the performance of experimental structures in docking-based virtual screening. In addition to RMSD, the similarly of the I-TASSER models with the target structure is assessed by TM-score [57], which is in the range of [0,1] with a higher score indicating a better structural match. In general, a TM-score <0.17 is equivalent to a randomly selected protein pair with gapless alignment taken from PDB while a TM-score >0.5 corresponds to protein pairs with similar folds [58]. Compared to the widely used RMSD measure, TM-score has been demonstrated to be more sensitive to the global fold by weighting residue pairs between structures at short distances at a higher weight, while RMSD is more sensitive to the local structure fluctuations.
Fig. 2 represents a summary of the first models generated by I-TASSER. In this plot, the lines and balls represent the TM-score (red) or RMSD (blue) of predicted model to the native structure, respectively, for each protein. Even with the limitations on structural templates imposed by the 30% sequence identity cutoff, only one target in the DUD database, Neuraminidase (na), a large 461-residue protein with a complex topology with many flexible loops, fails to meet the 0.5 TM-score cutoff indicative of a similar global fold as the native structure. The predicted models of the remaining proteins have similar global folds to the native with most proteins having TM-scores in the 0.7–0.9 range and RMSD values of 4 Å or less.
Fig. 2.

Summary of I-TASSER structure predictions on the 20 DUD proteins in comparison to the experimental crystal structures.
As a control, we tried to generate models using MODELLER [59], a standard tool for homology modeling, using the same threading templates. The TM-scores of the MODELLER models are lower than the I-TASSER models for all the targets, with the average RMSD of 2.4 Å higher than that of the I-TASSER models. Nevertheless, 13 out of the 20 targets have the correct fold by MODELLER with a TM-score >0.5, mainly due to the correct identification of the template structures by LOMETS.
3.3. Comparison of virtual screening performance using I-TASSER models versus crystallographic structures
The enrichment curve using predicted I-TASSER models is presented in Fig. 3 in comparison with the performance using the crystallographic structures in docking-based virtual screening. In order to compare the performance of virtual screening based on experimental crystallographic structures and I-TASSER predicted models quantitatively, we checked the number of actives that were ranked in the top 1%, 5%, 10% of the compounds chosen, and calculated the corresponding enrichment rates (Table 2). The percentage of the I-TASSER models that reach or exceed the virtual screening performance of either the crystallographic structures or the crystal structures relaxed in the unbound form by FG-MD using these screening thresholds is shown in Table 3.
Fig. 3.

Enrichment curves in virtual screening using the experimental bound crystal structure (blue), experimental crystal structure relaxed in the unbound form by FG-MD (black), and the I-TASSER model (red) compared to random selection (green).
Table 2.
Enrichment rate (ER) values for the top 1%, 5% and 10% compounds (ER1%, ER5% and ER10%) on 20 DUD targets using different receptor models with or without Tanimoto filters (“−” refers to the cases which failed to achieve enrichment over random screening).
| Targets | Original DUD dataset without filter
|
TC2 dataset with TanimotoCombo filter
|
|||||||||||||
|---|---|---|---|---|---|---|---|---|---|---|---|---|---|---|---|
| Crystal (bound)
|
Crystal (relaxed)
|
I-TASSER model
|
Crystal (bound)
|
I-TASSER model
|
|||||||||||
| ER1% | ER5% | ER10% | ER1% | ER5% | ER10% | ER1% | ER5% | ER10% | ER1% | ER5% | ER10% | ER1% | ER5% | ER10% | |
| ace | 25.00 | 39.58 | 39.58 | 20.41 | 28.57 | 36.73 | 18.37 | 30.61 | 34.69 | 45.83 | 66.67 | 66.67 | 33.33 | 50.00 | 58.33 |
| ada | 15.38 | 25.64 | 38.46 | 12.82 | 28.21 | 38.46 | 5.13 | 17.95 | 41.03 | 15.38 | 25.64 | 38.46 | 5.13 | 17.95 | 41.03 |
| ampc | 14.29 | 28.57 | 33.33 | 19.05 | 28.57 | 38.10 | – | – | – | 15.00 | 30.00 | 35.00 | – | – | – |
| cdk2 | 19.72 | 30.99 | 33.80 | 12.50 | 18.06 | 19.44 | 14.08 | 25.35 | 28.17 | 19.72 | 30.99 | 33.80 | 14.08 | 25.35 | 28.17 |
| comt | 11.11 | 11.11 | 11.11 | – | 12.50 | 12.50 | 27.27 | 27.27 | 27.27 | – | – | – | 100.00 | 100.00 | 100.00 |
| egfr | 19.36 | 30.85 | 35.74 | 23.26 | 33.40 | 38.48 | 21.43 | 25.76 | 28.57 | 17.19 | 28.73 | 33.94 | 20.00 | 24.09 | 27.05 |
| fgfr1 | 11.40 | 20.18 | 22.81 | 21.93 | 35.09 | 40.35 | 16.07 | 28.57 | 32.14 | 12.87 | 21.78 | 24.75 | 17.17 | 27.27 | 31.31 |
| hivrt | 11.63 | 20.93 | 30.23 | 4.65 | 13.95 | 18.60 | 11.63 | 18.60 | 20.93 | 12.82 | 20.51 | 28.21 | 12.82 | 15.38 | 17.95 |
| inha | 16.87 | 30.12 | 32.53 | 16.67 | 25.00 | 28.57 | 18.60 | 31.40 | 34.88 | 15.38 | 28.21 | 32.05 | 18.52 | 29.63 | 33.33 |
| mr | 13.33 | 33.33 | 46.67 | 6.67 | 6.67 | 13.33 | 6.67 | 6.67 | 6.67 | 15.38 | 38.46 | 46.15 | – | – | – |
| na | 26.53 | 55.10 | 67.35 | 2.04 | 10.20 | 12.24 | 14.29 | 26.53 | 40.82 | 25.00 | 54.17 | 66.67 | 14.58 | 27.08 | 39.58 |
| p38 | 11.92 | 18.98 | 22.30 | 12.99 | 21.11 | 27.84 | 8.89 | 16.89 | 22.00 | 15.79 | 18.95 | 22.63 | 11.83 | 16.67 | 20.97 |
| parp | 17.14 | 20.00 | 31.43 | 14.71 | 17.65 | 20.59 | 2.86 | 2.86 | 2.86 | 17.14 | 20.00 | 31.43 | 2.86 | 2.86 | 2.86 |
| pde5 | 18.18 | 31.82 | 34.09 | 14.77 | 26.14 | 28.41 | 15.48 | 26.19 | 29.76 | 9.09 | 11.36 | 13.64 | 6.67 | 8.89 | 11.11 |
| pnp | 14.00 | 16.00 | 26.00 | – | – | 4.00 | 16.00 | 22.00 | 26.00 | 14.00 | 16.00 | 26.00 | 16.00 | 22.00 | 26.00 |
| rxr-a | 20.00 | 50.00 | 50.00 | 30.00 | 45.00 | 45.00 | – | – | – | 20.00 | 50.00 | 50.00 | – | – | – |
| src | 21.66 | 28.03 | 31.21 | 18.54 | 27.81 | 28.48 | 15.23 | 27.81 | 31.13 | – | – | 8.33 | 7.32 | 14.63 | 17.07 |
| thrombin | 16.90 | 46.48 | 57.75 | 10.14 | 26.09 | 31.88 | 15.28 | 44.44 | 54.17 | 9.52 | 23.81 | 38.10 | 10.00 | 25.00 | 25.00 |
| trypsin | 13.64 | 31.82 | 38.64 | 7.14 | 19.05 | 33.33 | 4.26 | 12.77 | 21.28 | 7.14 | 28.57 | 28.57 | – | – | – |
| vegfr2 | 14.12 | 15.29 | 15.29 | 21.18 | 34.12 | 38.82 | 21.59 | 25.00 | 30.68 | 4.65 | 6.98 | 6.98 | 12.50 | 12.50 | 22.50 |
| Average | 15.68 | 26.65 | 32.37 | 14.97 | 24.06 | 27.76 | 14.06 | 23.15 | 28.50 | 16.22 | 28.94 | 33.23 | 18.93 | 26.21 | 31.39 |
Table 3.
Performance of docking screening based on the I-TASSER models relative to that on the X-ray bound structures or X-ray structures relaxed by FG-MD.
| % Relative cutoff of successa (%) | I-TASSER model vs. bound structureb
|
I-TASSER model vs. relaxed structurec
|
||||
|---|---|---|---|---|---|---|
| ER1% (%) | ER5% (%) | ER10% (%) | ER1% (%) | ER5% (%) | ER10% (%) | |
| 50 | 75 | 70 | 80 | 80 | 85 | 85 |
| 60 | 65 | 70 | 75 | 75 | 85 | 80 |
| 70 | 65 | 70 | 65 | 70 | 75 | 75 |
| 80 | 45 | 60 | 60 | 65 | 65 | 55 |
| 90 | 40 | 35 | 45 | 60 | 55 | 55 |
| 100 | 30 | 25 | 25 | 45 | 45 | 50 |
Threshold for success defined as the fraction of the enrichment rate using the I-TASSER model to that using the X-ray bound structure or the relaxed X-ray structure.
The percentage of ER that reach the threshold using the I-TASSER models compared to that using the X-ray bound structure.
The percentage of ER that reach the threshold using the I-TASSER models compared to that using the X-ray structure relaxed by FG-MD.
A few trends are apparent from the data. The first is the acceptable virtual screening performance of the I-TASSER models when compared with virtual screening using either the bound or relaxed crystallographic structures. For only three proteins (ampc, mr and rxr) does the virtual screening with I-TASSER models fail completely and give enrichment rates near random performance (colored in green in Fig. 3). Two of these proteins (mr, rxr) are in the difficult nuclear hormone receptor class (Table 1) for which docking using the experimental crystal structure failed for 6 out of the 8 targets in this class (Fig. 1). For the remaining proteins (ace, cdk2, comt, egfr, fgfr1, hivrt, inha, p38, pde5, pnp, thrombin, vegfr2), the I-TASSER models perform relatively well in virtual screening.
More quantitatively, for 13 targets (65% of the total) the I-TAS-SER models were able to reach 70% or better of the enrichment value using the experimental bound crystal structure. 75% of the I-TASSER models can achieve half of the performance of virtual screening using the experimental crystal structures when the top 1% of the database is ranked. Interestingly, I-TASSER compares slightly more favorably when compared to the structures relaxed in the unbound form by FG-MD, in agreement with the improvement in docking for most protein targets when using experimental holo-structures [60]. The I-TASSER models of five proteins (fgfr1, inha, pnp, comt, vegfr2) are actually significantly better in virtual screening than the bound crystallographic structures in virtual screening, although, except for comt, they perform similarly to the relaxed experimental crystal structures. This finding suggests the improvement of the I-TASSER models over the bound crystal structures in these cases is a result of the rigid conformation of the protein used in docking during screening, which prevents reorganization of the binding site during docking to accommodate an active ligand with a different conformation than the bound conformation [60]. The relaxed crystal structures and I-TASSER models in these cases have more open binding sites and can therefore accommodate a greater diversity of ligands.
As a control, we used the MODELLER models in the same structure-based docking screening. There are only 7 cases (35% of the total) that were able to reach 70% or better of the enrichment value by the experimental bound crystal structure. The average enrichment values by the MODELER models are 35%, 26% and 28% lower than that using the I-TASSER models at the top 1%, 5% and 10% of compounds selected, respectively. These data demonstrate an impact of the structure prediction methods on the performance of the structure-based visual screening.
3.4. Correlation between enrichment rate and quality of protein models
The above I-TASSER data in comparison with the control models by MODELLER has indicated the dependence of the performance of virtual screening on the accuracy of the target protein structures. To have a more quantitative examination on the problem, we present in Fig. 4 the correlation of enrichment rate and the quality of the target models, with focus on the proteins for which I-TASSER models faithfully reproduced the fold of the protein (TM score >0.7) and were successful replacements for the crystal structures in virtual screening (60% of the ER10% of the bound crystal structure). 14 out of the 20 targets met this criterion. If the outlier thrombin target is excluded, there is a Pearson correlation between the ERs and the TM-score with R value 0.728 and p-value (0.01), suggesting a relationship does exist between the fidelity of the receptor models to the native and the success in virtual screening.
Fig. 4.

Correlation between ER10% and TM-score of the receptor models when I-TASSER models successfully predicted the native structure (TM-score ≥0.7) and the virtual screening was successful, i.e. with 60% of the ER10% from the bound crystal structure. The outlier thrombin was removed from the correlation analysis.
Nevertheless, there are cases where the performance of virtual screening demonstrates somewhat contradictive correlation to the global quality of the I-TASSER models. For instance, neuraminidase (NA) is the only target where I-TASSER failed to generate a correct fold (with a TM-score <0.5) as shown in Fig. 2. However, the enrichment rate at 10% compound is 40.82 using the I-TASSER model, which is 61% of that using the bound crystal structure. A detailed examination on this case found that the local binding pocket of the I-TASSER model is very close to the bound crystal structure although the global fold of the other regions has a very low resolution (Fig. 5). In this example, since the docking box (colored in black) has been correctly identified, the incorrectness of the structure outside the binding pocket does not have a strong impact on the final performance of the virtual screening. This data partly highlights the sensitivity of the docking screening on the local quality of protein structure predictions.
Fig. 5.
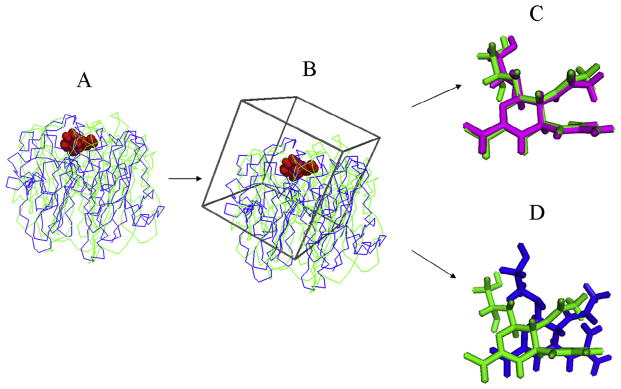
Ligand docking on the neuraminidase protein. (A) Superposition of the crystallographic structures (green) and I-TASSER model (blue) of the target protein with the binding pocket residues highlighted in red spheres. (B) The initial docking box (black) generated by DOCK 6.3 is overlaid on the protein structure before self-docking. (C) Overlay of the ligand structure from the native (purple) and that by docking using bound crystal structure of the protein (green). (D) Overlay of the ligand structure from the native (purple) and that by docking using I-TASSER model of the protein (green).
3.5. Impact of physicochemical similarity filter of decoy compounds
In addition to the quality of the protein structure predictions, the selection of appropriate compounds can also result in an impact on the performance of the virtual screening. To examine the possibility, we used the ROCs 2.2 software from OpenEye (http://www.eyesopen.com) to filter the actives of each protein before docking screening. ROCs is a fast shape comparison application software, which ranks molecules on the basis of their similarity to a known active molecule (reference ligand) in 3D shape space, using atom-centered Gaussian functions to allow rapid maximization of molecular overlap (volume and atomic). Here we used all the actives of each DUD target to match with the crystal reference ligands on the target, with the actives ranked by the TanimotoCombo score. All the active compounds, which have the TanimotoCombo lower than 0.6, were discarded. The final screening results after the Tanimoto filter are summarized in Table 2 as the ‘TC2 data’.
As a result, the enrichment rates are increased by the Tanimoto filter for all cutoffs (ER1%, ER5%, ER10%) using both crystal and predicted structures. The largest improvement is from the screening experiment using the I-TASSER models, where the ER1% was increased by 35%, compared to that using the original DUD compound sets. These data demonstrate the potential to improve the performance by considering physicochemical features of the ligand compounds during virtual screening.
4. Conclusion
Considering the accelerated pace of genome sequencing and the much slower rate of experimental protein structure determination, it is unlikely that three-dimensional structures will be soon available for all the potential drug targets. Therefore, modern drug development at the proteome level must rely on modeled structures provided by protein structure prediction techniques. The results of this study showed that docking-based virtual screening with computational protein models, built by the start of the art modeling methods, emerges as a useful compound prioritization technique applicable to the early stages of proteome-scale drug screening projects, even when no closely homologous templates exist. The computational models produced by the I-TASSER program demonstrated a similar enrichment rate in the identification of active compounds from a set of decoys as the crystal structures for the majority of protein targets in the test. Nevertheless, the performance of the virtual screening can be further enhanced by the improvement of the receptor structure modeling quality and appropriate pre-selection of ligand compound using the physicochemical feature filtering. Thus, these data demonstrated that the combination of structure-based docking and advanced protein structure modeling methods represents a valuable approach to the forthcoming large-scale drug screening and discovery studies, especially for the proteins lacking crystallographic structures.
Acknowledgments
The project is supported in part by the National Institute of General Medical Sciences (GM083107, GM084222).
References
- 1.Walters WP, Stahl MT, Murcko MA. Drug Discov Today. 1998;3:160–178. [Google Scholar]
- 2.Drew KLM, Baiman H, Khwaounjoo P, Yu B, Reynisson J. J Pharm Pharmacol. 2012;64:490–495. doi: 10.1111/j.2042-7158.2011.01424.x. [DOI] [PubMed] [Google Scholar]
- 3.Polishchuk PG, Madzhidov TI, Varnek A. J Comput Aided Mol Des. 2013;27:675–679. doi: 10.1007/s10822-013-9672-4. [DOI] [PubMed] [Google Scholar]
- 4.McInnes C. Curr Opin Chem Biol. 2007;11:494–502. doi: 10.1016/j.cbpa.2007.08.033. [DOI] [PubMed] [Google Scholar]
- 5.Hawkins PCD, Skillman AG, Nicholls A. J Med Chem. 2007;50:74–82. doi: 10.1021/jm0603365. [DOI] [PubMed] [Google Scholar]
- 6.Lyne PD. Drug Discov Today. 2002;7:1047–1055. doi: 10.1016/s1359-6446(02)02483-2. [DOI] [PubMed] [Google Scholar]
- 7.Yuriev E. Future Med Chem. 2014;6:5–7. doi: 10.4155/fmc.13.186. [DOI] [PubMed] [Google Scholar]
- 8.Daga PR, Patel RY, Doerksen RJ. Curr Top Med Chem. 2010;10:84–94. doi: 10.2174/156802610790232314. [DOI] [PMC free article] [PubMed] [Google Scholar]
- 9.Kirchmair J, Markt P, Distinto S, Schuster D, Spitzer GM, Liedl KR, Langer T, Wolber G. J Med Chem. 2008;51:7021–7040. doi: 10.1021/jm8005977. [DOI] [PubMed] [Google Scholar]
- 10.Fiser A, Do RKG, Sali A. Protein Sci. 2000;9:1753–1773. doi: 10.1110/ps.9.9.1753. [DOI] [PMC free article] [PubMed] [Google Scholar]
- 11.Ginalski K. Curr Opin Struct Biol. 2006;16:172–177. doi: 10.1016/j.sbi.2006.02.003. [DOI] [PubMed] [Google Scholar]
- 12.Bowie JU, Luthy R, Eisenberg D. Science. 1991;253:164–170. doi: 10.1126/science.1853201. [DOI] [PubMed] [Google Scholar]
- 13.Jones DT, Taylor WR, Thornton JM. Nature. 1992;358:86–89. doi: 10.1038/358086a0. [DOI] [PubMed] [Google Scholar]
- 14.Bradley P, Misura KMS, Baker D. Science. 2005;309:1868–1871. doi: 10.1126/science.1113801. [DOI] [PubMed] [Google Scholar]
- 15.Zhang Y, Kolinski A, Skolnick J. Biophys J. 2003;85:1145–1164. doi: 10.1016/S0006-3495(03)74551-2. [DOI] [PMC free article] [PubMed] [Google Scholar]
- 16.Xu D, Zhang Y. Proteins. 2012;80:1715–1735. doi: 10.1002/prot.24065. [DOI] [PMC free article] [PubMed] [Google Scholar]
- 17.Greene LH, Lewis TE, Addou S, Cuff A, Dallman T, Dibley M, Redfern O, Pearl F, Nambudiry R, Reid A, Sillitoe I, Yeats C, Thornton JM, Orengo CA. Nucleic Acids Res. 2007;35:D291–297. doi: 10.1093/nar/gkl959. [DOI] [PMC free article] [PubMed] [Google Scholar]
- 18.Hillisch A, Pineda LF, Hilgenfeld R. Drug Discov Today. 2004;9:659–669. doi: 10.1016/S1359-6446(04)03196-4. [DOI] [PMC free article] [PubMed] [Google Scholar]
- 19.Cavasotto CN, Phatak SS. Drug Discov Today. 2009;14:676–683. doi: 10.1016/j.drudis.2009.04.006. [DOI] [PubMed] [Google Scholar]
- 20.Rodrigues JPGLM, Melquiond ASJ, Karaca E, Trellet M, van Dijk M, van Zundert GCP, Schmitz C, de Vries SJ, Bordogna A, Bonati L, Kastritis PL, Bonvin AMJJ. Proteins. 2013;81:2119–2128. doi: 10.1002/prot.24382. [DOI] [PubMed] [Google Scholar]
- 21.Tang H, Wang XS, Hsieh JH, Tropsha A. Proteins. 2012;80:1503–1521. doi: 10.1002/prot.24035. [DOI] [PMC free article] [PubMed] [Google Scholar]
- 22.Ferrara P, Jacoby E. J Mol Model. 2007;13:897–905. doi: 10.1007/s00894-007-0207-6. [DOI] [PubMed] [Google Scholar]
- 23.Bordogna A, Pandini A, Bonati L. J Comput Chem. 2011;32:81–98. doi: 10.1002/jcc.21601. [DOI] [PMC free article] [PubMed] [Google Scholar]
- 24.Zhang Y. Curr Opin Struct Biol. 2008;18:342–348. doi: 10.1016/j.sbi.2008.02.004. [DOI] [PMC free article] [PubMed] [Google Scholar]
- 25.Roy A, Kucukural A, Zhang Y. Nat Protoc. 2010;5:725–738. doi: 10.1038/nprot.2010.5. [DOI] [PMC free article] [PubMed] [Google Scholar]
- 26.Zhang Y. Proteins. 2007;69:108–117. doi: 10.1002/prot.21702. [DOI] [PubMed] [Google Scholar]
- 27.Zhang Y. BMC Bioinform. 2008;9:40. doi: 10.1186/1471-2105-9-40. [DOI] [PMC free article] [PubMed] [Google Scholar]
- 28.Zhang Y. Proteins. 2009;77:100–113. doi: 10.1002/prot.22588. [DOI] [PMC free article] [PubMed] [Google Scholar]
- 29.Zhang Y. Proteins. 2014;82:175–187. doi: 10.1002/prot.24341. [DOI] [PMC free article] [PubMed] [Google Scholar]
- 30.Huang YJP, Mao BC, Aramini JM, Montelione GT. Proteins. 2014;82:43–56. doi: 10.1002/prot.24488. [DOI] [PMC free article] [PubMed] [Google Scholar]
- 31.Huang N, Shoichet BK, Irwin JJ. J Med Chem. 2006;49:6789–6801. doi: 10.1021/jm0608356. [DOI] [PMC free article] [PubMed] [Google Scholar]
- 32.Zhang J, Liang Y, Zhang Y. Structure. 2011;19:1784–1795. doi: 10.1016/j.str.2011.09.022. [DOI] [PMC free article] [PubMed] [Google Scholar]
- 33.Kuntz ID, Blaney JM, Oatley SJ, Langridge R, Ferrin TE. J Mol Biol. 1982;161:269–288. doi: 10.1016/0022-2836(82)90153-x. [DOI] [PubMed] [Google Scholar]
- 34.Moustakas DT, Lang PT, Pegg S, Pettersen E, Kuntz ID, Brooijmans N, Rizzo RC. J Comput Aided Mol Des. 2006;20:601–619. doi: 10.1007/s10822-006-9060-4. [DOI] [PubMed] [Google Scholar]
- 35.Szilagyi A, Zhang Y. Curr Opin Struct Biol. 2014;24:10–23. doi: 10.1016/j.sbi.2013.11.005. [DOI] [PMC free article] [PubMed] [Google Scholar]
- 36.Wang JM, Wang W, Kollman PA. Abstr Pap Am Chem Soc. 2001;222:U403. [Google Scholar]
- 37.Jakalian A, Jack DB, Bayly CI. J Comput Chem. 2002;23:1623–1641. doi: 10.1002/jcc.10128. [DOI] [PubMed] [Google Scholar]
- 38.Jakalian A, Bush BL, Jack DB, Bayly CI. J Comput Chem. 2000;21:132–146. [Google Scholar]
- 39.Wu ST, Zhang Y. Nucleic Acids Res. 2007;35:3375–3382. doi: 10.1093/nar/gkm251. [DOI] [PMC free article] [PubMed] [Google Scholar]
- 40.Jaroszewski L, Rychlewski L, Li ZW, Li WZ, Godzik A. Nucleic Acids Res. 2005;33:W284–W288. doi: 10.1093/nar/gki418. [DOI] [PMC free article] [PubMed] [Google Scholar]
- 41.Soding J. Bioinformatics. 2005;21:951–960. doi: 10.1093/bioinformatics/bti125. [DOI] [PubMed] [Google Scholar]
- 42.Wu ST, Zhang Y. Proteins. 2008;72:547–556. doi: 10.1002/prot.21945. [DOI] [PMC free article] [PubMed] [Google Scholar]
- 43.Yan RX, Xu D, Yang JY, Walker S, Zhang Y. Sci Rep-UK. 2013;3 doi: 10.1038/srep02619. [DOI] [PMC free article] [PubMed] [Google Scholar]
- 44.Madera M. Bioinformatics. 2008;24:2630–2631. doi: 10.1093/bioinformatics/btn504. [DOI] [PMC free article] [PubMed] [Google Scholar]
- 45.Xu Y, Xu D. Protein Struct Funct Genet. 2000;40:343–354. [Google Scholar]
- 46.Karplus K, Barrett C, Hughey R. Bioinformatics. 1998;14:846–856. doi: 10.1093/bioinformatics/14.10.846. [DOI] [PubMed] [Google Scholar]
- 47.Zhou HY, Zhou YQ. Proteins. 2005;58:321–328. doi: 10.1002/prot.20308. [DOI] [PMC free article] [PubMed] [Google Scholar]
- 48.Zhou HY, Zhou YQ. Proteins. 2004;55:1005–1013. doi: 10.1002/prot.20007. [DOI] [PubMed] [Google Scholar]
- 49.Rost B. Protein Eng. 1999;12:85–94. doi: 10.1093/protein/12.2.85. [DOI] [PubMed] [Google Scholar]
- 50.Zhang Y, Kihara D, Skolnick J. Protein Struct Funct Genet. 2002;48:192–201. doi: 10.1002/prot.10141. [DOI] [PubMed] [Google Scholar]
- 51.Zhang Y, Skolnick J. J Comput Chem. 2004;25:865–871. doi: 10.1002/jcc.20011. [DOI] [PubMed] [Google Scholar]
- 52.Plimpton S. J Comput Phys. 1995;117:1–19. [Google Scholar]
- 53.Wang J, Cieplak P, Kollman PA. J Comput Chem. 2000;21:1049–1074. [Google Scholar]
- 54.Zhang Y, Skolnick J. Nucleic Acids Res. 2005;33:2302–2309. doi: 10.1093/nar/gki524. [DOI] [PMC free article] [PubMed] [Google Scholar]
- 55.Ewing TJA, Makino S, Skillman AG, Kuntz ID. J Comput Aided Mol Des. 2001;15:411–428. doi: 10.1023/a:1011115820450. [DOI] [PubMed] [Google Scholar]
- 56.Cross JB, Thompson DC, Rai BK, Baber JC, Fan KY, Hu YB, Humblet C. J Chem Inf Model. 2009;49:1455–1474. doi: 10.1021/ci900056c. [DOI] [PubMed] [Google Scholar]
- 57.Zhang Y, Skolnick J. Proteins. 2004;57:702–710. doi: 10.1002/prot.20264. [DOI] [PubMed] [Google Scholar]
- 58.Xu JR, Zhang Y. Bioinformatics. 2010;26:889–895. doi: 10.1093/bioinformatics/btq066. [DOI] [PMC free article] [PubMed] [Google Scholar]
- 59.Sali A, Blundell TL. J Mol Biol. 1993;234:779–815. doi: 10.1006/jmbi.1993.1626. [DOI] [PubMed] [Google Scholar]
- 60.McGovern SL, Shoichet BK. J Med Chem. 2003;46:2895–2907. doi: 10.1021/jm0300330. [DOI] [PubMed] [Google Scholar]