

Abstract
Photodynamic therapy (PDT) involves the action of photons on photosensitive molecules, where atomic oxygen or OH− molecular species are locally released on pathogenic human cells, which are mainly carcinogenic, thus causing cell necrosis. The efficacy of PDT depends on the local nanothermodynamic conditions near the cell/nanodrug system that control both the level of intracellular translocation of nanoparticles in the pathogenic cell and their agglomeration on the cell membrane. Dendrimers are considered one of the most effective and promising drug carriers because of their relatively low toxicity and negligible activation of complementary reactions. Polyamidoamine (PAMAM) dendrite delivery of PDT agents has been investigated in the last few years for tumour selectivity, retention, pharmacokinetics and water solubility. Nevertheless, their use as drug carriers of photosensitizing molecules in PDT for cardiovascular disease, targeting the selective necrosis of macrophage cells responsible for atheromatous plaque growth, has never been investigated. Furthermore, the level of aggregation, translocation and nanodrug delivery efficacy of PAMAM dendrimers or PAMAM/zinc phthalocyanine (ZnPc) conjugates on human atheromatous tissue and endothelial cells is still unknown.
In this work, the aggregation of PAMAM zero generation dendrimers (G0) acting as drug delivery carriers, as well as conjugated G0 PAMAM dendrimers with a ZnPc photosensitizer, to symptomatic and asymptomatic human carotid tissues was investigated by using atomic force microscopy (AFM). For the evaluation of the texture characteristics of the AFM images, statistical surface morphological and fractal analytical methodologies and Minkowski functionals were used. All statistical quantities showed that the deposition of nanodrug carriers on healthy tissue has an inverse impact when comparing to the deposition on atheromatous tissue with different aggregation features between G0 and G0/ZnPc nanoparticles and with considerably larger G0/ZnPc aggregations on the atheromatous plaque. The results highlight the importance of using PAMAM dendrimer carriers as a novel and promising PDT platform for atherosclerosis therapies.
Electronic supplementary material
The online version of this article (doi:10.1186/s11671-015-0904-5) contains supplementary material, which is available to authorized users.
Keywords: Nanodrugs, Dendrimers, Nanoparticle aggregation, AFM, Fractal analysis, Biosurfaces, Atheromatous plaque, Photodynamic therapy, Cardiovascular, Surface roughness parameters
Background
Atherosclerosis is a common source of many cardiovascular diseases that cause stroke and heart attack. Atherosclerosis inflammation starts in the intima and media layers of the arterial wall section by forming a plaque, eventually leading to an abrupt rupture of the arterial wall. Although many pharmaceutical agents are available to treat different manifestations of atherosclerosis, their systemic delivery has serious disadvantages, including considerable side effects and low efficacy at tolerated doses [1]. Recent advances in nanotechnology have provided new tools for the efficient diagnosis and therapy of atherosclerosis [2-7]. Photodynamic therapy (PDT), which uses functionalized nanoparticles (NPs) that are selectively attached to the diseased tissues or cells, is a promising method for the localized treatment of atherosclerosis [8].
The action of PDT consists of the selective attachment of photosensitizing molecules (PSs) to the diseased tissue. Irradiation of tissues at specific wavelengths of light activates the PSs, thus promoting cell death [9]. Once irradiated, a PS molecule is transferred into an excited molecular electronic state by the absorption of one photon and eventually transfers its energy to its surrounding molecular oxygen, generating reactive oxygen species (ROS), either singlet oxygen or OH− molecules [10,11]. Due to its short life-time, ROS diffuse within the tissue at a distance of up to few tenths of a nanometer; therefore, the biological damage is limited to the sub cellular location of the action of PSs [12].
The rationale for using PDT in atherosclerosis is justified by a few experimental results [13], where different PSs, such as porphyrins and phthalocyanines (Pcs), are shown to selectively accumulate in the atherosclerotic plaque rather than in the adjacent normal vessel wall (e.g. endothelium), as seen in Figure 1. The overall aim of PDTs is to stop the biological activities of macrophage cells in atheromatous plaques by necrosis, as described previously in the work of McCarthy et al. [14-17] (Figure 1).
Figure 1.
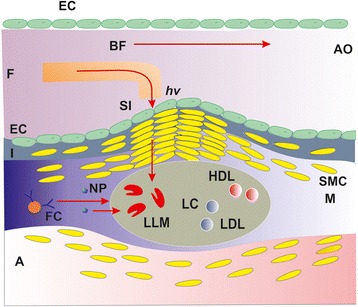
Simplified schematic lay-out of PDT in atherosclerosis. The lipid core plaque (LC) is responsible for stenosis of the aorta (AO). Photons (hv) guided by a fibber (F) illuminate the microphage cells in the plaque (LLM), inducing necrosis following nanoparticle (NP) uptake. SI, side illumination of atheromatous plaque; I, intima; SMC, smooth muscle cells; M, media; A, adventida; FC, foam cell; BF, blood flow; EC, endothelial cells; LDL, low-density lipoprotein; HDL, high-density lipoprotein.
Furthermore, various PS phthalocyanine molecules have advantageous photophysical properties [18], owing to the selectivity of light absorption at 670 nm, where the depth of photon penetration in tissues is twice as high as the penetration depth of porfimer sodium (Photofrin) at 630 nm [19]. In PDTs, the singlet oxygen’s quantum yield is high enough [20] to account for a considerable cell necrosis.
Despite the fact that most of the PSs used in PDTs have low biocompatibility and water-solubility, which limit their effective clinical usage [21,22], both issues are addressed via conjugation of PSs with proper nanocarrier materials [23-25]. The main advantages of using polymer-PS nanodrug conjugates are the high water solubility of the hydrophobic drugs, controlled drug release under certain conditions (e.g. pH or presence of enzymes), resistivity of drugs against degradation, prolonged plasma life-time, improved biocompatibility, altered biodistribution and either specific accumulation in localized sites or enhanced permeability and retention (EPR) in cells [26]. However, in any conjugated system, strong aggregation or self-association of the PSs occurs, leading to detrimental effects, such as low drug delivery efficacy or even tissue damage [27,28].
In the special case of zinc phthalocyanine (ZnPc), successful conjugation with different nanocarriers has already been demonstrated in many other studies [25,29-36], and dendritic delivery of PDT agents has been investigated within the last few years to improve upon tumour selectivity, retention and pharmacokinetics [37,38].
Because of their unique synthetic roots, dendrimers combine a defined composition and monodispersity with a high molecular mass, giving them interesting physical and chemical properties [39]. A large number of functional end-groups are responsible for high solubility and reactivity. Internal cavitations at the nano/microscale can be utilized in transporting small molecules as well [40-42].
Polyamidoamine (PAMAM) molecules comprise a novel class of spherical, biocompatible, safe, non-immunogenic and highly branched or cascade polymers [42] studied as model nanoparticles in biomedical applications, including drug delivery [43-45], owing to their relative large nanometric size and water solubility [46]. Moreover, PAMAM dendrimers can induce multivalence effects, similar to the polyvalent interactions in biological systems [47], but any successful PDT methodology in atherosclerosis must avoid drug aggregation on the endothelial cells (Figure 1). In addition, the efficacy of penetration into the endothelial cells, as well as the selectivity, aggregation and translocation of PAMAM dendrimers or PAMAM/ZnPc conjugates, on human atheromatous tissue is unknown. Recently, it was established that the efficiency of intracellular nanodrug uptake in a cell and the level of agglomeration on the cell membrane are functions of the local nanothermodynamic conditions near the cell-wall/nanodrug system [28].
In this work, the adhesion and aggregation characteristics of different zero generation PAMAM dendrimers (G0) acting as drug delivery carriers, as well as conjugated G0 PAMAM dendrimers with a ZnPc photosensitizer (G0/ZnPc), to symptomatic (atheromatous) and asymptomatic (healthy) human carotid tissues were studied by using atomic force microscopy (AFM), statistical surface analysis and different fractal analytical methodologies. For the evaluation of the texture characteristics of the AFM images and the adhesion and aggregation characteristics of the nanodrugs, scaling from 1 × 1 μm to 5 × 5 μm, fractal analytical methodologies (variance, power spectrum, cube counting and triangulation) and Minkowski functionals (volume, boundary, connectivity) were used, together with statistical surface analysis, allowing for differentiation in the selective aggregation of nanodrugs in symptomatic and asymptomatic carotid tissues.
Methods
G0 PAMAM dendrimers
A G0 PAMAM dendrimer (1,4-diaminobutane core, carbomethoxy pyrolidinone terminated, GEN 0.0, C48H76N10O16) (NanoSynthons, LLC, Mt Pleasant, Michigan, USA) in lyophilized form was used. A quantity of 60 mg was resolved in 1 ml of distilled water, resulting in a concentration of 0.05 M. Then, the solution was further diluted to a final concentration of 0.025 M.
Tissues
Carotid tissues were kindly offered by Poznan University of Medical Sciences, Poland. They were surgically removed from patients who had atheromatous plaques near the common carotid artery and also from patients who had an atheromatous plaque in other areas of the artery; the major carotid artery branch was asymptomatic. Tissues stained in paraformaldehyde were shipped and preserved in 70% ethanol. They were hydrated with Ringer’s solution with the osmotic pressure as blood (mixture of NaCl, KCl, CaCl2 and NaHCO3), and then a microsection of 60 μm was acquired both in the asymptomatic and symptomatic area of the carotid. The microsection was placed on a silica wafer or glass and was poured for 30 min with the aquatic solution of G0 dendrimers or conjugated molecules of ZnPc and G0 dendrimers. Samples were treated according to the ethic issues specified in the FP7-NMP-2012-LARGE-6 ‘CosmoPhos-Nano’ project (reference number: 310337). The study was approved by the ethics committee of Poznan University of Medical Sciences, Poland.
Photonic conjugation of G0 dendrimer and ZnPc
Zinc phthalocyanine (Sigma-Aldrich, St. Louis, MO, USA) was used as the active part of the nanodrug. Photonic conjugation of the dendrimer and ZnPc was achieved with laser light at 157 nm (LPF 200, Lambda-Physik (since 2006), Coherent, Santa Clara, CA, USA) [48,49] to avoid the use of additional catalysts that might enhance agglomeration; ZnPc/G0 dendrimer solutions were prepared by diluting 4 × 10⁻⁵ kg of lyophilized G0 in 10−3 l H2O in a final concentration of 0.038 M. Subsequently, ZnPc (MW = 577.91 × 10⁻³ kg) was partially diluted in 5 × 10⁻³ l phosphate-buffered saline (PBS) in a final concentration of 0.034 M. The PBS buffer was selected for its biocompatibility to avoid toxicity. Two parts of the G0 solution were mixed with one part ZnPc. To avoid the creation and consequent precipitation of aggregated G0 and ZnPc, the solution was sonicated for 30 min. A total of 1.5 × 10⁻³ l of the final solution was placed into a cell that had CaF2 windows, which are transparent at VUV wavelengths. The cell was installed in front of the 157-nm (7.8 eV) laser. The energy, fluence, pulse duration at full width at half maximum and the repetition rate of the unfocused laser beam per laser pulse were 24 mJ, 75 Jm−2, 15 ns and 15 Hz, respectively. At 157 nm, there is a complete bond breaking of all the organic molecules [50]. The parent molecule disintegrates into small fragments that are atomic, diatomic or triatomic. This is because the dissociative excited states of the small radicals occupy the energy range above 6.5 eV (200 nm). This unique functionality at low wavelengths and 157 nm allows for the unique bio-functionalities of surfaces [51,52]. Following laser irradiation at 157 nm, a drop of the liquid was deposited on a Si wafer and left to dry. Then, the film was studied by μ-Raman spectroscopy (100 to 3,200 cm−1, 850-nm diode laser). The μ-Raman spectra of G0 and ZnPc powder are also included in Figure 2 for comparison. The new bands at approximately 1,923 cm−1 and 2,298 cm−1 were attributed to photoconjugated G0/ZnPc as a result of the formation of new bonds following the dissociation of the parent molecules.
Figure 2.
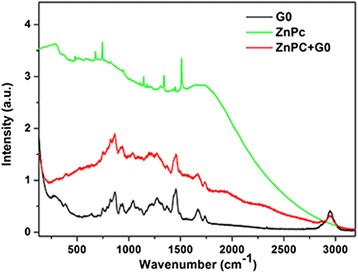
μ-Raman spectra (100 to 3,200 cm−1, 850-nm diode laser) G0 and ZnPc solution. The Raman spectra of G0 and ZnPc powder are also shown for comparison. The new bands around 1,923 cm−1 and 2,298 cm−1 can be attributed to the photo-conjugated G0/ZnPc.
Atomic force microscopy
Images of symptomatic and asymptomatic carotids, as well as symptomatic and asymptomatic carotids with the addition of the G0 and G0/ZnPc conjugates were acquired under ambient conditions by using an AFM (d’Innova, Bruker, Madison, WI, USA). AFM provides high-resolution imaging and measurements of surface topography and properties at the nanoscale. The AFM images of symptomatic/asymptomatic carotids were acquired in tapping-mode using a phosphorus-(n)-doped silicon cantilever (RTESPA, Bruker, Madison, WI, USA) with a nominal spring constant of 40 N/m at approximately 300 kHz resonance frequency and a nominal radius of 8 nm (Figure 3). The AFM images were obtained at different scanning areas at a maximum scanning rate of 0.5 Hz with an image resolution of 512 × 512 pixels. Imaging was carried out at different scales from 1 to 5 μm to verify the consistency and robustness of the evaluated structures. The AFM data were processed with WSXM™ free software [53].
Figure 3.
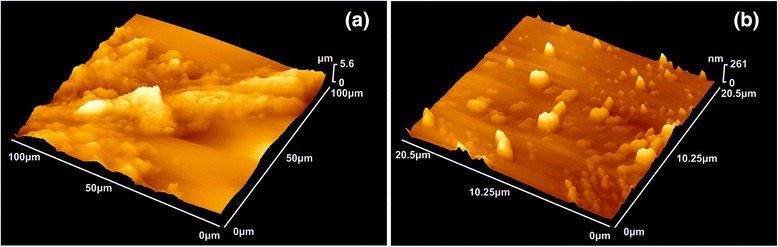
3D-AFM image of atheromatous plaque. (a) 100 × 100 μm size image. (b) 20.5 × 20.5 μm size image, higher magnification of Figure 3a.
Surface roughness parameters
The root mean square surface roughness (Rq), the surface roughness (Ra), the mean media (Z1/2), mode (Zmp) and range (Rt) heights, the maximum valley depth (Rmvd), the maximum peak height (Rmph), skewness (Rsk) and kurtosis (Rku) are used to quantify surface roughness. The statistical parameters of surfaces are shown in Additional file 1 and partially in Table 1. They are calculated from the equations . The Z1/2 and Zmp parameters are calculated from the probability distribution function (PDF) of heights f(Z) that satisfy the equations and .
Table 1.
Surface characteristics obtained from AFM images
| R a ( nm ) | R q ( nm ) | ||
|---|---|---|---|
| 1 × 1 μm | |||
| Healthy | 24.91 | 7.78 | 9.96 |
| Atheromatous | 49.37 | 7.87 | 10.12 |
| Healthy + PAMAM | 8.74 | 1.62 | 2.18 |
| Glass + PAMAM (0.05 M) | 3.54 | 0.53 | 0.79 |
| Glass + PAMAM (0.025 M) | 1.89 | 0.20 | 0.38 |
| 2 × 2 μm | |||
| Healthy | 78.92 | 15.77 | 20.12 |
| Atheromatous | 56.46 | 12.90 | 16.41 |
| Healthy + PAMAM | 41.49 | 3.65 | 5.48 |
| Atheromatous + PAMAM | 166.63 | 17.23 | 24.09 |
| Atheromatous + PAMAM + ZnPc | 175.17 | 32.37 | 41.97 |
| 3 × 3 μm | |||
| Atheromatous | 102.26 | 16.96 | 21.22 |
| Atheromatous + PAMAM + ZnPc | 280.84 | 46.62 | 60.30 |
| 5 × 5 μm | |||
| Healthy | 133.98 | 34.58 | 43.20 |
| Atheromatous | 166.30 | 30.81 | 39.06 |
| Atheromatous + PAMAM | 266.32 | 50.96 | 65.86 |
| Atheromatous + PAMAM + ZnPc | 260.82 | 69.35 | 87.03 |
| Glass + PAMAM (0.025 M) | 19.23 | 2.98 | 6.57 |
AFM, atomic force microscopy; PAMAM, polyamidoamine; ZnPc, zinc phthalocyanine.
Additionally, Rt = |Zmax − Zmin|, , where Zi is the ith height and N is the number of data points over which Zi is collected.
Recently, the surface roughness of arteries acquired from ultrasound images was used for the early diagnosis of atherosclerosis [54]. However, it can only be used for qualitative investigations because they differ by the scale of measurement. It also does not include information about the spatial distribution of the topography.
Fractal methods
The use of fractal geometry, with concepts such as self-similarity and self-affinity, introduced by Mandelbrot [55], has changed and broadened the characterization of surfaces as well as many phenomena and processes. Today, several algorithms have been developed in the literature for the estimation of fractal dimensions from the AFM images. The fractal dimension Df is a measure of the degree of variation of a surface from its topological ideal and is related to both surface roughness and its topological entropy. It describes the degree of chaoticity of a surface and is a number lying between 2 for a smooth surface and 3 for an extremely rough surface [56].
There are many applications of fractal analysis for the characterization of biological surfaces or structures using magnetic resonance imaging [57-59], ultrasound [60,61] or other techniques [62,63]. However, evaluations of fractal parameters from AFM images for biological surfaces are scarce [64,65]. For example, Bitler et al. [64] evaluated the fractal dimension of the macrophage cell membrane and tested the sensitivity of the fractal dimension value to submicron changes in membrane morphology using high-resolution AFM imaging.
In this work, the fractal dimension Df was calculated from the AFM data using B-Spline interpolation with four methods, i.e. cube counting, triangulation, variance and power spectrum distribution, using the free and open source software program Gwyddion [66]. For the four methods, all of the slopes were determined using a linear fit. Before fractal analysis, all AFM images were processed using a dilation algorithm to compensate for the convolution between the tip and the surface and tip distortions caused by the orientation of the tip and the forces between the tip and surface [67]. For dilation, a contact tip with a pyramid shape and a tip apex of 12 nm that was rotated by 45° was used as the model tip for all surface scan reconstructions [68]. For fractal dimension estimation based on structure function and variation methods, we developed custom MATLAB (MathWorks Inc., Natick, MA, USA) codes. The original images were opened, and processed, and the fractal dimension was evaluated with these programs.
Minkowski functionals
The Minkowski functionals were used to describe the global geometric characteristics of structures. Two-dimensional discrete variants of volume V, surface S and connectivity (Euler-Poincaré Characteristic) x were calculated using the Gwyddion™ software [66]. The Minkowski functionals provide parameters that allow for the fundamental quantification of the dispersion. They represent a method to describe the amount of connectivity by analysing the relationship of connected pixels and unconnected pixels present in an image. Minkowski functionals are very effective at describing complex morphologies observed in images [69-71].
Results
AFM morphology, RMS and height distribution
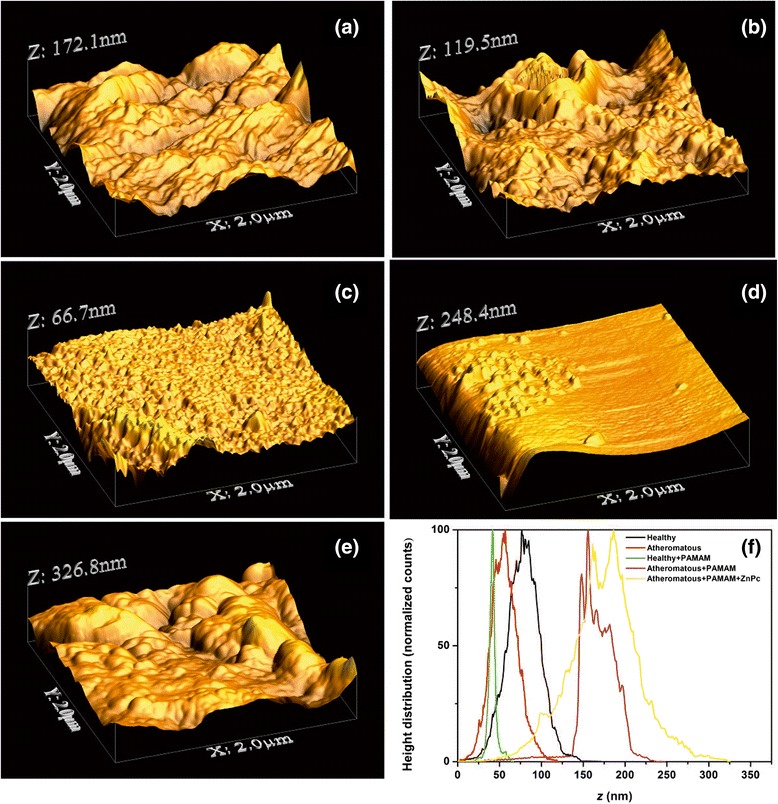
It is found from Table 1, Figures 4, 5, 6 and 7 and Additional file 1 that the PDF of heights f(Z) is unimodal, because the statistical mean, media and mode values of height are almost the same. Plain 1 × 1 μm AFM images of a carotid tissue, either healthy (H), Figure 4a, or atheromatous (A), Figure 4b, display higher and Rq values than healthy carotid samples with G0 dendrimers (G0-H) (Figure 4c and Table 1). The corresponding values are approximately 8.74 nm (G0-H) versus approximately 24.91 nm (H) or approximately 49.37 nm (A). The Rq values are approximately 2.18 nm (G0-H) versus approximately 9.96 nm (H) or approximately 10.12 nm (A).
Figure 4.
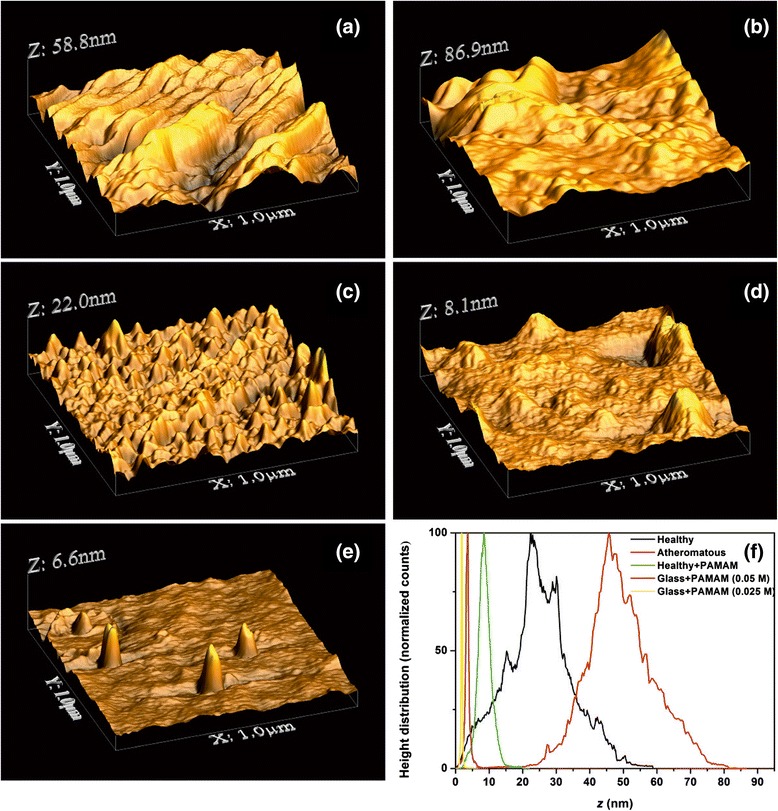
AFM images (1 × 1 μm) showing (a) a healthy carotid tissue, (b) an atheromatous carotid tissue, (c) a healthy carotid tissue with G0 PAMAM dendrimers, (d) a solution (0.05 M) of dendrimers on glass and (e) a highly diluted solution (0.025 M) of dendrimers on glass. (f) Height distribution of the (a)-(e) samples.
Figure 5.
AFM images (2 × 2 μm) showing (a) a healthy carotid tissue, (b) an atheromatous carotid tissue, (c) a healthy carotid tissue with G0 PAMAM dendrimers, (d) an atheromatous carotid tissue with G0 PAMAM dedrimers and (e) an atheromatous carotid tissue with dedrimers conjugated with ZnPc. (f) The corresponding height distribution of the 2 × 2 μm samples.
Figure 6.
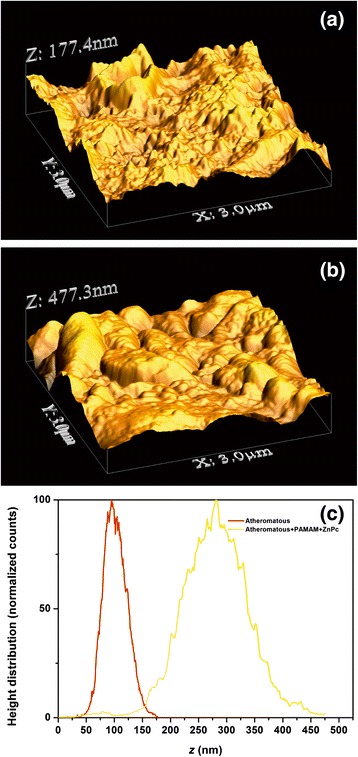
AFM images (3 × 3 μm) showing (a) an atheromatous carotid tissue, (b) an atheromatous carotid tissue with G0 PAMAM dedrimers conjugated with ZnPc. (c) The corresponding height distribution of the 3 × 3 μm samples.
Figure 7.
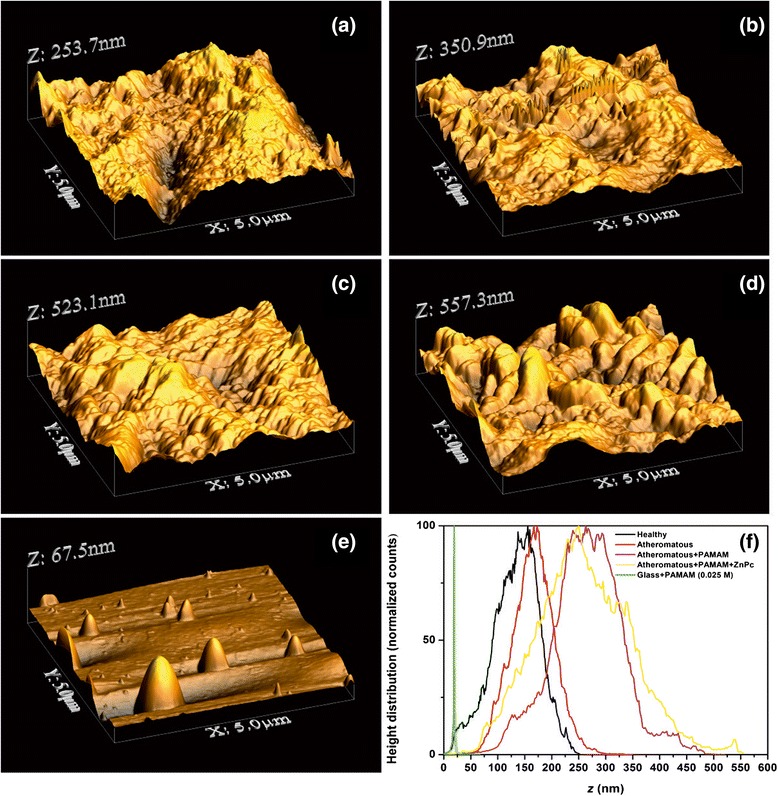
AFM images (5 × 5 μm) showing (a) a healthy carotid tissue, (b) an atheromatous carotid tissue, (c) an atheromatous carotid tissue with G0 PAMAM dedrimers, (d) an atheromatous carotid tissue with G0 PAMAM dedrimers conjugated with ZnPc and (e) a highly diluted solution (0.025 M) of dendrimers on glass. (f) The corresponding height distribution of the 5 × 5 μm samples.
Deposition of the G0 dendrimer on a glass substrate, Figure 4d,e, indicates even lower roughness values, ~3.54 nm and Rq~0.79 nm and ~1.89 nm and Rq~0.38 nm for 0.05 and 0.025 M G0 concentrations, respectively. The cluster size distribution shifts to the right at higher concentrations (Figure 4f).
A similar trend of surface roughness values appears for the 2 × 2 μm AFM images (Figure 5a,b,c). For the G0 dendrimers on healthy and atheromatous tissues, ~41.49 nm (G0-H) and Rq~24.09 nm (G0-H) versus ~78.92 nm (H) and Rq~20.12 nm (H). In contrast, the deposition of G0 dendrimers on atheromatous carotid tissues, Figure 5d, results in higher surface roughness values, ~166.63 nm (G0-A) and Rq~24.09 nm (G0-A), compared to the values of ~56.46 nm (A) and Rq~16.41 nm (A).
The addition of the conjugated G0/ZnPc drug on the atheromatous carotid tissue, Figure 5e, has a similar impact on the surface roughness parameters as the addition of the plain G0 on atheromatous carotid tissue, although the Rq value is much higher, Rq~41.49 nm. This tendency is strengthened by the results obtained from the 3 × 3 μm AFM images, where the and the Rq surface roughness values for the plain atheromatous carotid tissue, Figure 6a, are ~102.26 nm (A) and Rq~21.2 nm (A). These surface roughness values are lower than those of the atheromatous tissue with the addition of the conjugated G0/ZnPc solutions, Figure 6b, where ~280.84 nm (G0/ZnPc) and Rq~60.30 nm (G0/ZnPc). Finally, the 5 × 5 μm AFM images, Figure 7, also demonstrated that the addition of the G0 dendrimers, Figure 7c, or G0/ZnPc, Figure 7d, on the atheromatous tissue affects the surface roughness values significantly, indicating a higher level of agglomeration. On the contrary, the surface roughness values of the G0 NPs on the healthy tissue indicate a low level of agglomeration with average surface parameters that are smaller or equal to those of the healthy tissues. Overall, the results point out that the type of biosurface mediates the agglomeration efficiency of nanodrugs, in agreement with previous results [28].
Size statistics of aggregation of ZnPc nanoparticles on gold (Au) and Si standard test surfaces is different than the aggregation of G0 on the same surfaces. ZnPc nanoparticles tend to aggregate at average sizes larger than the surface roughness parameters of the test surfaces (Additional file 2). This response is owing to the presence of electron charges on the surface of ZnPc nanoparticles and demonstrated by conductive atomic force microscopy (Additional file 2). In case of conjugation of ZnPc with the G0 dendrimers, the negative charges are compensated to give nearly neutral nanoparticles of smaller size.
Fractal analysis
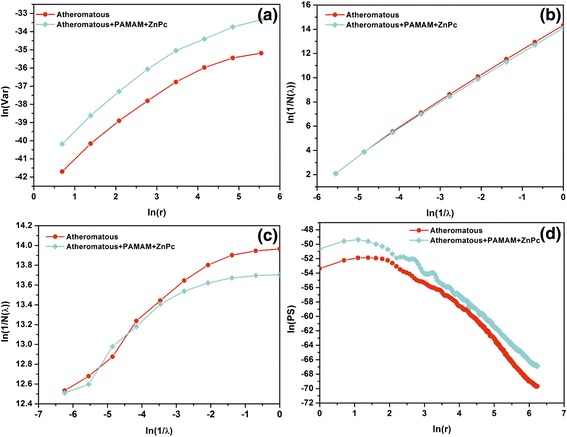
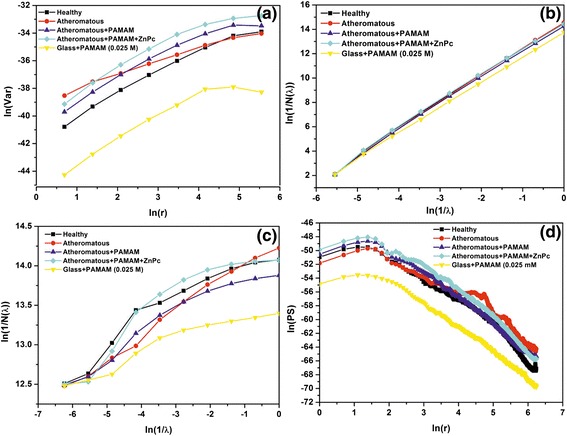
In Figures 8, 9, 10 and 11, the log-log plots used for the calculation of fractal dimensions by applying different methodologies for the 1 × 1 μm, 2 × 2 μm, 3 × 3 μm and 5 × 5 μm sets of AFM images are illustrated. The evaluated fractal dimensions from the four different methods are presented in Table 2. In general, the three methods, namely, variance, cube counting and triangulation, give fractal dimensions that have a similar trend in most cases. In contrast, the power spectrum results not only differ from the other methods but also, most importantly, have values below 2; hence, this method is inappropriate to characterize the samples. It is most important that despite a difference in the absolute values calculated by the three different approaches, the effect of the deposition of G0 dendrimers is consistent. On all scales, a comparison between the images of healthy and atheromatous carotid samples shows that the healthy tissue has a lower fractal dimension than atheromatous, in agreement with Asvestas et al. [60], Rakebrandt et al. [61] and Niu et al. [54], who used statistical and textural measures based on fractal geometry to quantify texture features from ultrasound (US) B-mode images of carotid atherosclerotic plaques.
Figure 8.
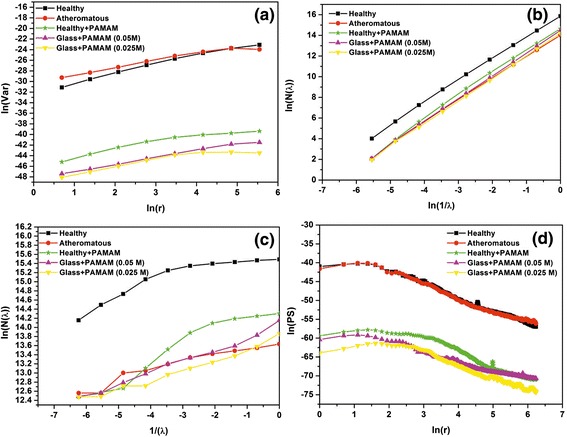
Log-log plots illustrating calculation of fractal dimension by different methods for the 1 × 1 μm AFM images. (a) Variance, (b) cube counting, (c) triangulation and (d) power spectrum.
Figure 9.
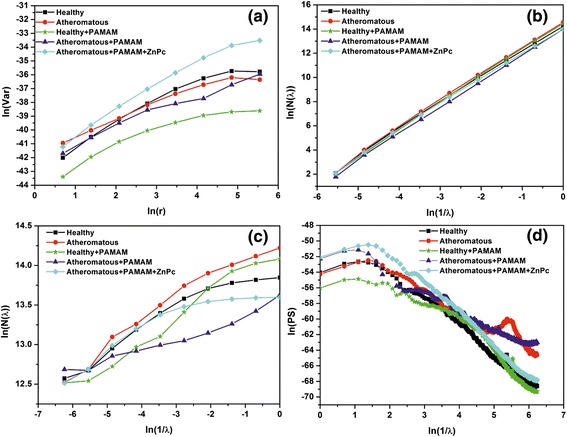
Log-log plots illustrating calculation of fractal dimension by different methods for the 2 × 2 μm AFM images. (a) Variance, (b) cube counting, (c) triangulation and (d) power spectrum.
Figure 10.
Log-log plots illustrating calculation of fractal dimension by different methods for the 3 × 3 μm AFM. (a) Variance, (b) cube counting, (c) triangulation and (d) power spectrum.
Figure 11.
Log-log plots illustrating calculation of fractal dimension by different methods for the 5 × 5 μm AFM images. (a) Variance, (b) cube counting, (c) triangulation and (d) power spectrum.
Table 2.
Fractal dimensions ( D f ) calculated by four different methods
| Variance | Cube counting | Triangulation | Power spectrum | |
|---|---|---|---|---|
| 1 × 1 μm | ||||
| Healthy | 2.23 | 2.18 | 2.23 | 1.68 |
| Atheromatous | 2.41 | 2.25 | 2.34 | 1.89 |
| Healthy + PAMAM | 2.42 | 2.13 | 2.18 | 2.01 |
| Glass + PAMAM (0.05 M) | 2.36 | 2.21 | 2.26 | 2.44 |
| Glass + PAMAM (0.025 M) | 2.49 | 2.19 | 2.22 | 2.05 |
| 2 × 2 μm | ||||
| Healthy | 2.30 | 2.14 | 2.21 | 1.95 |
| Atheromatous | 2.52 | 2.24 | 2.29 | 1.66 |
| Healthy + PAMAM | 2.49 | 2.22 | 2.28 | 2.40 |
| Atheromatous + PAMAM | 2.44 | 2.17 | 2.14 | 2.43 |
| Atheromatous + PAMAM + ZnPc | 2.19 | 2.13 | 2.18 | 1.56 |
| 3 × 3 μm | ||||
| Atheromatous | 2.32 | 2.19 | 2.25 | 1.29 |
| Atheromatous + PAMAM + ZnPc | 2.30 | 2.14 | 2.20 | 1.50 |
| 5 × 5 μm | ||||
| Healthy | 2.28 | 2.22 | 2.26 | 1.47 |
| Atheromatous | 2.53 | 2.23 | 2.30 | 1.84 |
| Atheromatous + PAMAM | 2.33 | 2.18 | 2.24 | 1.64 |
| Atheromatous + PAMAM + ZnPc | 2.33 | 2.19 | 2.28 | 1.47 |
| Glass + PAMAM (0.025 M) | 2.34 | 2.08 | 2.14 | 1.73 |
PAMAM, polyamidoamine; ZnPc, zinc phthalocyanine.
Furthermore, when G0 dendrimers are deposited onto healthy tissue, the fractal dimension is increased, whereas when they are deposited onto atheromatous carotid tissues, the fractal dimension is reduced.
Moreover, when conjugated G0 dendrimers with ZnPc are deposited onto athermanous carotid tissues, the fractal dimension is reduced further.
Finally, images of the G0 dendrimers on symptomatic or asymptomatic tissue give higher fractal dimensions than images of the G0 dendrimers (0.05 M or 0.025 M) deposited onto plain glass, demonstrating that both substrate type and roughness greatly mediate the agglomerating behaviour of the drugs.
Minkowski functionals
The Minkowski functionals, i.e. the volume V, Figure 12, the boundary length S, Figure 13 and the connectivity (Euler characteristic) x, Figure 14, are shown for the AFM images of Figures 4, 5, 6 and 7. The Minkowski volume curves in Figure 12 represent the volume of the rough regions, i.e. the number of pixels with a height threshold larger than z, and they are decreased monotonously from 1 to 0. For the set of 1 × 1 μm AFM images, Figure 12a, it is shown that, in contrast to the carotid tissue that can be either healthy or atheromatous, which both show a nearly point symmetric behaviour with respect to V = 0.5, Z = 48 nm and Z = 24 nm, respectively, the samples that contained the deposited PAMAM dendrimers favour the black areas. For the set of 2 × 2 μm AFM images, Figure 12b, it is shown that symptomatic and asymptomatic carotid tissues, as well as atheromatous carotid tissue with PAMAM dendrimers conjugated with ZnPcs, show a nearly point symmetric behaviour with respect to V = 0.5 and Z = 55 nm, Z = 79 nm and Z = 176 nm, respectively. The carotid tissues where only G0 dendrimers were deposited are shown to have an asymmetrical behaviour. More specifically, the healthy tissue with dendrimers favours the black areas (smooth regions), while the atheromatous one favours white areas (rough regions). For the set of 3 × 3 μm AFM images, Figure 12c, it is shown that atheromatous carotid tissue and atheromatous carotid tissue with G0 dendrimers conjugated with ZnPcs show a nearly point symmetric behaviour with respect to V = 0.5 and Z = 100 nm and Z = 278 nm, respectively. The same trend is observed in the curves of Figure 12d for the 5 × 5 μm AFM images. The curves of the plain (healthy or atheromatous) or G0/ZnPc-treated tissue show a nearly point symmetric behaviour with respect to V = 0.5 and Z = 165 nm, Z = 136 nm and Z = 253 nm, respectively, while the samples (tissue or glass) where only dendrimers were deposited show an asymmetrical behaviour.
Figure 12.
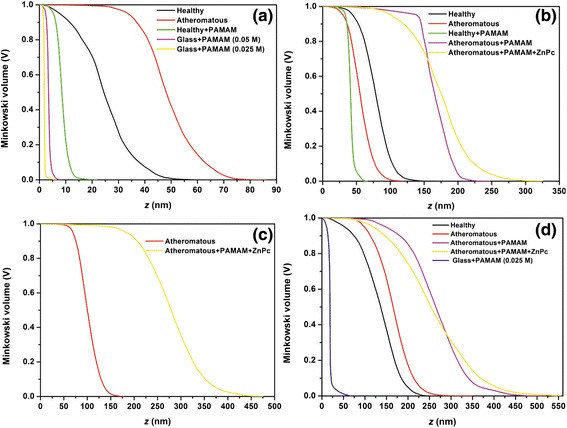
Minkowski volume of (a) 1 × 1 μm, (b) 2 × 2 μm, (c) 3 × 3 μm and (d) 5 × 5 μm AFM images.
Figure 13.
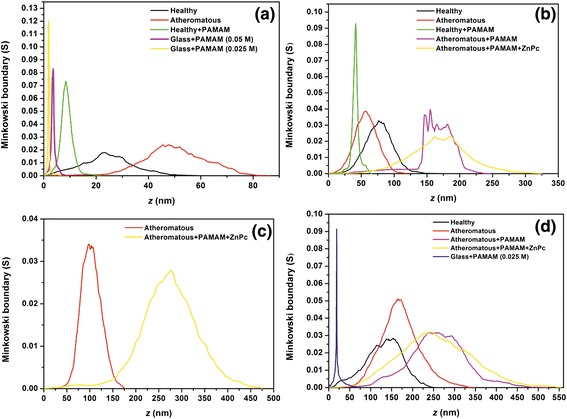
Minkowski boundary of (a) 1 × 1 μm, (b) 2 × 2 μm, (c) 3 × 3 μm and (d) 5 × 5 μm AFM images.
Figure 14.
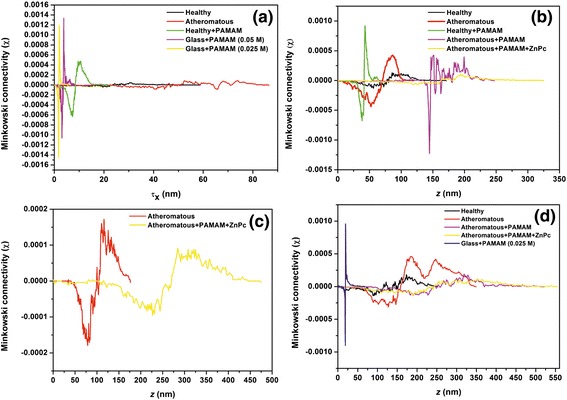
Minkowski connectivity of (a) 1 × 1 μm, (b) 2 × 2 μm, (c) 3 × 3 μm and (d) 5 × 5 μm AFM images.
The Minkowski boundary length, Figure 13, tends to zero for nearly flat and most rough areas and reaches its maximum in the intermediate threshold range. For the set of 1 × 1 μm AFM images, Figure 13a, it is shown that the samples containing deposited G0 dendrimers have narrow and intense Gaussian curves, while the carotid tissue that is either symptomatic or asymptomatic shows asymmetric broad and weak peaks. For the set of 2 × 2 μm AFM images, Figure 13b, it is shown that healthy and atheromatous tissue have Gaussian curves, healthy carotid tissue with G0 dendrimers has a narrow and more intense Gaussian peak and the deposition of G0 dendrimers on atheromatous carotid tissue results in a very asymmetric peak. However, the addition of the ZnPc nanodrug tends to give a nearly symmetrical broad curve with two peaks (non-Gaussian). For the set of 3 × 3 μm AFM images, Figure 13c, it is shown again that the deposition of G0 conjugated with ZnPc tends to give more broad curves when compared to the plain atheromatous carotic. The same trend is also verified in the set of 5 × 5 μm AFM images, Figure 13d.
The Minkowski connectivity (Euler characteristic x) describes the topological structure of the pattern. It is negative (positive) if many disconnected flat (rough) components dominate the image. A vanishing Euler characteristic indicates a highly connected structure with an equal amount of flat and rough components [70]. In Figure 14a (1 × 1 μm), the Minkowski connectivity decreases very sharply at τχ = 1.4 (2.0) to the minimum negative value at τχ = 1.7 (3.1) nm for the images of G0 dendrimers on glass with a concentration of 0.025 M (0.05 M). Then, the Minkowski connectivity increases very sharply until the maximum positive value at 2.0 (3.8) nm and then vanishes at 2.9 (4.3) nm. The Minkowski connectivity of the image of the healthy carotid tissue with G0 decreases more smoothly at τχ = 4.3 nm to the minimum negative value at τχ = 7.3 nm and then rises until the maximum positive value at 9.6 nm. After that, it decreases gradually until it vanishes at 15 nm. In contrast, the Minkowski connectivity of the image of the plain healthy carotid tissue shows fluctuations, with the minimum negative value at 21.2 nm and the maximum positive value at 30.6 nm. This is more pronounced for the Minkowski connectivity of the atheromatous carotid tissue, where several minima and maxima are demonstrated.
In Figure 14b (2 × 2 μm), the Minkowski connectivity of the plain atheromatous carotid tissue starts to decrease early at 7.5 nm to the minimum value at 52.5 nm and then rises to the maximum value at 86.8 nm, while the Minkowski connectivity of the plain asymptomatic carotid tissue displays a plateau of approximately 26 nm when it reaches the minimum and maximum values at 46 nm and 85 nm, respectively. Furthermore, the addition of G0 on the healthy tissue results in sharp peaks of the Minkowski connectivity, with a minimum negative value at 38.3 nm and maximum positive value at 42.8 nm. However, the addition of G0 on the atheromatous carotid tissue results in strong fluctuations of the Minkowski connectivity from approximately 136 nm to 205 nm when it starts vanishing. This phenomenon is remarkably reduced when conjugated dendrimers with ZnPc are placed on the atheromatous carotid tissue. In Figure 14c (3 × 3 μm), the Minkowski connectivity of the plain atheromatous carotid tissue has a minimum value at 78.7 nm and maximum value at 116.1 nm, while the Minkowski connectivity of the atheromatous carotid tissue with the added conjugated dendrimers with ZnPc displays a plateau of 45 nm at approximately 223 nm for negative values and another plateau of 45 nm at approximately 308 nm for maximum values.
In Figure 14d (5 × 5 μm), the Minkowski connectivity decreases very sharply at τχ = 16.6 nm to the minimum negative value at τχ = 18.8 nm for the images of G0 on glass with a concentration of 0.025 M. Then, the Minkowski connectivity increases very sharply until the maximum positive value at 19.4 nm and then vanishes approximately at 26 nm. Atheromatous carotid tissue with G0 and atheromatous carotid tissue with G0 conjugated with ZnPc show almost the same behaviour regarding the Minkowski connectivity, but the latter has fewer fluctuations. Concerning the plain asymptomatic carotid tissue, the Minkowski connectivity displays a broad plateau with several local minima for negative values at approximately 120 nm and two local maxima at 184 nm and 247 nm. In contrast, the Minkowski connectivity of the asymptomatic carotid tissue has a minimum value at 90 nm and then fluctuates around zero until it reaches a positive plateau from 155 nm to 195 nm. Finally, it gradually decreases to a zero value.
Discussion
Normal vascular physiology results in tight (<2 nm) endothelial junctions, which will restrict nanoparticle distribution, whereas a dysfunctional endothelium leads to large gaps that allow NPs to penetrate the endothelial barrier, deposit at local sites and remain retained locally, owing to impaired lymphatic drainage [72]. This phenomenon, which occurs in pathological conditions such as cancer or atherosclerosis, is known as the enhanced permeation and retention effect (EPR) [12]. Nanoparticle size is one crucial determinant of accumulation and penetration into diseased tissue, and NPs with sub-100 nm sizes are optimal for the EPR [73]. Therefore, the adsorption and aggregation of G0 is a major parameter of nanodrug efficacy.
The adsorption and aggregation of dendrimers to mica and silica surfaces, particularly of higher generations, was studied by AFM in several works [74-78]. These studies revealed that such dendrimers flatten substantially upon adsorption and that sometimes aggregates can be observed on the surface, particularly at a higher pH. It was further reported that the PAMAM dendrimers adsorb on mica and silica in correlated liquid-like monolayers and that repulsive electrostatic interactions between the dendrimers lead to low adsorption densities.
Mecke et al. [74] showed experimentally using AFM and via atomistic molecular dynamics simulations that both charged and uncharged PAMAM dendrimers strongly adsorb to mica surfaces, resulting in deformation of the molecules. The heights of the molecules, as determined by AFM, were much less than the diameter in their spherically symmetric state and did not depend strongly on the charge of the branch ends. Flattening of the dendrimers also occurred at the liquid-solid interface, although to a lesser degree. Furthermore, they found that the PAMAM dendrimers in aqueous environments increase in height and volume due to swelling. Studies combining optical reflectometry and AFM demonstrated that the adsorption process of PAMAM dendrimers to silica substrates is driven by attractive forces between the dendrimers and the substrate [75]. Thus, the initial adsorption rate depended on the solution composition only weakly. However, the maximum adsorbed amount increased strongly with the ionic strength and pH.
In another AFM study of PAMAM dendrimers [76], it was noted that the drying procedure could induce the formation of aggregates by capillary forces and, therefore, influence the relative positions of the deposited dendrimers. Thus, under different conditions, the drying process could indeed result in a rearrangement within the adsorbed dendrimer layer. However, the authors noted that the amount of deposited dendrimers remained constant independent of the relative positions. Recently, Yu et al. [77] showed that aggregates’ morphology of the amphiphilic G1 PAMAM dendrimer onto the mica substrate was seemingly spherical at low concentration and that semi-continuous films or network structure films were formed at high concentrations. Finally, Müller et al. [78] stated that the dendrimer shapes depend on the substrate type and that the aqueous solvent may influence dendrimer conformation, as they observed the formation of large aggregates on a HOPG surface when water was used as a solvent using AFM.
Studies of PAMAM distribution on biological samples are rather scarce [79-82]. For example, Dobrovolskaia et al. [79] reported in in vitro studies the effects of the size and surface terminal groups of PAMAM dendrimers on healthy human platelets. The study revealed that only dendrimers of higher generations with positive charge, not negative or neutral or small cationic dendrimers, contributed to the aggregation of human platelets in vitro. It was stated that large cationic PAMAM dendrimers induce platelet aggregation through the disruption of membrane integrity. In another recent study of G4 PAMAM dendrimer-treated rat brains [80], AFM images showed evidence of dendrimers in the inner capillary wall and demonstrated that PAMAM dendrimers are present at the blood-brain barrier (BBB). Furthermore, it was found that, while the height of distinct NPs ranged only from 2.7 to 10 nm, the width was 7 to 13 times larger than the expected diameter of the G4 PAMAM dendrimers, indicating that the measured NPs could be aggregates of dendrimers. Furthermore, Kitchens et al. [81] found that the extravasation time of PAMAM-NH2 dendrimers (G1-G4) across the microvascular endothelium of the cremaster muscle of male golden Syrian hamsters (Mesocricetusauratus) is size dependent due to increased exclusion from the endothelial pores. Finally, Markowicz-Piasecka et al. [82], in the only study to the authors’ knowledge on the effect of PAMAM dendrimers on the endothelium of human arteries, found that the influence of PAMAM dendrimers on the process of clot formation and fibrinolysis depends on the concentration and generation of the dendrimer and that G3 and G4 PAMAM dendrimers adversely affected human endothelium.
Here, the AFM study of G0 and G0/ZnPc conjugates, followed by textural analysis in terms of the root mean square surface roughness (Rq), the surface roughness (Ra), the mean media (Z1/2), mode (Zmp) and range (Rt) heights, the maximum valley depth (Rmvd), the maximum peak height (Rmph), skewness (Rsk), kurtosis (Rku), fractal dimension and Minkowski functionals, shows interesting results. First, the adsorption and aggregation of G0 on human tissue differs greatly from those on a flat inorganic material. Indeed, from the AFM images and the corresponding statistical analysis, it is shown that G0 are more or less monodisperse on the latter, while they spread more uniformly on the human tissue. Furthermore, differences on the local morphological characteristics of plain symptomatic and asymptomatic tissues were found. These differences, in correlation with the EPR effect, lead to selective aggregation of the dendrimers to the atheromatous carotid tissues. This is evident from the opposite signs of the relative difference of the fractal dimensions as well as from the behaviour of the Minkowski functional curves.
The conjugation of ZnPcs to G0 provides significant changes of surface roughness parameters compared to the dendrimers alone and the skewness and kurtosis parameters show significant distortions of PDF’s and aggregation features under G0/ZnPc loading. It seems that the addition of the hydrophobic ZnPcs counterbalances the effects of PAMAM dendrimers on the atheromatous carotid tissue, suggesting that both the surface type and the drug composition mediate the drug delivery efficiency, in full agreement with previous nanothermodynamic studies of nanoparticles on surfaces [28,83].
Indeed, it is known that phospholipids of the cellular membrane extend their hydrophilic head to the outer cell environment [12] and that the environment around a cell membrane is hydrophilic. The cell membrane is being spanned by transmembrane proteins; these proteins usually have their N-terminal domain extracellular, and the C-terminal domain is found in the inner cell. Thus, the application of the hydrophobic environment around a cell membrane could change the hydrophilic interactions between transmembrane proteins and the extracellular matrix (ECM), which leads to a partial disorder of balance in the cell and its outer environment due to different thermodynamic environments and polar-entropic competition at the nanoscale [83]. Nanoparticle encapsulation and change of local thermodynamic environment enhance image contrast in computer tomography of atheromatous plaque [84]. Finally, large morphological differences between tissue and individual endothelial, SMC and THP1 cells, Figure 15 and Additional file 3: Table S3.1, imply different nanodrug uptake efficiency by individual cells and further studies are needed towards this direction.
Figure 15.
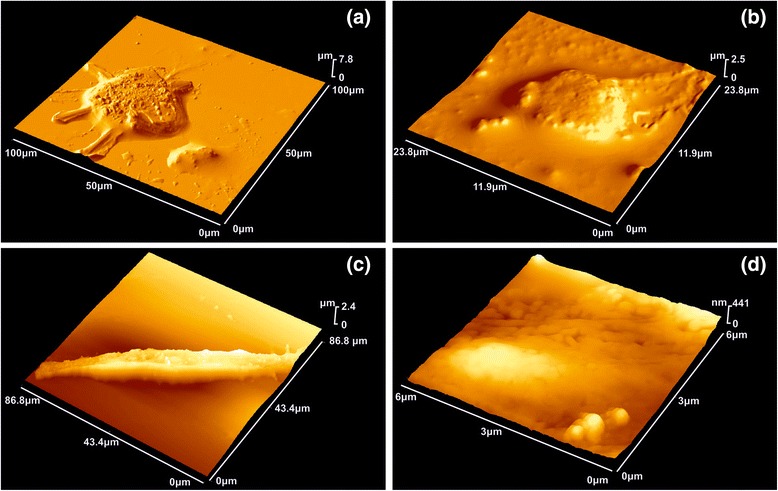
AFM images of individual endothelial, THP-1 and SMC cells. (a) Human Brachiocephalic Artery Endothelial Cell (HBcAEC-ECACC™) isolated from normal brachiocephalic arteries. (b) THP-1 (ATCC®TIB-202™) cell derived from a 1-year-old boy with leukemia. (c) Human Brachiocephalic Artery SMC cell (HBcASMC ECACC™) isolated from normal brachiocephalic arteries. (d) AFM image of endothelial cell at higher magnification. The statistical surface parameters of individual cells and healthy arteries differ significantly, Additional file 3, suggesting dissimilar nanodrug uptake efficiency between tissue and individual cell.
Conclusions
In conclusion, the results of this work show that the addition of G0 PAMAM dendrimers or G0 PAMAM/ZnPc conjugates to the carotid tissue, either healthy or atheromatous, significantly alters the local texture characteristics of human carotids at the nanoscale, indicating different agglomerating responses of the G0 NPs. Most importantly, all statistical quantities showed that the deposition of nanodrug carriers on the healthy tissue seems to have an inverse impact in comparison to the deposition on atheromatous tissue, clearly suggesting the small size agglomeration of G0 NPs on the healthy tissue, with a particle size less than the surface roughness parameters of the tissue. In addition, different size agglomeration between G0 and G0/ZnPc and selective aggregation of the dendrimers to the atheromatous carotid tissues is observed. However, in addition to the size and composition of G0 aggregates, the penetration of dendrimers across the endothelial barrier depends on other important features, such as concentration, incubation time, efflux transport, surface charge, modification [85], local thermodynamic conditions [28] and polar-entropic competition [83]; therefore, future studies comprising all these parameters are necessary.
Acknowledgements
Partial financial support from the European Union, under the FP7-NMP-2012-LARGE-6 ‘CosmoPhos-Nano’ project (reference number: 310337), and from the Russian government, under Grant No. 02.A03.21.0002, is gratefully acknowledged. The authors are thankful to Professor G. Oszkinis, Poznan University of Medical Sciences, Clinic of General and Vascular Surgery, Clinical Hospital No. 1, Poland, for providing the surgical tissues and Dr. D. Palles for recording the μ-Raman spectrum.
Additional files
Surface roughness parameters of healthy and atheromatous human tissues loaded with G0 and G0/ZnPc conjugated nanodrugs. The root mean square surface roughness (R q), the surface roughness (R a), the mean media (Z 1/2), mode (Z mp) and range (R t) heights, the maximum valley depth (R mvd), the maximum peak height (R mph), skewness (R sk) and kurtosis (R ku) of healthy and atheromatous human tissues loaded with G0 PAMAM and G0/ZnPc conjugated nanodrugs are tabulated. Statistical analysis suggests that both the surface type and the drug composition mediate the drug delivery efficiency.
AFM images, line analysis and size distribution of ZnPc nanoparticles on Au and Si surfaces. Size statistics of aggregation of ZnPc nanoparticles on gold (Au) and Si standard test surfaces is different than the aggregation of G0 on the same surfaces. ZnPc nanoparticles tend to aggregate at average sizes much higher than the surface roughness parameters of the test surfaces. This response is owing to the presence of electron charges on the surface of ZnPc nanoparticles and demonstrated by conductive atomic force microscopy. In case of conjugation of ZnPc with the G0 dendrimers, the negative charges are compensated to give nearly neutral nanoparticles of smaller size.
Surface roughness parameters of individual endothelial, THP-1 cells and SMC and preparation of cell cultures. Table S3.1. Surface roughness parameters of individual endothelial, THP-1 cells and SMC. Surface roughness parameters of THP-1 (ATCC®TIB-202™), HBcAEC (ECACC) and HBcASMC (ECACC) cell lines. They are different from the atheromatous surface roughness parameters, indicating dissimilar nanodrug uptaking efficiency. Table S3.2. Preparation of cell cultures. THP-1 (ATCC®TIB-202™), HBcAEC (ECACC) and HBcASMC (ECACC) cell lines were used. All cell cultures were performed in an incubator at a 95% w/w ambient air, 5% w/w CO2 gaseous environment and the temperature is maintained at 37°C.
Footnotes
Competing interests
The authors declare that they have no competing interests.
Authors’ contributions
NSA performed the fractal analysis, interpreted the results and drafted the manuscript. ES designed the study and carried out the AFM imaging. ALS handled and prepared the biological human samples and edited and analysed the biological methodologies of the manuscript. ZK participated in the AFM imaging. VEG crafted the statistical analysis. VVS and ASN critically evaluated the manuscript and participated in the study. PNT conceived the idea for using G0/ZnPc in the PDT therapy of atheromatous plaque. AB, PSP and SK prepared and treated the human endothelial, THP-1 and SMC cells. ACC conceived the work on fractal analysis and methodologies, interpreted the results and also participated in the study. All authors read and approved the final manuscript.
Authors’ information
Alkiviadis-Constantinos Cefalas is a Visiting Professor at Physics Department, Kazan Federal University, Russia.
Contributor Information
Nikolaos Spyropoulos-Antonakakis, Email: nspyropoulos@eie.gr.
Evangelia Sarantopoulou, Email: esarant@eie.gr.
Panagiotis N Trohopoulos, Email: panagiotis.trochopoulos@cosmophos.com.
Aikaterina L Stefi, Email: kstefi@eie.gr.
Zoe Kollia, Email: zkollia@eie.gr.
Vassilios E Gavriil, Email: vgavriil@eie.gr.
Athanasia Bourkoula, Email: nancyb@rrp.demokritos.gr.
Panagiota S Petrou, Email: ypetrou@rrp.demokritos.gr.
Sotirios Kakabakos, Email: skakab@rrp.demokritos.gr.
Vadim V Semashko, Email: ua4pcy@mail.ru.
Alexey S Nizamutdinov, Email: anizamutdinov@mail.ru.
Alkiviadis-Constantinos Cefalas, Email: ccefalas@eie.gr.
References
- 1.Cicha I, Lyer S, Alexiou C, Garlichs CD. Nanomedicine in diagnostics and therapy of cardiovascular diseases: beyond atherosclerotic plaque imaging. Nanotechnol Rev. 2013;2:449–72. [Google Scholar]
- 2.Whitesides GM. The ‘right’ size in nanobiotechnology. Nat Biotechnol. 2003;21:1161–5. doi: 10.1038/nbt872. [DOI] [PubMed] [Google Scholar]
- 3.Nam JM, Thaxton CS, Mirkin CA. Nanoparticle-based bio-barcodes for the ultrasensitive detection of proteins. Science. 2003;301:1884–6. doi: 10.1126/science.1088755. [DOI] [PubMed] [Google Scholar]
- 4.Tsapis N, Bennett D, Jackson B, Weitz DA, Edwards DA. Trojan particles: large porous carriers of nanoparticles for drug delivery. Proc Natl Acad Sci U S A. 2002;99:12001–5. doi: 10.1073/pnas.182233999. [DOI] [PMC free article] [PubMed] [Google Scholar]
- 5.Jeong W, Kim MJ, Rhee K. Computational study of particle size effects on selective binding of nanoparticles in arterial stenosis. Comput Biol Med. 2013;43:417–24. doi: 10.1016/j.compbiomed.2013.02.004. [DOI] [PubMed] [Google Scholar]
- 6.Libby P, Ridker PM, Hansso GK. Progress and challenges in translating the biology of atherosclerosis. Nature. 2011;473:317–25. doi: 10.1038/nature10146. [DOI] [PubMed] [Google Scholar]
- 7.Tabas I. Macrophage death and defective inflammation resolution in atherosclerosis. Nature. 2010;10:36–46. doi: 10.1038/nri2675. [DOI] [PMC free article] [PubMed] [Google Scholar]
- 8.Peng C, Li Y, Liang H, Cheng J, Li Q, Sun X, et al. Detection and photodynamic therapy of inflamed atherosclerotic plaques in the carotid artery of rabbits. J Photochem and Photobiol B: Biology. 2011;102:26–31. doi: 10.1016/j.jphotobiol.2010.09.001. [DOI] [PubMed] [Google Scholar]
- 9.Dolmans DE, Fukumura D, Jain RK. Photodynamic therapy for cancer. Nat Rev Cancer. 2003;3:380–7. doi: 10.1038/nrc1071. [DOI] [PubMed] [Google Scholar]
- 10.Chatterjee DK, Fong LS, Zhang Y. Nanoparticles in photodynamic therapy: an emerging paradigm. Adv Drug Deliv Rev. 2008;60:1627–37. doi: 10.1016/j.addr.2008.08.003. [DOI] [PubMed] [Google Scholar]
- 11.Kim J, Santos OA, Park JH. Selective photosensitizer delivery into plasma membrane for effective photodynamic therapy. J Control Release. 2014;191:98–104. doi: 10.1016/j.jconrel.2014.05.049. [DOI] [PubMed] [Google Scholar]
- 12.Barua S, Mitragotri S. Challenges associated with penetration of nanoparticles across cell and tissue barriers: A review of current status and future prospects. Nano Today. 2014;9:223–43. doi: 10.1016/j.nantod.2014.04.008. [DOI] [PMC free article] [PubMed] [Google Scholar]
- 13.de Vries HE, Moor AC, Dubbelman TM, van Berkel TJ, Kuiper J. Oxidized low-density lipoprotein as a delivery system for photosensitizers: implications for photodynamic therapy of atherosclerosis. J Pharmacol Exp Ther. 1999;289:528–34. [PubMed] [Google Scholar]
- 14.McCarthy JR, Korngold E, Weissleder R, Jaffer FA. A light-activated theranostic nanoagent for targeted macrophage ablation in inflammatory atherosclerosis. Small. 2010;6:2041–9. doi: 10.1002/smll.201000596. [DOI] [PMC free article] [PubMed] [Google Scholar]
- 15.Choi Y, McCarthy JR, Weissleder R, Tung C-H. Conjugation of a photosensitizer to an oligoarginine-based cell-penetrating peptide increases the efficacy of photodynamic therapy. Chem Med Chem. 2006;1:458–63. doi: 10.1002/cmdc.200500036. [DOI] [PubMed] [Google Scholar]
- 16.McCarthy JR, Weissleder R. Model systems for fluorescence and singlet oxygen quenching by metalloporphyrins. Chem Med Chem. 2007;2:360–5. doi: 10.1002/cmdc.200600244. [DOI] [PubMed] [Google Scholar]
- 17.McCarthy JR, Jaffer FA, Weissleder R. Macrophage-targeted theranostic nanoparticle for biomedical applications. Small. 2006;2:983–7. doi: 10.1002/smll.200600139. [DOI] [PubMed] [Google Scholar]
- 18.Wang A, Long L, Zhang C. Synthesis and properties of photo-activable phthalocyanines: a brief overview. J Inclusion Phenom Macrocyclic Chem. 2011;71:1–24. doi: 10.1007/s10847-010-9918-x. [DOI] [Google Scholar]
- 19.Chen Z, Xu P, Chen J, Chen H, Hu P, Chen X, et al. Zinc phthalocyanine conjugated with the amino-terminal fragment of urokinase for tumor-targeting photodynamic therapy. Acta Biomater. 2014;10:4257–68. doi: 10.1016/j.actbio.2014.06.026. [DOI] [PubMed] [Google Scholar]
- 20.Liu W, Jensen TJ, Fronczek FR, Hammer RP, Smith KM, Vicente MG. Synthesis and cellular studies of non aggregated water-soluble phthalocyanines. J Med Chem. 2005;48:1033–41. doi: 10.1021/jm049375b. [DOI] [PubMed] [Google Scholar]
- 21.Konan YN, Gurny R, Allémann E. State of the art in the delivery of photosensitizers for photodynamic therapy. J Photochem Photobiol B. 2002;66:89–106. doi: 10.1016/S1011-1344(01)00267-6. [DOI] [PubMed] [Google Scholar]
- 22.Roy I, Ohulchanskyy TY, Pudavar HE, Bergey EJ, Oseroff AR, Morgan J, et al. Ceramic-based nanoparticles entrapping water-insoluble photosensitizing anticancer drugs: a novel drug-carrier system for photodynamic therapy. J Am Chem Soc. 2003;125:7860–5. doi: 10.1021/ja0343095. [DOI] [PubMed] [Google Scholar]
- 23.Brasch M, de la Escosura A, Ma Y, Uetrecht C, Heck AJ, Torres T, et al. Encapsulation of phthalocyanine supramolecular stacks into virus-like particles. J Am Chem Soc. 2011;133:6878–81. doi: 10.1021/ja110752u. [DOI] [PubMed] [Google Scholar]
- 24.Mitsunaga M, Ogawa M, Kosaka N, Rosenblum LT, Choyke PL, Kobayashi H. Cancer cell-selective in vivo near infrared photoimmunotherapy targeting specific membrane molecules. Nat Med. 2010;17:1685–91. doi: 10.1038/nm.2554. [DOI] [PMC free article] [PubMed] [Google Scholar]
- 25.Nishiyama N, Morimoto Y, Jang WD, Kataoka K. Design and development of dendrimer photosensitizer-incorporated polymeric micelles for enhanced photodynamic therapy. Adv Drug Deliv Rev. 2009;61:327–38. doi: 10.1016/j.addr.2009.01.004. [DOI] [PubMed] [Google Scholar]
- 26.Pang X, Yang X, Zhai G. Polymer-drug conjugates: recent progress on administration routes. Expert Opin Drug Deliv. 2014;11:1075–86. doi: 10.1517/17425247.2014.912779. [DOI] [PubMed] [Google Scholar]
- 27.Mojzisova H, Bonneau S, Brault D. Structural and physico-chemical determinants of the interactions of macrocyclic photosensitizers with cells. EurBiophys J. 2007;36:943–53. doi: 10.1007/s00249-007-0204-9. [DOI] [PubMed] [Google Scholar]
- 28.Stefi AL, Sarantopoulou E, Kollia Z, Spyropoylos-Antonakakis N, Bourkoula A, Petrou PS, et al. Nanothermodynamics mediates drug delivery. Adv Exp Med Biol. 2015;822:213–30. doi: 10.1007/978-3-319-08927-0_28. [DOI] [PubMed] [Google Scholar]
- 29.Dement’eva OV, Vinogradova MM, Luk’yanets EA, Solov’eva LI, Ogarev VA, Rudoy VM. Zinc phthalocyanine-based water-soluble thiolated photosensitizer and its conjugates with gold nanoparticles: synthesis and spectral properties. Colloid J. 2014;76:539–45. doi: 10.1134/S1061933X14050068. [DOI] [Google Scholar]
- 30.da Volta SM, Oliveira MR, dos Santos EP, de BritoGitirana L, Barbosa GM, Quaresma CH, et al. Nanostructured delivery system for zinc phthalocyanine: preparation, characterization, and phototoxicity study against human lung adenocarcinoma A549 cells. Int J Nanomedicine. 2011;6:227–38. doi: 10.2147/IJN.S15860. [DOI] [PMC free article] [PubMed] [Google Scholar]
- 31.Liang R, Tian R, Ma L, Zhang L, Hu Y, Wang J, et al. A supermolecular photosensitizer with excellent anticancer performance in photodynamic therapy. Adv Funct Mater. 2014;24:3144–51. doi: 10.1002/adfm.201303811. [DOI] [Google Scholar]
- 32.Shang T, Wang CD, Ren L, Tian XH, Li DH, Ke XB, et al. Synthesis and characterization of NIR-responsive Aurod@pNIPAAm-PEGMA nanogels as vehicles for delivery of photodynamic therapy agents. Nanoscale Res Lett. 2013;8:4. doi: 10.1186/1556-276X-8-4. [DOI] [PMC free article] [PubMed] [Google Scholar]
- 33.Ricci-Junior E, Marchetti JM. Zinc (II) phthalocyanine loaded PLGA nanoparticles for photodynamic therapy use. Int J Pharm. 2006;310:187–95. doi: 10.1016/j.ijpharm.2005.10.048. [DOI] [PubMed] [Google Scholar]
- 34.Conte C, Ungaro F, Maglio G, Tirino P, Siracusano G, Sciortino MT, et al. Biodegradable core-shell nanoassemblies for the delivery of docetaxel and Zn (II)-phthalocyanine inspired by combination therapy for cancer. J Control Release. 2013;167:40–52. doi: 10.1016/j.jconrel.2012.12.026. [DOI] [PubMed] [Google Scholar]
- 35.Li L, Luo Z, Chen Z, Chen J, Zhou S, Xu P, et al. Enhanced photodynamic efficacy of zinc phthalocyanine by conjugating to heptalysine. Bioconjug Chem. 2012;23:2168–72. doi: 10.1021/bc3002997. [DOI] [PubMed] [Google Scholar]
- 36.Tu J, Wang T, Shi W, Wu G, Tian X, Wang Y, et al. Multifunctional ZnPc-loaded mesoporous silica nanoparticles for enhancement of photodynamic therapy efficacy by endolysosomal escape. Biomaterials. 2012;33:7903–14. doi: 10.1016/j.biomaterials.2012.07.025. [DOI] [PubMed] [Google Scholar]
- 37.Abbasi E, Aval SF, Akbarzadeh A, Milani M, Nasrabadi HT, Joo SW, et al. Dendrimers: synthesis, applications, and properties. Nanoscale Res Lett. 2014;9:247. doi: 10.1186/1556-276X-9-247. [DOI] [PMC free article] [PubMed] [Google Scholar]
- 38.Lu HL, Syu WJ, Nishiyama N, Kataoka K, Lai PS. Dendrimer phthalocyanine-encapsulated polymeric micelle-mediated photochemical internalization extends the efficacy of photodynamic therapy and overcomes drug-resistance in vivo. J Control Release. 2011;155:458–64. doi: 10.1016/j.jconrel.2011.06.005. [DOI] [PubMed] [Google Scholar]
- 39.Shcharbin D, Janaszewska A, Klajnert-Maculewicz B, Ziemba B, Dzmitruk V, Halets I, et al. How to study dendrimers and dendriplexes III. Biodistribution pharmacokinetics and toxicity in vivo. J Control Release. 2014;181:40–52. doi: 10.1016/j.jconrel.2014.02.021. [DOI] [PubMed] [Google Scholar]
- 40.Tomalia DA, Baker H, Dewald J, Hall M, Kallos G, Martin S, et al. A new class of polymers: starburst-dendritic macromolecules. Polym J. 1985;17:117–32. doi: 10.1295/polymj.17.117. [DOI] [Google Scholar]
- 41.Kannan RM, Nance E, Kannan S, Tomalia DA. Emerging concepts in dendrimer-based nanomedicine: from design principles to clinical applications. J Int Med. 2014;276:579–617. doi: 10.1111/joim.12280. [DOI] [PubMed] [Google Scholar]
- 42.Tomalia DA, Christensen JB, Baos U. Dendrimers, dendrons, and dendritic polymers: discovery, applications, and the future. New York: Cambridge University Press; 2012. [Google Scholar]
- 43.Pourianazar NT, Mutlu P, Gunduz U. Bioapplications of poly (amidoamine) (PAMAM) dendrimers in nanomedicine. J Nanopart Res. 2014;16:2342. doi: 10.1007/s11051-014-2342-1. [DOI] [Google Scholar]
- 44.Svenson S, Tomalia DA. Dendrimers in biomedical applications—reflections on the field. Adv Drug Del Rev. 2005;57:2106–29. doi: 10.1016/j.addr.2005.09.018. [DOI] [PubMed] [Google Scholar]
- 45.Gupta AS. Nanomedicine approaches in vascular disease: a review. Nanomedicine. 2011;7:763–79. doi: 10.1016/j.nano.2011.04.001. [DOI] [PubMed] [Google Scholar]
- 46.Caminade AM, Turrin CO. Dendrimers for drug delivery. J Mater Chem B. 2014;2:4055–66. doi: 10.1039/c4tb00171k. [DOI] [PubMed] [Google Scholar]
- 47.Mammen M, Choi SK, Whitesides GM. Polyvalent interactions in biological systems: implications for design and use of multivalent ligands and inhibitors. Angew Chem Int Ed. 1998;37:2754–94. doi: 10.1002/(SICI)1521-3773(19981102)37:20<2754::AID-ANIE2754>3.0.CO;2-3. [DOI] [PubMed] [Google Scholar]
- 48.Skordoulis C, Spyrou S, Cefalas AC. Gain and saturation measurements in a discharge excited F2 laser using an oscillator amplifier configuration. Appl Phys B-Lasers Opt. 1990;51:141–5. doi: 10.1007/BF00326015. [DOI] [Google Scholar]
- 49.Skordoulis C, Sarantopoulou E, Spyrou S, Cefalas AC. Amplification characteristics of a discharge excited F2 laser. J Mod Opt. 1990;37:501–9. doi: 10.1080/09500349014550581. [DOI] [Google Scholar]
- 50.Cefalas AC. Current trends in 157 nm dry lithography. Appl Surf Sci. 2005;247:577–83. doi: 10.1016/j.apsusc.2005.01.139. [DOI] [Google Scholar]
- 51.Douvas AM, Petrou PS, Kakabakos SE, Misiakos K, Argitis P, Sarantopoulou E, et al. 157-nm laser ablation of polymeric layers for fabrication of biomolecule microarrays. Anal Bioanal Chem. 2005;381:1027–32. doi: 10.1007/s00216-004-2985-3. [DOI] [PubMed] [Google Scholar]
- 52.Cefalas AC, Argitis P, Kollia Z, Sarantopoulou E, Ford TW, Stead AD, et al. Laser plasma x-ray contact microscopy of living specimens using a chemically amplified epoxy resist. Appl Phys Lett. 1998;72:3258–60. doi: 10.1063/1.121616. [DOI] [Google Scholar]
- 53.Horcas I, Fernández R, Gómez-Rodríguez JM, Colchero J, Gómez-Herrero J, Baro AM. WSXM: a software for scanning probe microscopy and a tool for nanotechnology. Rev Sci Instrum. 2007;78:013705. doi: 10.1063/1.2432410. [DOI] [PubMed] [Google Scholar]
- 54.Niu L, Qian M, Yang W, Meng L, Xiao Y, Wong KKL, et al. Surface roughness detection of arteries via texture analysis of ultrasound images for early diagnosis of atherosclerosis. Plos One. 2013;8:e76880. doi: 10.1371/journal.pone.0076880. [DOI] [PMC free article] [PubMed] [Google Scholar]
- 55.Mandelbrot BB. The fractal geometry of nature. New York: Freeman; 1983. [Google Scholar]
- 56.Zmeskal O, Dzik P, Vesely M. Entropy of fractal systems. Comput Math Appl. 2013;66:135–46. doi: 10.1016/j.camwa.2013.01.017. [DOI] [Google Scholar]
- 57.Popescu DP, Flueraru C, Mao Y, Chang S, Sowa MG. Signal attenuation and box-counting fractal analysis of optical coherence tomography images of arterial tissue. Biomed Opt Express. 2010;1:268–77. doi: 10.1364/BOE.1.000268. [DOI] [PMC free article] [PubMed] [Google Scholar]
- 58.Di Giovanni P, Ahearn TS, Semple SI, Lovell LM, Miller I, Gilbert FJ, et al. The biological correlates of macroscopic breast tumour structure measured using fractal analysis in patients undergoing neoadjuvant chemotherapy. Breast Cancer Res Treat. 2012;133:1199–206. doi: 10.1007/s10549-012-2014-8. [DOI] [PubMed] [Google Scholar]
- 59.Katsaloulis P, Verganelakis DA, Provata A. Fractal dimension and lacunarity of tractography images of the human brain. Fractals. 2009;17:181–9. doi: 10.1142/S0218348X09004284. [DOI] [Google Scholar]
- 60.Asvestas P, Golemati S, Matsopoulos GK, Nikita KS, Nicolaides AN. Fractal dimension estimation of carotid atherosclerotic plaques from b-mode ultrasound: a pilot study. Ultrasound Med Biol. 2002;28:1129–36. doi: 10.1016/S0301-5629(02)00550-1. [DOI] [PubMed] [Google Scholar]
- 61.Rakebrandt F, Crawford DC, Havard D, Coleman D, Woodcock JP. Relationship between ultrasound texture classification images and histology of atherosclerotic plaque. Ultrasound Med Biol. 2000;26:1393–402. doi: 10.1016/S0301-5629(00)00314-8. [DOI] [PubMed] [Google Scholar]
- 62.Krasowska M, Grzywna ZJ, Mycielska ME, Djamgoz MB. Fractal analysis and ionic dependence of endocytotic membrane activity of human breast cancer cells. Eur Biophys J. 2009;38:1115–25. doi: 10.1007/s00249-009-0516-z. [DOI] [PubMed] [Google Scholar]
- 63.Fuseler JW, Millette CF, Davis JM, Carver W. Fractal and image analysis of morphological changes in the actin cytoskeleton of neonatal cardiac fibroblasts in response to mechanical stretch. Microsc Microanal. 2007;13:133–43. doi: 10.1017/S1431927607070225. [DOI] [PubMed] [Google Scholar]
- 64.Bitler A, Dover R, Shai Y. Fractal properties of macrophage membrane studied by AFM. Micron. 2012;43:1239–45. doi: 10.1016/j.micron.2012.04.009. [DOI] [PubMed] [Google Scholar]
- 65.Salerno M, Giacomelli L, Derchi G, Patra N, Diaspro A. Atomic force microscopy in vitro study of surface roughness and fractal character of a dental restoration composite after air-polishing. Biomed Eng Online. 2010;9:59. doi: 10.1186/1475-925X-9-59. [DOI] [PMC free article] [PubMed] [Google Scholar]
- 66.Něcas D, Klapetek P. Gwyddion: an open-source software for SPM data analysis. Cent Eur J Phys. 2012;10:181–8. [Google Scholar]
- 67.Mannelquist A, Almqvist N, Fredriksson S. Influence of tip geometry on fractal analysis of atomic force microscopy images. Appl Phys A. 1998;66:S891–5. doi: 10.1007/s003390051262. [DOI] [Google Scholar]
- 68.Smith RL, Mecholsky JJ., Jr Application of atomic force microscopy in determining the fractal dimension of the mirror, mist, and hackle region of silica glass. Mater Charact. 2011;62:457–62. doi: 10.1016/j.matchar.2011.03.001. [DOI] [Google Scholar]
- 69.Lillehei PT, Kim JW, Gibbons LJ, Park C. A quantitative assessment of carbon nanotube dispersion in polymer matrices. Nanotechnology. 2009;20:325708. doi: 10.1088/0957-4484/20/32/325708. [DOI] [PubMed] [Google Scholar]
- 70.Mecke KR. Morphological characterization of patterns in reaction–diffusion systems. Phys Rev E. 1996;53:4794–800. doi: 10.1103/PhysRevE.53.4794. [DOI] [PubMed] [Google Scholar]
- 71.Michielsen K, De Raedt H. Integral-geometry morphological image analysis. Phys Rep. 2001;347:461–538. doi: 10.1016/S0370-1573(00)00106-X. [DOI] [Google Scholar]
- 72.Lobatto ME, Fuster V, Fayad ZA, Mulder WJ. Perspectives and opportunities for nanomedicine in the management of atherosclerosis. Nat Rev Drug Discov. 2011;10:835–52. doi: 10.1038/nrd3578. [DOI] [PMC free article] [PubMed] [Google Scholar]
- 73.Jiang W, Kim BYS, Rutka JT, Chan WCW. Nanoparticle-mediated cellular response is size-dependent. Nat Nanotechnol. 2008;3:145–50. doi: 10.1038/nnano.2008.30. [DOI] [PubMed] [Google Scholar]
- 74.Mecke A, Lee I, Baker JR, Jr, Holl MM, Orr BG. Deformability of poly (amidoamine) dendrimers. Eur Phys J E Soft Matter. 2004;14:7–16. doi: 10.1140/epje/i2003-10087-5. [DOI] [PubMed] [Google Scholar]
- 75.Cahill BP, Papastavrou G, Koper GJ, Borkovec M. Adsorption of poly (amido amine) (PAMAM) dendrimers on silica: importance of electrostatic three-body attraction. Langmuir. 2008;24:465–73. doi: 10.1021/la7021352. [DOI] [PubMed] [Google Scholar]
- 76.Li J, Piehler LT, Qin D, Baker JR, Jr, Tomalia DA, Meier DJ. Visualization and characterization of poly (amidoamine) dendrimers by atomic force microscopy. Langmuir. 2000;16:5613–6. doi: 10.1021/la000035c. [DOI] [Google Scholar]
- 77.Yu L, Zhang P, Yang H, Yang G, Zhang J, Wang J. Aggregation behaviors of novel amphiphilic dendrimers at solid–liquid interface. J Dispersion Sci Technol. 2014;35:456–62. doi: 10.1080/01932691.2013.785917. [DOI] [Google Scholar]
- 78.Müller T, Yablon DG, Karchner R, Knapp D, Kleinman MH, Fang H, et al. AFM studies of high-generation PAMAM dendrimers at the liquid/solid interface. Langmuir. 2002;18:7452–5. doi: 10.1021/la0200461. [DOI] [Google Scholar]
- 79.Dobrovolskaia MA, Patri AK, Simak J, Hall JB, Semberova J, de Paoli Lacerda SH, et al. Nanoparticle size and surface charge determine effects of PAMAM dendrimers on human platelets in vitro. Mol Pharm. 2012;9:382–93. doi: 10.1021/mp200463e. [DOI] [PMC free article] [PubMed] [Google Scholar]
- 80.Hemmer R, Hall A, Spaulding R, Rossow B, Hester M, Caroway M, et al. Analysis of biotinylated generation 4 poly (amidoamine) (PAMAM) dendrimer distribution in the rat brain and toxicity in a cellular model of the blood–brain barrier. Molecules. 2013;18:11537–52. doi: 10.3390/molecules180911537. [DOI] [PMC free article] [PubMed] [Google Scholar]
- 81.Kitchens KM, El-Sayed ME, Ghandehari H. Transepithelial and endothelial transport of poly (amidoamine) dendrimers. Adv Drug Deliv Rev. 2005;57:2163–76. doi: 10.1016/j.addr.2005.09.013. [DOI] [PubMed] [Google Scholar]
- 82.Markowicz-Piasecka M, Łuczak E, Chałubiński M, Broncel M, Mikiciuk-Olasik E, Sikora J. Studies towards biocompatibility of PAMAM dendrimers–overall hemostasis potential and integrity of the human aortic endothelial barrier. Int J Pharm. 2014;473:158–69. doi: 10.1016/j.ijpharm.2014.07.002. [DOI] [PubMed] [Google Scholar]
- 83.Cefalas AC, Sarantopoulou E, Kollia Z, Kitsara M, Raptis I, Bakalis E. Entropic Nanothermodynamic potential from molecular trapping within photon induced nano-voids in photon processed PDMS layers. Soft Matt. 2012;8:5561–73. doi: 10.1039/c2sm07141j. [DOI] [Google Scholar]
- 84.Ye K, Qin J, Peng Z, Yang X, Huang L, Yuan F, et al. Polyethylene glycol-modified dendrimer-entrapped gold nanoparticles enhance CT imaging of blood pool in atherosclerotic mice. Nanoscale Res Lett. 2014;9:529–41. doi: 10.1186/1556-276X-9-529. [DOI] [PMC free article] [PubMed] [Google Scholar]
- 85.Kim Y, Kwak Y, Chang R. Free energy of PAMAM dendrimer adsorption onto model biological membrane. J Phys Chem B. 2014;118:6792–802. doi: 10.1021/jp501755k. [DOI] [PubMed] [Google Scholar]