Background: Resistance toward imatinib (IM) hinders the treatment of advanced stage chronic myeloid leukemia (CML).
Results: Induction of HO-1 contributed to the survival of K562R cells and IM-insensitive CML patients' cells during IM exposure.
Conclusion: HO-1 had anti-apoptotic effects on IM-resistant CML cells.
Significance: Inducing HO-1 expression via the PKC-β/p38-MAPK pathway may promote tumor resistance to oxidative stress.
Keywords: chronic myelogenous leukemia (CML), drug resistance, heme oxygenase, p38 MAPK, protein kinase C (PKC), Na+/H+ ion exchanger 1, imatinib resistance, p38/mitogen-activated protein kinase
Abstract
Resistance toward imatinib (IM) and other BCR/ABL tyrosine kinase inhibitors remains troublesome in the treatment of advanced stage chronic myeloid leukemia (CML). The aim of this study was to estimate the reversal effects of down-regulation of Na+/H+ exchanger 1 (NHE1) on the chemoresistance of BCR-ABL-positive leukemia patients' cells and cell lines. After treatment with the specific NHE1 inhibitor cariporide to decrease intracellular pH (pHi), the heme oxygenase-1 (HO-1) levels of the K562R cell line and cells from IM-insensitive CML patients decreased. HO-1, as a Bcr/Abl-dependent survival molecule in CML cells, is important for the resistance to tyrosine kinase inhibitors in patients with newly diagnosed CML or IM-resistant CML. Silencing PKC-β and Nrf-2 or treatment with inhibitors of p38 pathways obviously blocked NHE1-induced HO-1 expression. Furthermore, treatment with HO-1 or p38 inhibitor plus IM increased the apoptosis of the K562R cell line and IM-insensitive CML patients' cells. Inhibiting HO-1 enhanced the activation of caspase-3 and poly(ADP-ribose) polymerase-1. Hence, the results support the anti-apoptotic role of HO-1 induced by NHE1 in the K562R cell line and IM-insensitive CML patients and provide a mechanism by which inducing HO-1 expression via the PKC-β/p38-MAPK pathway may promote tumor resistance to oxidative stress.
Introduction
Chronic myeloid leukemia (CML)2 is characterized by the presence of the Philadelphia chromosome, which forms as a result of a reciprocal translocation between chromosomes 9 and 22 and leads to production of the BCR-ABL1 fusion protein (1–3). The first BCR-ABL1 tyrosine kinase inhibitor, imatinib (IM), has been recommended for the first-line treatment of chronic phase CML and has dramatically increased survival rates since its introduction (4–6). Nonetheless, some patients with chronic phase CML resist IM mainly due to mutation in BCR-ABL1 that affects the binding site of IM (7–10). Additionally, some patients are intolerant to IM treatment because of adverse events (11, 12). Novel BCR/ABL inhibitors such as nilotinib (AMN107) and dasatinib (BMS354825) have managed to overcome IM resistance mediated by various BCR/ABL point mutations (13–15). However, the T315I mutation (one of the frequently detected mutations) renders the BCR/ABL oncoprotein completely resistant to these novel tyrosine kinase inhibitors (16, 17).
Heme oxygenase-1 (HO-1) inhibitors PEGylated zinc protoporphyrin (PEG-ZnPP) and styrene-maleic-acid-copolymer-micelle-encapsulated ZnPP (SMA-ZnPP) inhibit the growth of Ba/F3 cells having various IM-resistant mutants of BCR/ABL, including the T315I mutant that renders BCR/ABL resistant to all currently available BCR/ABL tyrosine kinase inhibitors including nilotinib and dasatinib. Furthermore, Mayerhofer et al. (18) found that Hsp32/HO-1-targeting drugs suppressed the growth of primary leukemic cells obtained from patients with IM-resistant CML, including one patient carrying the T315I mutant of BCR/ABL in neoplastic cells.
The Na+/H+ exchanger (NHE) family is involved in numerous physiological processes in mammals, including regulation of intracellular pH (pHi), cell volume control, cytoskeletal organization, heart disease, and cancer. In our previous study, HO-1-mediated IM resistance was reversed by NHE1 inhibition through down-regulating the HO-1 mRNA and protein levels pHi-dependently in BCR-ABL-positive K562R cells and IM-insensitive CML patients' cells. However, the molecular events linking NHE1 and HO-1 remain unclear. In the present study, we firstly compared the correlation between NHE1 activity and HO-1 expression in IM-sensitive and IM-insensitive patients. Using the specific NHE1 inhibitor cariporide and high K+ buffer to rapidly decrease pHi, we investigated the contribution of NHE1 to HO-1-associated IM resistance in K562R cells and further studied the molecular pathways involved in IM-insensitive CML patients' cells as well as in the CML IM-resistant cell line K562R.
EXPERIMENTAL PROCEDURES
Reagents
IM (STI571) was kindly provided by Novartis Pharma AG (Basel, Switzerland). p38/MAPK inhibitor SB203580, PI3K (phosphoinositide-3 kinase inhibitor) inhibitor LY294002, NF-κB (nuclear factor κB) inhibitor BAY11-7082, JNK c-jun N-terminal kinase inhibitor SP600125, MEK1 (mitogen activated protein kinase kinase) inhibitor PD98059, and HO-1 inhibitor ZnPP IX were purchased from Beyotime Institute of Biotechnology (Nantong, China). The NHE1 inhibitor cariporide was purchased from Sigma. FCS was purchased from Green Seasons Co. (Hangzhou, China). RPMI 1640 medium and Iscove's modified Dulbecco's medium were purchased from Gibco. Recombinant human GM-CSF was purchased from R&D Systems (Minneapolis, MN). Antibodies for Western blot analysis were obtained from Cell Signaling Technology (Beverly, MA), and secondary antibodies were purchased from LI-COR Corp (Lincoln, NE). HSYBR quantitative PCR mix mix (with ROX reference dye) was prepared for experiments.
Cell Lines and Cell Culture
Human CML cell line K562 and IM-resistant K562 cells (K562R) were kindly provided by Prof. Guang-Sen Zhang (the Secondary Affiliated Hospital of Xiangya Medical College, Changsha, China). K562 cells were maintained in RPMI 1640 medium with 10% FCS. K562R cells were maintained in RPMI 1640 medium containing 0.1 μm IM.
Patient Samples
From 2010 to 2013, 35 patients who were diagnosed as CML and received standard IM therapy at the Affiliated Hospital of Guiyang Medical College were included in the study after obtainment of oral and written informed consents. Primary leukemic cells were obtained from 18 patients with chronic phase CML, 9 patients with accelerated phase CML, and 8 patients with blast phase CML. The study was approved by the institutional review board (Affiliated Hospital of Guiyang Medical College), and informed consent was obtained in accordance with the Declaration of Helsinki prior to blood donation in each case. The characteristics of the patients are summarized in Table 1. Peripheral blood mononuclear cells (MNCs) and/or bone marrow MNCs were isolated by Ficoll density centrifugation. Isolated MNCs were cultured in RPMI 1640 medium containing 10% FCS in the presence or absence of GM-CSF (100 ng/ml) at 37 °C for up to 7 days.
TABLE 1.
Patients' characteristics and relative expression of HO-1 and NHE1 in patients versus donors
CP, chronic phase; AP, accelerated phase; BP, blast crisis phase; Plt, platelets.
| No. | Gender | Age | CML phase | Imatinib-resistant | WBC | Hb | Plt | Cytogenetics | Folder of HO-1 expression in patients/donors | Folder of NHE-1 expression in patients/donors |
|---|---|---|---|---|---|---|---|---|---|---|
| years | g/liter | g/dl | g/liter | |||||||
| 1 | M | 58 | CP | No | 4.11 | 147 | 109 | t (9:22) | 1.05 ± 0.06 | 1.98 ± 0.05 |
| 2 | M | 23 | CP | No | 3.67 | 137 | 375 | t (9:22) | 2.54 ± 0.03 | 1.76 ± 0.06 |
| 3 | M | 35 | CP | No | 4.02 | 143 | 154 | t (9:22) | 0.98 ± 0.07 | 2.34 ± 0.08 |
| 4 | M | 49 | CP | No | 1.57 | 72 | 13 | t (9:22) | 1.02 ± 0.04 | 0.98 ± 0.09 |
| 5 | M | 29 | CP | No | 3.83 | 145 | 485 | t (9:22) | 1.03 ± 0.06 | 0.79 ± 0.11 |
| 6 | F | 34 | AP | No | 33.93 | 54 | 355 | t (9:22) | 0.46 ± 0.05 | 1.32 ± 0.08 |
| 7 | M | 26 | AP | Yes | 123.4 | 90 | 359 | t (9:22) | 4.12 ± 0.21 | 2.46 ± 0.24 |
| 8 | M | 22 | CP | No | 209.8 | 83 | 629 | t (9:22) | 5.02 ± 0.18 | 3.06 ± 0.15 |
| 9 | F | 39 | CP | No | 12.8 | 111 | 235 | t (9:22) | 1.11 ± 0.08 | 1.00 ± 0.04 |
| 10 | M | 22 | BP | Yes | 24.45 | 102 | 987 | t (9:22) | 1.98 ± 0.11 | 2.57 ± 0.12 |
| 11 | M | 38 | CP | No | 5.36 | 126 | 162 | t (9:22) | 0.84 ± 0.04 | 1.75 ± 0.06 |
| 12 | M | 46 | CP | No | 4.7 | 135 | 133 | t (9:22) | 0.89 ± 0.07 | 2.31 ± 0.07 |
| 13 | M | 22 | BP | Yes | 16.67 | 53 | 24 | t (9:22) | 1.73 ± 0.04 | 1.54 ± 0.08 |
| 14 | M | 45 | AP | Yes | 45.89 | 96 | 18 | t (9:22) | 1.98 ± 0.06 | 1.78 ± 0.06 |
| 15 | F | 55 | AP | No | 9.54 | 49 | 27 | t (9:22) | 1.76 ± 0.09 | 2.98 ± 0.07 |
| 16 | F | 77 | CP | No | 20.14 | 126 | 150 | t (9:22) | 2.40 ± 0.13 | 1.99 ± 0.13 |
| 17 | F | 34 | CP | No | 7.66 | 102 | 18 | t (9:22) | 1.31 ± 0.08 | 2.01 ± 0.07 |
| 18 | F | 45 | AP | Yes | 61.52 | 80 | 307 | t (9:22) | 2.03 ± 0.13 | 2.16 ± 0.09 |
| 19 | M | 46 | BP | Yes | 164 | 39 | 14 | t (9:22) | 3.87 ± 0.23 | 2.56 ± 0.17 |
| 20 | F | 45 | AP | No | 32.19 | 77 | 78 | t (9:22) | 1.89 ± 0.14 | 1.58 ± 0.08 |
| 21 | F | 50 | BP | Yes | 34.63 | 60 | 3 | t (9:22) | 1.26 ± 0.09 | 1.74 ± 0.15 |
| 22 | M | 28 | BP | No | 31.63 | 53 | 286 | t (9:22) | 1.18 ± 0.08 | 1.02 ± 0.06 |
| 23 | M | 43 | CP | No | 14.46 | 90 | 262 | t (9:22) | 2.78 ± 0.07 | 1.05 ± 0.03 |
| 24 | M | 54 | AP | Yes | 105.41 | 137 | 133 | t (9:22) | 0.93 ± 0.06 | 1.19 ± 0.06 |
| 25 | M | 21 | BP | No | 6.35 | 90 | 358 | t (9:22) | 1.79 ± 0.04 | 1.31 ± 0.13 |
| 26 | F | 36 | AP | Yes | 68.89 | 115 | 428 | t (9:22) | 3.50 ± 0.23 | 2.34 ± 0.21 |
| 27 | M | 40 | AP | Yes | 240.65 | 84 | 476 | t (9:22) | 5.30 ± 0.17 | 3.54 ± 0.32 |
| 28 | M | 31 | CP | No | 6.32 | 90 | 86 | t (9:22) | 1.63 ± 0.05 | 1.08 ± 0.07 |
| 29 | M | 85 | CP | No | 0.43 | 53 | 12 | t (9:22) | 2.01 ± 0.04 | 0.89 ± 0.06 |
| 30 | F | 38 | CP | No | 3.98 | 109 | 151 | t (9:22) | 2.54 ± 0.12 | 2.01 ± 0.09 |
| 31 | F | 36 | BP | No | 7.24 | 114 | 337 | t (9:22) | 1.04 ± 0.07 | 0.99 ± 0.08 |
| 32 | M | 26 | CP | No | 7.67 | 137 | 439 | t (9:22) | 1.23 ± 0.11 | 1.12 ± 0.06 |
| 33 | F | 60 | CP | No | 8.59 | 136 | 542 | t (9:22) | 0.95 ± 0.08 | 0.93 ± 0.07 |
| 34 | F | 38 | BP | Yes | 12.85 | 100 | 279 | t (9:22) | 1.24 ± 0.09 | 1.13 ± 0.07 |
| 35 | F | 26 | CP | No | 2.61 | 108 | 140 | t (9:22) | 0.68 ± 0.09 | 0.94 ± 0.08 |
Construction of Recombinant Lentiviral Vector and Transfections
Self-prepared recombinant lentivirus-V5-D-TOPO-HO-1-EGFP and control vector lentivirus-V5-D-TOPO-EGFP were co-transfected into 293FT packaging cell line. Supernatant was collected 48 and 72 h after infection to harvest the recombinant virus. Lentivirus-V5-D-TOPO-EGFP-HO-1 and its empty vector were co-transfected into K562R cells. The transfection rate was determined by microscopy (Olympus) and Western blot.
Nrf2 and PKC-β Silencing by siRNA
Cells were seeded on 6-well plates at a density of 2.0 × 10⁵ cells/well and transfected with specific siRNA or scrambled siRNA for 16 h. For each transfection, 1,200 ml of the transfection medium was added to 0.25–1 mg or 10–30 nm of the siRNA duplex/transfection reagent mix (TransPass R2 solution A + B), and the entire volume was added gently to the cells.
Cell Viability Assay
Cells were seeded at a density of 4,000 cells/well in 96-well plates. After overnight incubation, the cells were treated for 24, 48, and 72 h, respectively, with IM, cariporide, and ZnPP IX alone or in combination. The inhibitory effects were determined by using the cell counting kit assay (CCK-8 assay).
Cell Morphology
K562/K562R cells and CML patients' MNCs were plated in 6-well plates at a density of 1 × 10⁷ cells/ml and cultured with 1 μm IM for 24 h. Afterward, culture plates were examined and photographed by an inverted light microscope (Olympus, U-CTR30-2, Tokyo, Japan). After incubation, a staining method using acridine orange (Sigma) and ethidium bromide (Amresco, Solon, OH) was performed. Then, the cells in suspension were collected separately, washed with PBS twice, stained by acridine orange/ethidium bromide solution (100 μg/ml acridine orange and 100 μg/ml ethidium bromide), and photographed using a fluorescence microscope (Olympus BX-51, Tokyo, Japan).
Measurements of pHi
pHi of cells was assessed by flow cytometry using a pH-sensitive fluorescent probe BCECF-AM (Beyotime Institute of Biotechnology) (19). We did not observe any reduction of intracellular BCECF fluorescence intensities in the cell lines, nor was loss of BCECF observed throughout the experiment. Cell suspensions in serum-free RPMI 1640 were washed and labeled with BCECF-AM. The labeled cells were analyzed with an excitation wavelength of 488 nm, and the ratio of the fluorescence at 530 nm to that at 640 nm was plotted versus pHi. To obtain the calibration curve, a linear regression within the pHi range 6.2–7.4 was obtained.
Analysis of NHE-1 Phosphorylation by Immunoprecipitation
Phosphorylation levels of NHE-1 were measured as described by Snabaitis et al. (20). Cells were lysed in ice-cold radioimmunoprecipitation assay buffer as described above and centrifuged at 10,000 × g for 15 min at 4 °C. Supernatants containing proteins were collected and incubated overnight at 4 °C with mouse monoclonal antibody against the phosphor-Ser-14-3-3β protein binding motif (Cell Signaling Technologies) or with goat monoclonal NHE-1 antibody (Santa Cruz Biotechnology). The immunocomplexes obtained were mixed with protein A and G (Merck) for 4 h at 4 °C and then washed three times with ice-cold modified radioimmunoprecipitation assay buffer. Immunocomplexes were dissociated from beads by heating at 100 °C for 5 min. Protein samples from immunocomplexes were resolved on 8% SDS-PAGE and analyzed by immunoblotting using goat polyclonal NHE-1 antibody (BD Biosciences) or rabbit monoclonal phosphoserine antibody (Invitrogen).
Real-time PCR Assay
Total RNAs were isolated from cells treated with agents and detected with a real-time PCR detection system (Bio-Rad) by using the SYBR Green PCR super mix (Bio-Rad). Human HO-1 primers were 5′-ACATCTATGTGGCCCTGGAG-3′ (forward) and 5′-TGTTGGGGAAGGTGAAGAAG-3′ (reverse). Human GAPDH primers used as internal control were 5′-GAAGGTGAAGGTCGGAGT-3′ (forward) and 5′-GAAGATGGTGATGGGATTTC-3′ (reverse).
Western Blot Assay
Total proteins were extracted by lysing cells in buffer containing 50 mm Tris, pH 7.4, 150 mm NaCl, 0.5% NP-40 Nonidet P-40, 50 mm NaF, 1 mm Na3VO4, 1 mm phenylmethylsulfonyl fluoride, 25 mg/ml leupeptin, and 25 mg/ml aprotinin. The lysates were cleared by centrifugation, and the supernatants were collected. According to manufacturer's instructions, cytoplasmic proteins were extracted using the Beyotime cytoplasmic protein extraction kit, and cytomembrane proteins were extracted using the Beyotime cytomembrane protein extraction kit. Equal amounts of protein lysate were used for Western blot analyses. Chemiluminescence was detected by exposure to CL-Xposure film (Pierce Biotechnology).
Measurement of Cytosolic Calcium
Control and cariporide-treated cells were collected from the plate using chilled PBS. The cells were centrifuged, and pellets were dissolved in calcium-free buffer (2 ml of 1 m HEPES, 0.5 ml of 20% glucose, 20 ml of Hanks' balanced salt solution). Then the cells were counted by hemocytometer. After 5 μm Fluo-3/AM was added in 1 ml of cell solution at 37 °C for 30 min, the cells were centrifuged, and the pellets were dissolved in calcium-free buffer and transferred in a quartz cuvette. Samples were analyzed by flow cytometry (F = 530 nm).
Analysis of Apoptosis by Flow Cytometry
Cells were harvested, washed with PBS, and stained with the annexin-V/propidium iodide apoptosis kit according to manufacturer's instructions. Apoptotic cells were detected using a FACScan flow cytometer, and the data were analyzed using the CellFit software.
Statistical Analysis
All experiments were repeated three times. Results expressed as mean ± S.D. were analyzed using the Student's t test. Differences were considered significant when p < 0.05. Data were analyzed using SPSS software version 19.0 (SPSS Inc., Chicago, IL).
RESULTS
Effects of NHE1 on pHi and HO-1 Expression in IM-sensitive/insensitive CML
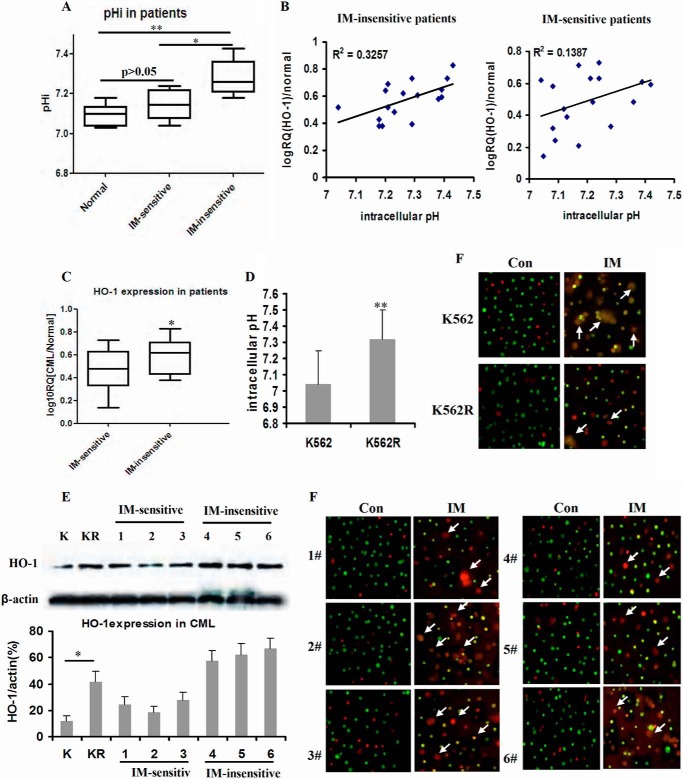
We first compared the pHi values of CML patients responding to IM therapy or not. The box and whisker plots showed that the pHi values of IM-insensitive patient cells were higher than those of IM-sensitive patient cells (p < 0.05) and healthy donors (p < 0.01) (Fig. 1A). pHi and HO-1 mRNA expressions were positively linearly correlated with a correlation coefficient (r2) of 0.3572 in IM-insensitive patients and a correlation coefficient (r2) of 0.1387 in IM-sensitive patients (Fig. 1B, p < 0.05). Accordingly, we compared the expressions of HO-1 in IM-sensitive and IM-insensitive CML patients. The mRNA expression of HO-1 in IM-insensitive patient cells exceeded that in IM-sensitive patients (p < 0.05) (Fig. 1C). Similar to the pHi values in CML patients, pHi was about 7.05 in K562 cell line, whereas pHi was 7.29 in the K562R cell line (Fig. 1D). In addition, the protein expressions of HO-1 in K562R cells and IM-insensitive patient cells were higher than those in K562 cells and IM-sensitive patient cells (Fig. 1E). K562R cells and IM-insensitive CML patients' bone marrow-derived MNCs were insensitive to IM treatment in vitro (Fig. 1F).
FIGURE 1.
pHi values in K562/K562R cell line and primary patient samples. A, box and whisker plots for bone marrow of healthy donor and primary leukemic patient samples. The whiskers above and below the box designate the 95th and 5th percentiles, respectively; the solid line within the box represents the median value; the dots above or below the box indicate outliers. IM-sensitive samples included CML patients (n = 18), and IM-insensitive samples included CML patients (n = 17). B, correlation between pHi and HO-1 expression was analyzed in IM-sensitive or insensitive samples. Each sample was divided into two aliquots, one for pHi and the other for real-time PCR. The graph shows the number of values for individual samples, linear regression, and p value. C, mRNA expression of HO-1 in IM-sensitive CML patients when compared with that of IM-insensitive CML patients. D, pHi values in K562 and K562R cell lines. E, protein expressions of HO-1 in K562 (K)/K562R (KR) cell lines and CML patients' MNCs detected by Western blot. F, K562/K562R cell lines and CML patients' MNCs in suspension treated with 1 μm IM and stained with acridine orange/ethidium bromide (100×). The box and whisker plots were made to assess mRNA and protein expressions. Con, control. ** indicates p < 0.01, and * indicates p < 0.05. K, K562 cell line; KR, K562R cell line; Con, control.
HO-1 Was Downstream of NHE1 Expression in K562R Cells
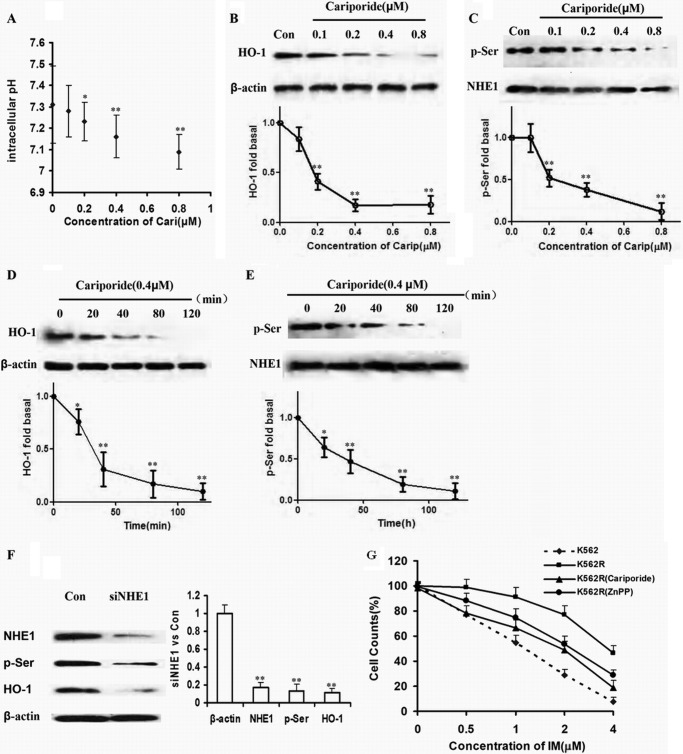
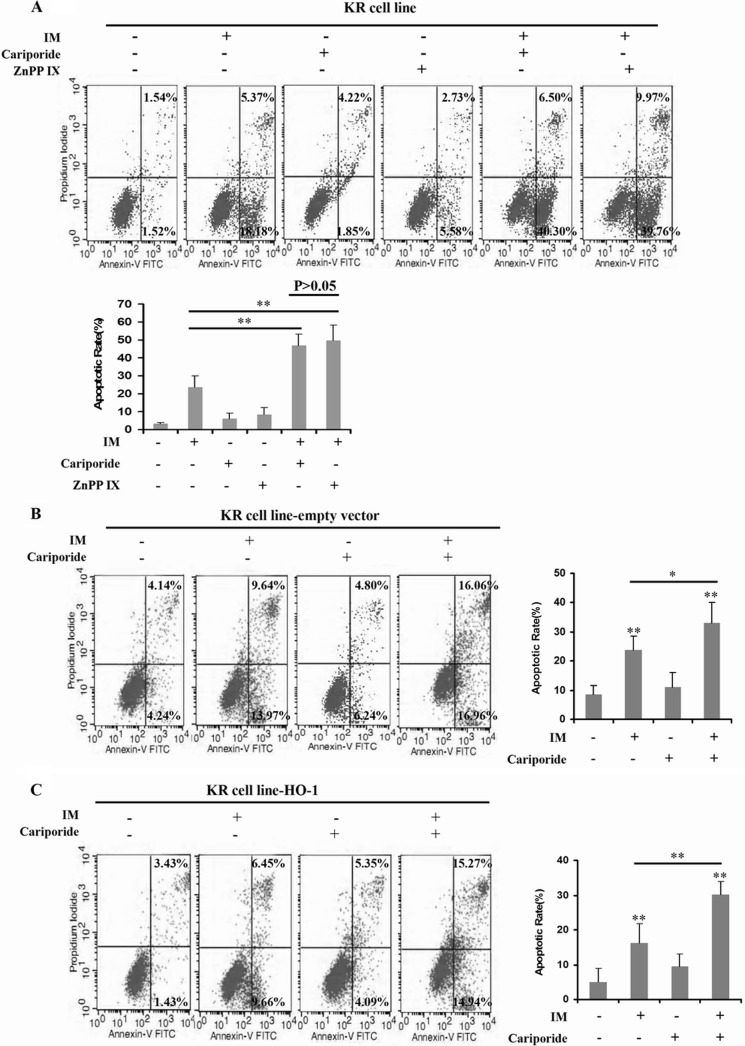
As an inhibitor of NHE1, cariporide reduced pHi as the concentration increased (0.1, 0.2, 0.4, and 0.8 μm) in K562R cells (Fig. 2A). After culture with the same concentrations of cariporide, the expression levels of HO-1 and p-Ser proteins were reduced dose-dependently (Fig. 2, B and C). Meanwhile, K562R cells were treated by 0.4 μm cariporide for 0, 20, 40, 80, and 120 min, during which HO-1 and p-Ser expressions were decreased time-dependently (Fig. 2, D and E). To directly observe the influence of NHE1 on HO-1 expression, siRNA for NHE1 was designed and transfected into K562R cells. As a result, HO-1 was down-regulated as NHE1 was silenced (Fig. 2F). Given that blockage of HO-1 could enhance apoptosis induced by IM, K562R cells were treated by IM alone and in combination with cariporide or ZnPP IX. The amount of dead cells induced by IM plus cariporide or ZnPP IX equaled that of dead K562 cells treated by IM alone, suggesting that inhibition of HO-1 or NHE1 significantly reversed IM resistance in K562R cells (Fig. 2G).
FIGURE 2.
HO-1 was downstream of NHE1 in K562R cells. A, pHi value was reduced with increasing concentration of cariporide. The whiskers above and below the plots designate the 95th and 5th percentiles, respectively. B and C, cells were incubated with the indicated concentration of cariporide for 2 h. Protein in cell lysates was analyzed by Western blot using HO-1, p-Ser, and NHE1 specific antibodies. Con, control. D and E, cells were harvested at various time intervals. HO-1, p-Ser, and NHE1 protein expressions levels were detected. F, NHE1 was silenced by siRNA, and then HO-1 and p-Ser were detected. G, K562R cells were treated by IM alone and in combination with cariporide or ZnPP IX. Cells viability was detected by CCK-8 assay and compared with that of K562 cells treated by IM as well. The curve and whisker plots were made to assess mRNA and protein expressions. ** indicates p < 0.01, and * indicates p < 0.05.
HO-1 Induced by NHE1 through PKC-β Phosphorylation Played an Important Role in IM Resistance in the K562R Cell Line
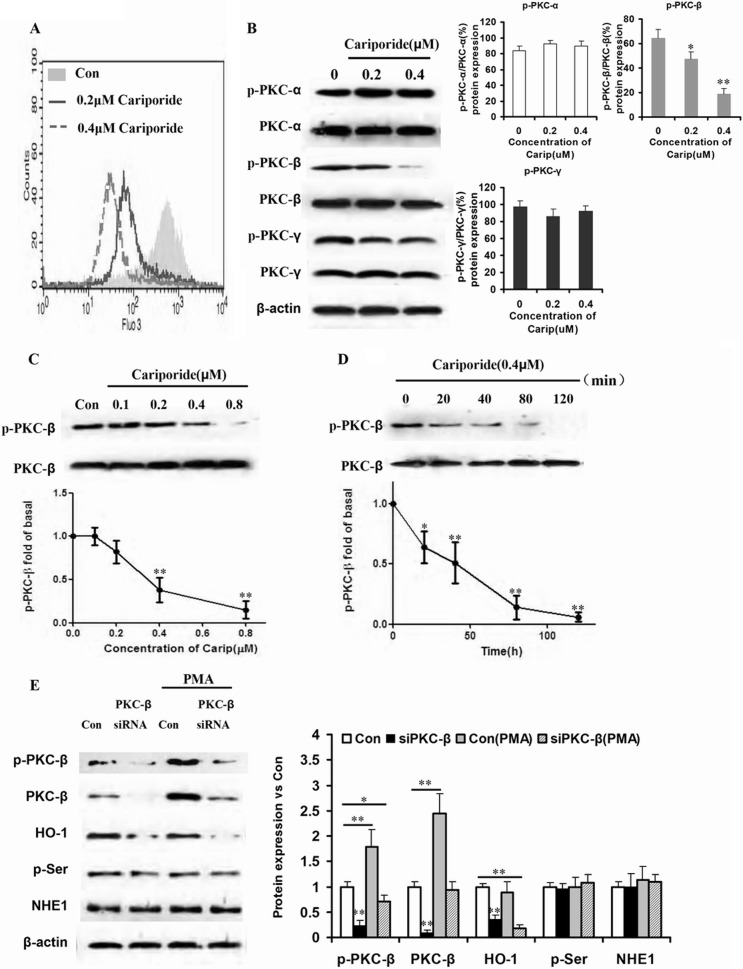
Changing intracellular Na+ can influence the concentration of intracellular Ca2+. Therefore, K562R cells were cultured with different doses of cariporide (0.4, 0.8 μm) for 20 min and stained by BCECF-AM, and [Ca2+]i was detected by flow cytometry. As expected, [Ca2+]i decreased in a dose-dependent manner (Fig. 3A). Because increase in [Ca2+]i concentration was necessary for activation of classical PKC proteins, PKC-α, PKC-β, and PKC-γ and their phosphorylation products were detected by Western blot. Only phosphorylation of PKC-β changed in a dose-dependent manner (Fig. 3B). Then, K562R cells were treated by different concentrations of cariporide for different times. The phosphorylations of PKC-β and PKC-β were detected at the protein level. Fig. 3, C and D, show that phosphorylation of PKC-β was reduced in a dose-dependent and time-dependent manner. To exclude other PKC proteins that dominantly regulate HO-1 expression induced by NHE1, K562R and K562R-siPKC-β cells were treated by PKC activator PMA. When compared with the K562R cells without transduction of siPKC-β, PMA failed to increase HO-1 expression (Fig. 3E), indicating that only PKC-β and its phosphorylation played important roles in regulation of HO-1 expression.
FIGURE 3.
PKC-β phosphorylation mediated HO-1 expression induced by NHE1 hyperfunction. A, K562R cells were treated by different doses of cariporide (0, 0.2, and 0.4 μm) for 20 min, and intracellular Ca2+ was detected by flow cytometry and shown in the overlap style. Con, control. B, the phosphorylation levels of classical PKC family proteins were assessed by Western blot after K562R cells were treated by cariporide (Carip). The K562R cell line was incubated with cariporide at the same concentrations, and HO-1 expression was detected by Western blot. The box and whisker plots were made to assess mRNA and protein expressions. ** indicates p < 0.01, and * indicates p < 0.05. C and D, K562R cells were treated by cariporide with increasing dose and time. Phosphorylation of PKC-β and PKC-β expression were detected by Western blot. The curve and whisker plots were made to assess protein expression. ** indicates p < 0.01, and * indicates p < 0.05. E, PKC-β siRNA was transduced into K562R cells to silence PKC-β, and PKC activator PMA was used to culture K562R and K562R-siPKC-β cells. Total protein was isolated from the cells, and PKC-β, HO-1, p-Ser, and NHE1 were assessed by Western blot. The box and whisker plots were made to assess mRNA and protein expressions. ** indicates p < 0.01, and * indicates p < 0.05.
HO-1 Induced by NHE1 Was Mediated by PKC-β-activated p38-MAPK Pathways
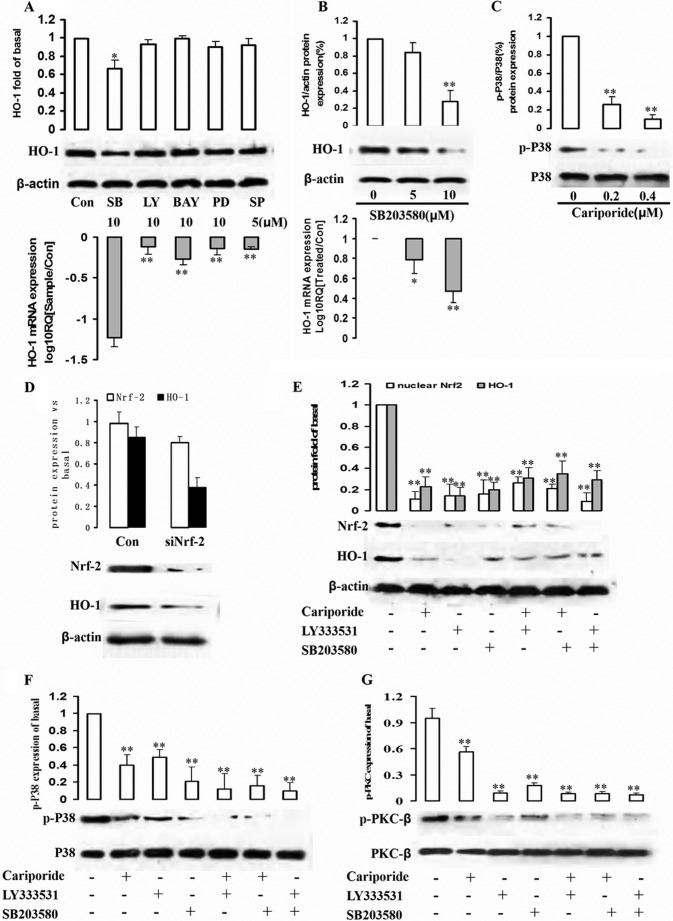
Several signaling pathways are involved in activation by PKC-β phosphorylation and HO-1 induction (21–23). To investigate the upstream factors of signaling pathway involved in PKC-β-dependent HO-1 expression, the K562R cell line was treated by SB203580 (p38MAPK inhibitor), LY294002 (PI3K inhibitor), BAY11-7082 (NF-κB inhibitor), SP600125 (JNK inhibitor), and PD98059 (MEK1 inhibitor), respectively, for 12 h, and HO-1 expressions at protein and mRNA levels were detected. Specifically, inhibition of the p38 pathways sharply reduced HO-1 in the K562R cell line (Fig. 4A). HO-1 protein and mRNA levels were down-regulated by p38 inhibitor SB203580 dose-dependently (Fig. 4B). In cariporide-stimulated K562R cells, phosphorylation of p38 decreased with rising cariporide dose (Fig. 4C). Therefore, the p38 signaling pathway participated in PKC-β phosphorylation-induced HO-1 expression.
FIGURE 4.
Involvement of p38 signaling pathways and Nrf-2 in NHE1-stimulated HO-1 expression. A, cells were pretreated with SB203580 (SB, p38 inhibitor), LY294002 (LY, Akt/PI3K inhibitor), BAY11-7082 (BAY, NF-κB inhibitor), PD98059 (PD, MEK1 inhibitor), and SP600125 (SP, JNK inhibitor) for 1 h. Whole cell lysates and mRNA were prepared and subjected to Western blot analysis with antibodies against anti-HO-1 and β-actin and real-time PCR to assess HO-1 mRNA expression level. Con, control. B, K562R cells were treated by p38 inhibitor SB203580 at different concentrations (0, 5, and 10 μm) for 2 h, and total protein and mRNA were extracted from cells to detect HO-1 protein and mRNA expression levels. C, the relationship between NHE1 and p38 was assessed. K562R cells were treated by cariporide with increasing dose, and p-p38 and p38 were detected by Western blot. D, Nrf-2 siRNA was successfully transduced into K562R cells, and total protein was isolated to detect HO-1 expression by Western blot. E–G, K562R cells were treated by cariporide (0.4 μm), LY333531 (10 μm), and SB203580 (10 μm) alone or in combination with each other for 2 h. Nuclear Nrf-2, HO-1, p-p38/p38, and p-PKC-β/PKC-β were measured by quantifying p-Akt from immunoblots. ** indicates p < 0.01, and * indicates p < 0.05.
Nrf2 is a redox-sensitive basic-leucine zipper transcription factor. The induction of phase II detoxifying and antioxidant enzymes, including that of HO-1, is regulated by the Nrf2/Keap1 transcription factor system (24). Nrf2 transcriptional activation of phase II gene induction is primarily controlled, relying on subcellular distribution in response to oxidative or electrophilic stress. Thus, we first determined HO-1 expressions in control and Nrf2-silencing K562R cells to investigate whether the induction of HO-1 expression in K562R cells was mediated by Nrf2. As shown in Fig. 4D, HO-1 is down-regulated in the case of Nrf-2 silencing by siRNA.
Next, K562R cells were treated by cariporide, LY333531, and SB203580 alone or in combination with each other for 2 h. Then, HO-1, Nrf-2, as well as phosphorylations of p38/p38 and PKC-β/PKC-β were detected by Western blot. As we supposed, NHE1 was upstream of the whole signaling pathway. When NHE1 function was inhibited, the downstream factors including phosphorylation of PKC-β, p38, Nrf-2, and HO-1 expressions were decreased. Inhibition of PKC-β by LY333531, p38, Nrf-2, and HO-1 expressions was down-regulated. In addition, blockage of p38 decreased Nrf-2 and HO-1 expressions, without influencing NHE1 and p38 expressions (Fig. 4, E–G).
HO-1 Overexpression Was the Key Point to IM Resistance Induced by NHE1 in CML
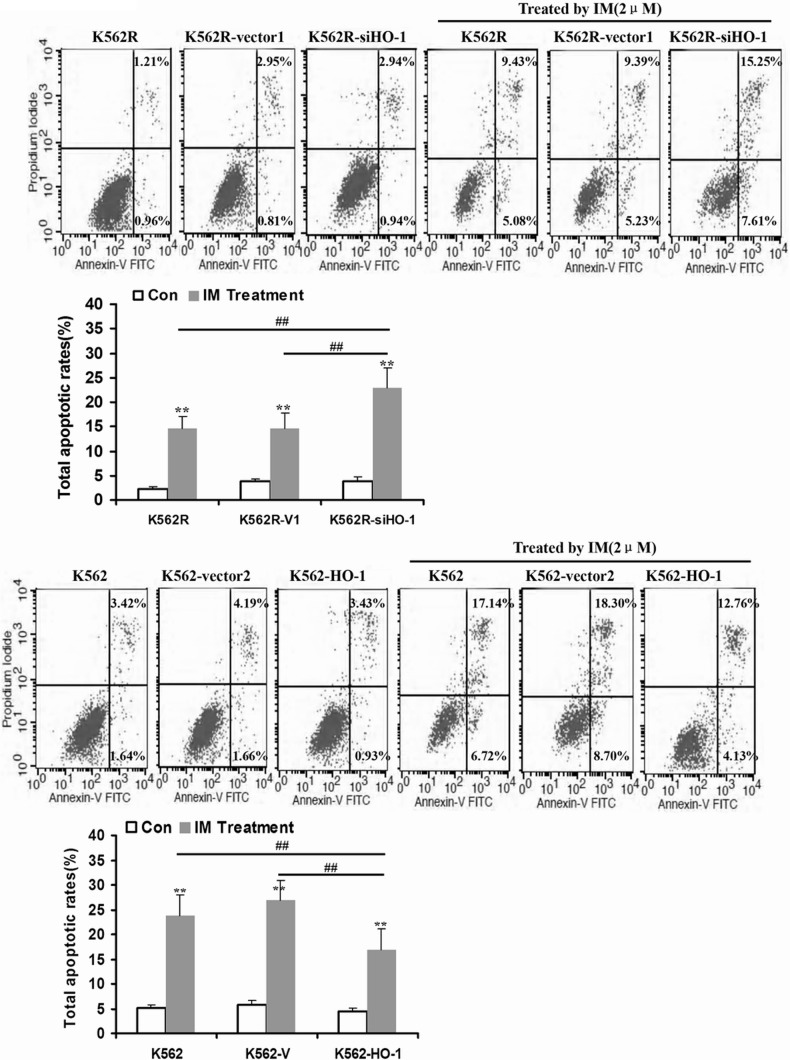
HO-1 exerts a cytoprotective effect of inhibiting apoptosis and maintaining cellular homeostasis (25, 26); its expression is however obviously up-regulated in different types of cancer, as it is associated with promotion of tumor cell survival (27, 28). In this study, we primarily proved that HO-1 was induced by NHE1 activation. To further determine whether increase in HO-1 activity can protect CML cells against IM treatment, HO-1 was transfected into K562R cells treated by NHE1 inhibitor cariporide plus IM. The apoptotic rate was assessed by annexin V/propidium iodide staining apoptosis kits. NHE1 and HO-1 inhibition plus IM treatment significantly enhanced the apoptosis of K562R cells. However, the apoptotic rate of HO-1-transfected K562R cells treated by cariporide plus IM was similar to that of the cells without cariporide treatment (Fig. 5). In addition, we also detected the sensitivity of K562R cells transfected by lenti-siHO-1 to IM and K562 cells transfected by lenti-HO-1 to IM. As a result, silencing HO-1 increased apoptosis in K562R cells, and HO-1 up-regulation protected K562 cells from IM treatment(Fig. 6).
FIGURE 5.
HO-1 overexpression played a crucial role in IM resistance in the K562R cell line. A, K562R (KR) cells were treated by IM, cariporide, and ZnPP IX alone or in combination with each other. Then, the apoptotic rate was measured by flow cytometry. B and C, HO-1 was transfected into K562R cells mediated by lentivirus. Then, K562R cells, K562R cells transfected with empty vector, and K562R cells transfected with HO-1 were cultured with IM, cariporide, and ZnPP IX alone or in combination with each other. The apoptotic rate was assessed by flow cytometry. ** indicates p < 0.01, and * indicates p < 0.05.
FIGURE 6.
HO-1 up-regulation induced resistance to IM in K562 cells. A, as a result of silencing HO-1 expression in K562R cells, the apoptosis induced by IM was increased significantly. B, up-regulation of HO-1 in K562 cells mediated by lentivirus leaded to IM resistance. Con, control. ** indicates p < 0.01, and ## indicates p < 0.01.
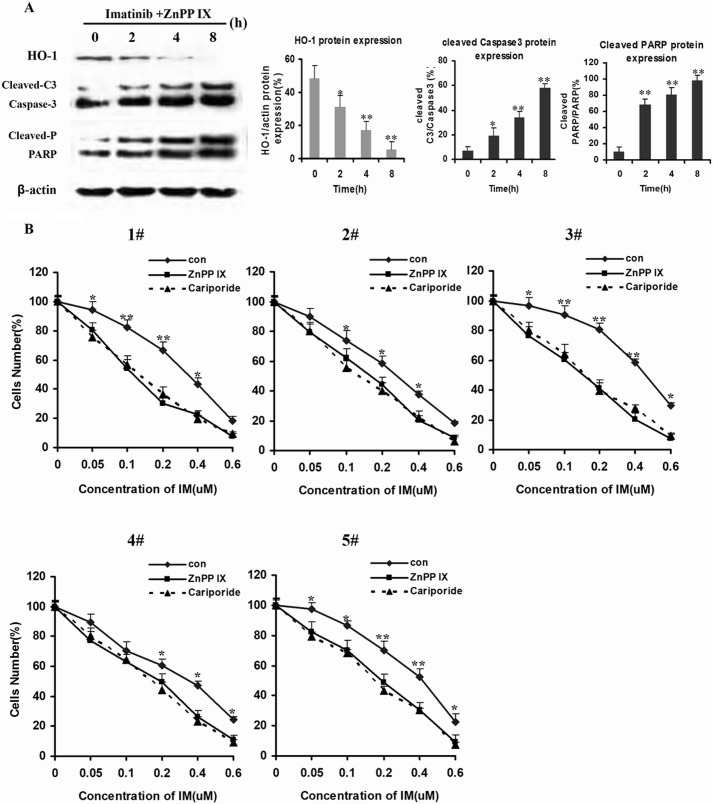
Caspase-3 activity, which is commonly associated with apoptotic processes, is largely increased in IM-induced apoptosis. Poly(ADP-ribose) polymerase-1 (PARP-1), which can be proteolytically cleaved by caspase-3 at the DEVD site to generate an 85-kDa fragment and a 24-kDa fragment, is recognized as a known caspase-3 substrate (29). Being consistent with the anti-apoptotic effects of HO-1, ZnPP IX increased caspase-3 activation and PARP-1 activity in a dose-dependent manner (Fig. 7A).
FIGURE 7.
Inhibition of HO-1 enhanced apoptosis induced by IM in CML. A, K562R cells were treated by IM (2 μm) plus ZnPP IX (1 μm) for 12 h. Then, whole cells lysates were prepared and subjected to Western blot analysis with antibodies against anti-cleaved caspase-3 (Cleaved-C3) and PARP-1 (Cleaved-P) in K562R cells. B, five IM-insensitive CML patients were randomly selected to measure cell viability after treatment with IM alone and with IM plus cariporide or ZnPP IX. Cell viability was detected by CCK-8 assay. ** indicates p < 0.01, and * indicates p < 0.05.
Base on the above data, we hypothesized that HO-1 was implicated in the NHE1-induced resistance to IM in CML patients' cells. Five IM-resistant CML patients' cells were randomly selected to be incubated with IM plus ZnPP IX or cariporide. Incubation with ZnPP IX or cariporide additionally increased the sensitivity of IM-resistant CML patients' cells (Fig. 7B).
DISCUSSION
Hsp32/HO-1, as an anti-apoptotic molecule in various neoplastic cells (30–33), is a novel interesting target in CML cells (18, 30, 32–34). CML cells constitutively express HO-1, and the disease-related oncoprotein BCR/ABL up-regulates expression of HO-1 in Ba/F3 cells. NHE1 is an important target protein implied in reversal of IM resistance in K562/IM cell lines and BCR-ABL-positive patient cells independent of p-gp protein stability (35).
In this study, pHi values were higher in IM-insensitive CML patients' bone marrow-derived MNCs and IM-resistant CML cell line K562R. Rapidly decreasing pHi by NHE1 inhibitor reduced HO-1 expression, suggesting that HO-1 overexpression was related to NHE1 function. Hyperfunction of NHE1 increased intracellular Na+ when Ca2+ was translated into cells from the extracellular environment. Increasing [Ca2+]i activated PKC-β phosphorylation and stimulated the p38-MAPK signaling pathway.
MAPK pathways are activated by various stimuli to participate in the generation of specific biologic responses including drug resistance, via which Pgp-mediated drug resistance can be reversed (36–39). In our study, cariporide was able to inhibit p38 in a pHi-dependent pattern. Inactivation of p38 MAPK was essential in HO-1 down-regulation and reversal of IM resistance.
Moreover, MAPK, pancreatic endoplasmic reticulum kinase, PI3K, and PKC are involved in HO-1 expression and Nrf2-dependent transcription (40, 41). Curcumin induces HO-1 expression via the PKC-d, p38, and Nrf2-ARE pathways in human monocytes, whereas coffee diterpene kahweol induces HO-1 expression via the PI3K and p38/Nrf2 pathways, but not the extracellular signal-regulated kinase or JNK pathway (42). Signaling mechanisms involved in HO-1 induction may depend on cell types and inducers. The present study implicated the roles of PKC-β and p38 in Nrf2-regulated NHE1-induced HO-1 expression (Fig. 3). In addition, SB203580, but not PD98059 and/or LY294002 and BAY11-7082, significantly inhibited NHE1-induced HO-1 expression in K562R cells.
Our results showed that the PKC-β and p38 pathways were required for the higher pHi-stimulated expression of HO-1 and induced translocation of Nrf2 in the nucleus. Furthermore, as evidenced by the effect of transient transfection with Nrf2 siRNA on HO-1 induction, HO-1 was strongly associated with the Nrf2 transcription factor (Fig. 3) that can induce phase II detoxifying enzymes including HO-1. Similarly, Randle et al. (43) reported that Nrf2 bound EpRE/ARE in the promoter regions of many antioxidant and phase II detoxifying genes, such as NADPH quinine oxidoreductase, glutamate-cysteine ligase catalytic subunit, and HO-1. Taken together, the hyperfunction of NHE1-stimulated HO-1 induction requires activation of Nrf2-EpRE/ARE in K562R cells.
Induction of HO-1 promotes cancer cell growth and survival, enhances cancer cell resistance to apoptotic death, and even stimulates metastasis and angiogenesis (27, 44). HO-1 can be a survival factor for CML cells by showing an anti-apoptotic effect. We hypothesized that induction of HO-1 by hyperfunction of NHE1 exerted anti-apoptotic effects, thereby suppressing cell death. In this study, we examined whether the cell death was influenced by suppression of NHE1 in CML cells with HO-1-transfection. HO-1 overexpression reduced the apoptotic rate of K562R cells induced by IM plus NHE1 inhibitor (Fig. 4), so NHE1-related IM resistance in CML was associated with HO-1 expression.
Being commonly associated with apoptotic processes, caspase-3 activity is remarkably enhanced in IM-induced apoptosis. PARP-1, which can be proteolytically cleaved by caspase-3 at the DEVD site to generate an 85-kDa fragment and a 24-kDa fragment, is a well known caspase-3 substrate (29). Inhibition of HO-1 dose-dependently increased the apoptotic rate of K562R cells induced by IM, and activations of caspase-3 and PARP-1 were facilitated, indicating that HO-1 overexpression blocked apoptosis.
In the present study, we examined whether increase of pHi may induce up-regulation of HO-1 expression through the PKC-β-p38/MAPK-Nrf2 pathways and whether induction of HO-1 contributed to the survival of K562R cells and IM-insensitive CML patients' cells during IM exposure. In summary, HO-1 had anti-apoptotic effects on IM-resistant CML cells, and the findings provide a mechanism by which induction of HO-1 expression through hyperfunction of NHE1 may promote tumor resistance(Fig. 8).
FIGURE 8.
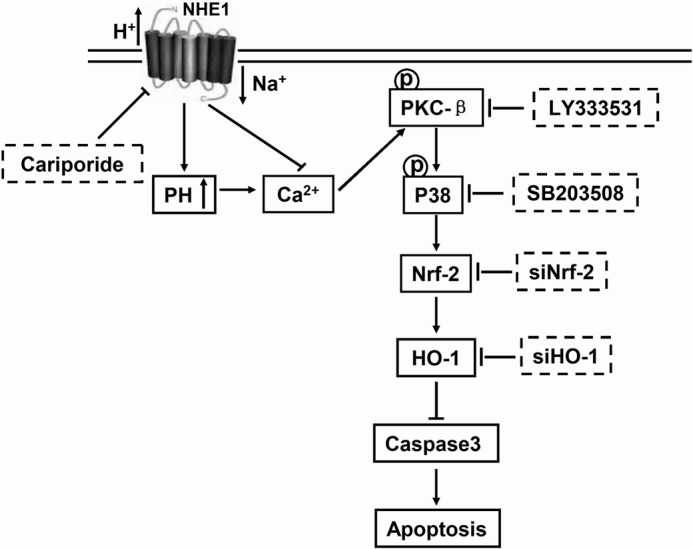
Schematic representation of the signaling pathway mediated by NHE1. Activation of NHE1 leads to HO-1 up-regulation-dependent p38/MAPK pathway activated by phosphorylation of PKC-β to protect cells against apoptosis.
Note Added in Proof
Table 1 and the legend to Figure 8 were missing from the version of this article that was published on March 23, 2015 as a Paper in Press. These errors have been corrected.
This work was supported by in part, by the National Natural Science Foundation of China (Grants 81070444, 81270636, 81360501, and 81470006), International Cooperation Project of GuiZhou Province (Grant 2011-7010), Social Project of GuiZhou Province (Grant 2011-3012), and Provincial Governor Special Fund of GuiZhou Province (Grant 2010-84).
- CML
- chronic myeloid leukemia
- HO-1
- heme oxygenase-1
- IM
- imatinib
- NHE
- Na+/H+ exchanger
- MNC
- mononuclear cell
- p-Ser
- phosphor-Ser
- BCECF-AM
- 2′,7′-bis-(2-carboxyethyl)-5-(and-6)-carboxyfluorescein, acetoxymethyl ester
- PMA
- phorbol 12-myristate 13-acetate
- ZnPP
- zinc protoporphyrin
- CCK-8
- cells counting kit 8.
REFERENCES
- 1. Trela E., Glowacki S., Błasiak J. (2014) Therapy of chronic myeloid leukemia: twilight of the imatinib era? ISRN Oncol. 2014, 596483. [DOI] [PMC free article] [PubMed] [Google Scholar]
- 2. de Almeida M. H., Fogliatto L., Couto D. (2014) Importance of adherence to BCR-ABL tyrosine-kinase inhibitors in the treatment of chronic myeloid leukemia. Rev. Bras. Hematol. Hemoter. 36, 54–59 [DOI] [PMC free article] [PubMed] [Google Scholar]
- 3. Breccia M., Alimena G. (2014) Discontinuation of tyrosine kinase inhibitors and new approaches to target leukemic stem cells: treatment-free remission as a new goal in chronic myeloid leukemia. Cancer Lett. 347, 22–28 [DOI] [PubMed] [Google Scholar]
- 4. Sacha T. (2014) Imatinib in chronic myeloid leukemia: an overview. Mediterr. J. Hematol. Infect. Dis. 6, e2014007. [DOI] [PMC free article] [PubMed] [Google Scholar]
- 5. Baccarani M., Castagnetti F., Gugliotta G., Palandri F., Rosti G. (2014) Treatment recommendations for chronic myeloid leukemia. Mediterr. J. Hematol. Infect. Dis. 6, e2014005. [DOI] [PMC free article] [PubMed] [Google Scholar]
- 6. Marin D. (2014) Patient with chronic myeloid leukemia in complete cytogenetic response: what does it mean, and what does one do next? J. Clin. Oncol. 32, 379–384 [DOI] [PubMed] [Google Scholar]
- 7. Savona M. R., Saglio G. (2013) Identifying the time to change BCR-ABL inhibitor therapy in patients with chronic myeloid leukemia. Acta Haematol. 130, 268–278 [DOI] [PubMed] [Google Scholar]
- 8. Jabbour E. J., Cortes J. E., Kantarjian H. M. (2013) Resistance to tyrosine kinase inhibition therapy for chronic myelogenous leukemia: a clinical perspective and emerging treatment options. Clin. Lymphoma Myeloma Leuk. 13, 515–529 [DOI] [PMC free article] [PubMed] [Google Scholar]
- 9. Branford S., Rudzki Z., Walsh S., Grigg A., Arthur C., Taylor K., Herrmann R., Lynch K. P., Hughes T. P. (2002) High frequency of point mutations clustered within the adenosine triphosphate-binding region of BCR/ABL in patients with chronic myeloid leukemia or Ph-positive acute lymphoblastic leukemia who develop imatinib (STI571) resistance. Blood 99, 3472–3475 [DOI] [PubMed] [Google Scholar]
- 10. Xu H. L., Wang Z. J., Liang X. M., Li X., Shi Z., Zhou N., Bao J. K. (2014) In silico identification of novel kinase inhibitors targeting wild-type and T315I mutant ABL1 from FDA-approved drugs. Mol. Biosyst. 10, 1524–1537 [DOI] [PubMed] [Google Scholar]
- 11. Kantarjian H., O'Brien S., Jabbour E., Garcia-Manero G., Quintas-Cardama A., Shan J., Rios M. B., Ravandi F., Faderl S., Kadia T., Borthakur G., Huang X., Champlin R., Talpaz M., Cortes J. (2012) Improved survival in chronic myeloid leukemia since the introduction of imatinib therapy: a single-institution historical experience. Blood 119, 1981–1987 [DOI] [PMC free article] [PubMed] [Google Scholar]
- 12. Kim D., Goh H. G., Kim S. H., Choi S. Y., Park S. H., Jang E. J., Kim D. W. (2012) Comprehensive therapeutic outcomes of frontline imatinib mesylate in newly diagnosed chronic phase chronic myeloid leukemia patients in Korea: feasibility assessment of current ELN recommendation. Int. J. Hematol. 96, 47–57 [DOI] [PubMed] [Google Scholar]
- 13. Kawajiri C., Tanaka H., Hashimoto S., Takeda Y., Sakai S., Takagi T., Takeuchi M., Ohwada C., Sakaida E., Shimizu N., Nakaseko C. (2014) Successful treatment of Philadelphia chromosome-positive mixed phenotype acute leukemia by appropriate alternation of second-generation tyrosine kinase inhibitors according to BCR-ABL1 mutation status. Int. J. Hematol. 99, 513–518 [DOI] [PubMed] [Google Scholar]
- 14. Weisberg E., Manley P. W., Breitenstein W., Brüggen J., Cowan-Jacob S. W., Ray A., Huntly B., Fabbro D., Fendrich G., Hall-Meyers E., Kung A. L., Mestan J., Daley G. Q., Callahan L., Catley L., Cavazza C., Azam M., Neuberg D., Wright R. D., Gilliland D. G., Griffin J. D. (2005) Characterization of AMN107, a selective inhibitor of native and mutant Bcr-Abl. Cancer Cell 7, 129–141 [DOI] [PubMed] [Google Scholar]
- 15. Shah N. P., Tran C., Lee F. Y., Chen P., Norris D., Sawyers C. L. (2004) Overriding imatinib resistance with a novel ABL kinase inhibitor. Science 305, 399–401 [DOI] [PubMed] [Google Scholar]
- 16. Yun S. M., Jung K. H., Kim S. J., Fang Z., Son M. K., Yan H. H., Lee H., Kim J., Shin S., Hong S., Hong S. S. (2014) HS-438, a new inhibitor of imatinib-resistant BCR-ABL T315I mutation in chronic myeloid leukemia. Cancer Lett. 348, 50–60 [DOI] [PubMed] [Google Scholar]
- 17. Elias M. H., Baba A. A., Azlan H., Rosline H., Sim G. A., Padmini M., Fadilah S. A., Ankathil R. (2014) BCR-ABL kinase domain mutations, including 2 novel mutations in imatinib resistant Malaysian chronic myeloid leukemia patients-Frequency and clinical outcome. Leuk. Res. 38, 454–459 [DOI] [PubMed] [Google Scholar]
- 18. Mayerhofer M., Gleixner K. V., Mayerhofer J., Hoermann G., Jaeger E., Aichberger K. J., Ott R. G., Greish K., Nakamura H., Derdak S., Samorapoompichit P., Pickl W. F., Sexl V., Esterbauer H., Schwarzinger I., Sillaber C., Maeda H., Valent P. (2008) Targeting of heat shock protein 32 (Hsp32)/heme oxygenase-1 (HO-1) in leukemic cells in chronic myeloid leukemia: a novel approach to overcome resistance against imatinib. Blood 111, 2200–2210 [DOI] [PubMed] [Google Scholar]
- 19. Ozkan P., Mutharasan R. (2002) A rapid method for measuring intracellular pH using BCECF-AM. Biochim. Biophys. Acta 1572, 143–148 [DOI] [PubMed] [Google Scholar]
- 20. Snabaitis A. K., Cuello F., Avkiran M. (2008) Protein kinase B/Akt phosphorylates and inhibits the cardiac Na+/H+ exchanger NHE1. Circ. Res. 103, 881–890 [DOI] [PubMed] [Google Scholar]
- 21. Ruvolo P. P., Zhou L., Watt J. C., Ruvolo V. R., Burks J. K., Jiffar T., Kornblau S., Konopleva M., Andreeff M. (2011) Targeting PKC-mediated signal transduction pathways using enzastaurin to promote apoptosis in acute myeloid leukemia-derived cell lines and blast cells. J. Cell. Biochem. 112, 1696–1707 [DOI] [PMC free article] [PubMed] [Google Scholar]
- 22. Lutzny G., Kocher T., Schmidt-Supprian M., Rudelius M., Klein-Hitpass L., Finch A. J., Dürig J., Wagner M., Haferlach C., Kohlmann A., Schnittger S., Seifert M., Wanninger S., Zaborsky N., Oostendorp R., Ruland J., Leitges M., Kuhnt T., Schäfer Y., Lampl B., Peschel C., Egle A., Ringshausen I. (2013) Protein kinase c-β-dependent activation of NF-κB in stromal cells is indispensable for the survival of chronic lymphocytic leukemia B cells in vivo. Cancer Cell 23, 77–92 [DOI] [PMC free article] [PubMed] [Google Scholar]
- 23. Saba N. S., Levy L. S. (2012) Protein kinase C-β inhibition induces apoptosis and inhibits cell cycle progression in acquired immunodeficiency syndrome-related non-Hodgkin lymphoma cells. J. Investig. Med. 60, 29–38 [DOI] [PMC free article] [PubMed] [Google Scholar]
- 24. Kobayashi M., Yamamoto M. (2005) Molecular mechanisms activating the Nrf2-Keap1 pathway of antioxidant gene regulation. Antioxid. Redox. Signal. 7, 385–394 [DOI] [PubMed] [Google Scholar]
- 25. Wang G., Hamid T., Keith R. J., Zhou G., Partridge C. R., Xiang X., Kingery J. R., Lewis R. K., Li Q., Rokosh D. G., Ford R., Spinale F. G., Riggs D. W., Srivastava S., Bhatnagar A., Bolli R., Prabhu S. D. (2010) Cardioprotective and antiapoptotic effects of heme oxygenase-1 in the failing heart. Circulation 121, 1912–1925 [DOI] [PMC free article] [PubMed] [Google Scholar]
- 26. Akagi R., Takahashi T., Sassa S. (2005) Cytoprotective effects of heme oxygenase in acute renal failure. Contrib. Nephrol. 148, 70–85 [DOI] [PubMed] [Google Scholar]
- 27. Miyake M., Fujimoto K., Anai S., Ohnishi S., Kuwada M., Nakai Y., Inoue T., Matsumura Y., Tomioka A., Ikeda T., Tanaka N., Hirao Y. (2011) Heme oxygenase-1 promotes angiogenesis in urothelial carcinoma of the urinary bladder. Oncol. Rep. 25, 653–660 [DOI] [PubMed] [Google Scholar]
- 28. Sass G., Leukel P., Schmitz V., Raskopf E., Ocker M., Neureiter D., Meissnitzer M., Tasika E., Tannapfel A., Tiegs G. (2008) Inhibition of heme oxygenase 1 expression by small interfering RNA decreases orthotopic tumor growth in livers of mice. Int. J. Cancer. 123, 1269–1277 [DOI] [PubMed] [Google Scholar]
- 29. Du Y., Bales K. R., Dodel R. C., Hamilton-Byrd E., Horn J. W., Czilli D. L., Simmons L. K., Ni B., Paul S. M. (1997) Activation of a caspase 3-related cysteine protease is required for glutamate-mediated apoptosis of cultured cerebellar granule neurons. Proc. Natl. Acad. Sci. U.S.A. 94, 11657–11662 [DOI] [PMC free article] [PubMed] [Google Scholar]
- 30. Lin T. K., Chen S. D., Chuang Y. C., Lin H. Y., Huang C. R., Chuang J. H., Wang P. W., Huang S. T., Tiao M. M., Chen J. B., Liou C. W. (2014) Resveratrol partially prevents rotenone-induced neurotoxicity in dopaminergic SH-SY5Y cells through induction of heme oxygenase-1 dependent autophagy. Int. J. Mol. Sci. 15, 1625–1646 [DOI] [PMC free article] [PubMed] [Google Scholar]
- 31. Xenaki D., Pierce A., Underhill-Day N., Whetton A. D., Owen-Lynch P. J. (2004) Bcr-Abl-mediated molecular mechanism for apoptotic suppression in multipotent haemopoietic cells: a role for PKCβII. Cell. Signal. 16, 145–156 [DOI] [PubMed] [Google Scholar]
- 32. Wegiel B., Gallo D., Csizmadia E., Harris C., Belcher J., Vercellotti G. M., Penacho N., Seth P., Sukhatme V., Ahmed A., Pandolfi P. P., Helczynski L., Bjartell A., Persson J. L., Otterbein L. E. (2013) Carbon monoxide expedites metabolic exhaustion to inhibit tumor growth. Cancer Res. 73, 7009–7021 [DOI] [PMC free article] [PubMed] [Google Scholar]
- 33. Ursu O. N., Sauter M., Ettischer N., Kandolf R., Klingel K. (2014) Heme oxygenase-1 mediates oxidative stress and apoptosis in coxsackievirus b3-induced myocarditis. Cell Physiol. Biochem. 33, 52–66 [DOI] [PubMed] [Google Scholar]
- 34. Tibullo D., Barbagallo I., Giallongo C., La Cava P., Parrinello N., Vanella L., Stagno F., Palumbo G. A., Li Volti G., Di Raimondo F. (2013) Nuclear translocation of heme oxygenase-1 confers resistance to imatinib in chronic myeloid leukemia cells. Curr. Pharm. Des. 19, 2765–2770 [DOI] [PubMed] [Google Scholar]
- 35. Lee B. K., Yoon J. S., Lee M. G., Jung Y. S. (2014) Protein kinase C-β mediates neuronal activation of Na+/H+ exchanger-1 during glutamate excitotoxicity. Cell. Signal. 26, 697–704 [DOI] [PubMed] [Google Scholar]
- 36. Katayama K., Yoshioka S., Tsukahara S., Mitsuhashi J., Sugimoto Y. (2007) Inhibition of the mitogen-activated protein kinase pathway results in the down-regulation of P-glycoprotein. Mol. Cancer Ther. 6, 2092–2102 [DOI] [PubMed] [Google Scholar]
- 37. Voss J., Posern G., Hannemann J. R., Wiedemann L. M., Turhan A. G., Poirel H., Bernard O. A., Adermann K., Kardinal C., Feller S. M. (2000) The leukaemic oncoproteins Bcr-Abl and Tel-Abl (ETV6/Abl) have altered substrate preferences and activate similar intracellular signalling pathways. Oncogene 19, 1684–1690 [DOI] [PubMed] [Google Scholar]
- 38. Liu M., Li D., Aneja R., Joshi H. C., Xie S., Zhang C., Zhou J. (2007) PO2-dependent differential regulation of multidrug resistance 1 gene expression by the c-Jun NH2-terminal kinase pathway. J. Biol. Chem. 282, 17581–17586 [DOI] [PubMed] [Google Scholar]
- 39. Zhou J., Liu M., Aneja R., Chandra R., Lage H., Joshi H. C. (2006) Reversal of P-glycoprotein-mediated multidrug resistance in cancer cells by the c-Jun NH2-terminal kinase. Cancer Res. 66, 445–452 [DOI] [PubMed] [Google Scholar]
- 40. Oriente F., Cabaro S., Liotti A., Longo M., Parrillo L., Pagano T. B., Raciti G. A., Penkov D., Paciello O., Miele C., Formisano P., Blasi F., Beguinot F. (2013) PREP1 deficiency downregulates hepatic lipogenesis and attenuates steatohepatitis in mice. Diabetologia 56, 2713–2722 [DOI] [PubMed] [Google Scholar]
- 41. Bloom D. A., Jaiswal A. K. (2003) Phosphorylation of Nrf2 at Ser40 by protein kinase C in response to antioxidants leads to the release of Nrf2 from INrf2, but is not required for Nrf2 stabilization/accumulation in the nucleus and transcriptional activation of antioxidant response element-mediated NAD(P)H:quinone oxidoreductase-1 gene expression. J. Biol. Chem. 278, 44675–44682 [DOI] [PubMed] [Google Scholar]
- 42. Hwang Y. P., Jeong H. G. (2008) The coffee diterpene kahweol induces heme oxygenase-1 via the PI3K and p38/Nrf2 pathway to protect human dopaminergic neurons from 6-hydroxydopamine-derived oxidative stress. FEBS Lett. 582, 2655–2662 [DOI] [PubMed] [Google Scholar]
- 43. Randle L. E., Goldring C. E., Benson C. A., Metcalfe P. N., Kitteringham N. R., Park B. K., Williams D. P. (2008) Investigation of the effect of a panel of model hepatotoxins on the Nrf2-Keap1 defence response pathway in CD-1 mice. Toxicology 243, 249–260 [DOI] [PubMed] [Google Scholar]
- 44. Lau A., Villeneuve N. F., Sun Z., Wong P. K., Zhang D. D. (2008) Dual roles of Nrf2 in cancer. Pharmacol. Res. 58, 262–270 [DOI] [PMC free article] [PubMed] [Google Scholar]


