Background: Channelrhodopsin-1 is a red-shifted light-gated cation channel.
Results: Proton transfers and H-bonding changes involving the Schiff base counterion residues Asp-169 and Glu-299 were detected.
Conclusion: A two-step proton transfer relay mechanism consistent with our results and earlier photoinduced channel current and pH titration measurements is proposed.
Significance: Understanding the mechanism of channelrhodopsin can lead to improved optogenetic control of neurons.
Keywords: Fourier Transform IR (FTIR), Ion Channel, Membrane Protein, Optogenetics, Rhodopsin
Abstract
Channelrhodopsin-1 from the alga Chlamydomonas augustae (CaChR1) is a low-efficiency light-activated cation channel that exhibits properties useful for optogenetic applications such as a slow light inactivation and a red-shifted visible absorption maximum as compared with the more extensively studied channelrhodopsin-2 from Chlamydomonas reinhardtii (CrChR2). Previously, both resonance Raman and low-temperature FTIR difference spectroscopy revealed that unlike CrChR2, CaChR1 under our conditions exhibits an almost pure all-trans retinal composition in the unphotolyzed ground state and undergoes an all-trans to 13-cis isomerization during the primary phototransition typical of other microbial rhodopsins such as bacteriorhodopsin (BR). Here, we apply static and rapid-scan FTIR difference spectroscopy along with site-directed mutagenesis to characterize the proton transfer events occurring upon the formation of the long-lived conducting P2380 state of CaChR1. Assignment of carboxylic C=O stretch bands indicates that Asp-299 (homolog to Asp-212 in BR) becomes protonated and Asp-169 (homolog to Asp-85 in BR) undergoes a net change in hydrogen bonding relative to the unphotolyzed ground state of CaChR1. These data along with earlier FTIR measurements on the CaChR1 → P1 transition are consistent with a two-step proton relay mechanism that transfers a proton from Glu-169 to Asp-299 during the primary phototransition and from the Schiff base to Glu-169 during P2380 formation. The unusual charge neutrality of both Schiff base counterions in the P2380 conducting state suggests that these residues may function as part of a cation selective filter in the open channel state of CaChR1 as well as other low-efficiency ChRs.
Introduction
Channelrhodopsins (ChRs)2 serve as photoreceptor proteins for phototaxis by green flagellate algae (1). Because ChRs function as light-activated cation channels, they provide a powerful tool for optical control of membrane potential in mammalian cells when expressed heterologously (2). Optogenetic applications of ChRs, especially from the extensively studied Chlamydomonas reinhardtii channelrhodopsin-2 (CrChR2), continue to rapidly expand (3–9) and include basic research on brain function (3) and potential treatments for a variety of neurological disorders such as Parkinson disease (4, 5). However, despite this intense interest, there is still only limited understanding of the molecular mechanisms underlying ChR function (6).
In this work, we have studied proton transfers occurring in a channelrhodopsin-1 from Chlamydomonas augustae (CaChR1) during the transition from the unphotolyzed dark state to the P2380 intermediate in its photocycle. CaChR1 is a low-efficiency light-activated cation channel that exhibits properties useful for optogenetic applications such as relatively slow light inactivation and red-shifted visible absorption (7). It is likely that P2380 is an open (e.g. conducting) ion channel state of CaChR1 because its lifetime measured in detergent micelles correlates with ion channel conduction measured in HEK cells (8).
A useful property of CaChR1 is that unlike the more extensively studied CrChR2, which possesses a mixture of all-trans and 13-cis retinal chromophore isomers in both its dark-adapted and its light-adapted state (9), recent resonance Raman spectroscopy (RRS) and FTIR studies show that CaChR1 under our conditions has an almost pure all-trans retinal composition with a structure very similar to the light-adapted light-driven proton pump bacteriorhodopsin (BR) (10, 11). This property is particularly useful to simplify analysis of structural changes occurring in ChRs, which in the case of CaChR1 appears to involve all-trans to 13-cis isomerization during the primary phototransition (11).
All ChRs share several key structural features with other microbial rhodopsins such as BR. These include: (i) seven transmembrane helices that form the core of the protein structure and in the case of ChRs are sufficient to form functional light-gated cation channels; (ii) a positively charged Schiff base (SB), which constitutes a covalent link between the retinal chromophore and a lysine residue located in the middle of helix G; and (iii) two highly conserved residues (normally either Asp or Glu) located in a position to potentially serve as counterions for the protonated SB.
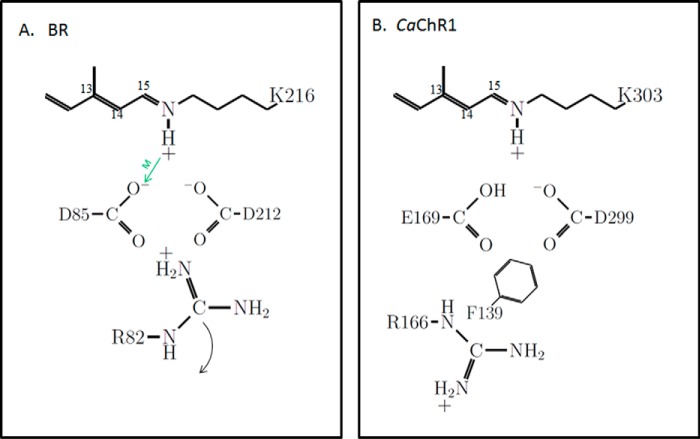
In the case of BR (Fig. 1A), the two SB counterion residues (Asp-85 and Asp-212) are both negatively charged in the unphotolyzed “ground” state of the BR photocycle (i.e. light-adapted BR570). A positively charged residue, Arg-82 (located one turn down from Asp-85 on helix C), also interacts directly with Asp-85 and Asp-212 and together along with the protonated SB form a charge neutral complex (12).
FIGURE 1.
Schematic showing key residues and their ionization states in the photoactive site of light-adapted BR and CaChR1. A, BR. The positioning of residues is guided by known high resolution x-ray structure (12). The green arrow indicates the role of Asp-85 as an SB proton acceptor during M412 formation (13). The curved arrow indicates repositioning of Arg-82 toward the extracellular side of the membrane that triggers proton release by the proton release complex (not shown). B, CaChR1. The positioning of the residues is guided by the high resolution x-ray structure of the C1C2 chimera (31). Ionization states are inferred from recent pH titrations on various CaChR1 mutants (8, 21). Phe-139 is replaced by a positively charged lysine in most high-efficiency ChRs (21).
The existence of this complex, which constitutes the photoactive site of BR, and its role in proton transport during the photocycle were predicted on the basis of site-directed mutagenesis and FTIR difference spectroscopy (13) and supported by a variety of biophysical/biochemical studies including high-resolution x-ray crystallographic structures of BR in various photointermediates (see review in Ref. 14). Upon the formation of the M412 intermediate, a proton is transferred from SB to Asp-85 (Fig. 1, green arrow) (13). In contrast, Asp-212 does not serve as the SB proton acceptor and remains predominantly deprotonated throughout the BR photocycle, most likely due to its close interaction with Tyr-185 (not shown in Fig. 1) (15–17). Furthermore, the resulting neutralization of Asp-85 upon M412 formation causes the nearby Arg-82 to change its orientation so that the positively charged guanidinium group moves away from Asp-85 toward the extracellular side of the membrane (Fig. 1A). This movement causes an ejection of a proton to the extracellular medium via a proton release complex that has been identified to involve Glu-194 and Glu-204 (14, 18). Ultimately, this mechanism is reset in the late BR photocycle by the transfer of a proton from the cytoplasmic side of the membrane during N formation (Asp-96 deprotonates donating a proton to the SB), and Asp-85 deprotonates during O decay (resetting the proton release complex) (19, 20).
Recent studies (8, 10, 21) show that a different charge arrangement exists in the ground state photoactive site of CaChR1 as compared with BR (Fig. 1B). Unlike the negatively charged Asp-85, spectroscopic titration studies show that the homologous residue Glu-169 (CaChR1 numbering) is neutral, due to the extremely high pKa (>9) of its carboxylic acid (8, 21). Furthermore, the Asp-212 homolog (Asp-299, CaChR1 numbering) is ionized (COO−). Thus, unlike BR, a second positive charge provided by Arg-82 is no longer needed to maintain charge neutrality. While there still exists a homologous Arg-82 residue (Arg-166) in CaChR1, its neutralization in the mutant R166A does not significantly alter the λmax (21). Thus, it is likely to be oriented similar to Arg-82 in the M412 intermediate of BR where Asp-85 is neutral (Fig. 1B).
To further characterize the molecular changes and in particular the proton transfers occurring in the photoactive site of CaChR1 during transition from the unphotolyzed state to the P2380 intermediate, FTIR difference spectroscopy was used in combination with site-directed mutagenesis. Our findings indicate that unlike the M412 intermediate of BR, where Asp-85 is neutral and Asp-212 ionized, both homolog residues exist in neutral states in P2380. On the basis of this and earlier measurements (8, 10, 11, 21), a proton relay mechanism is suggested whereby: (i) a proton is transferred from Glu-169 to Asp-299 during the primary phototransition (P1 formation) (11) and (ii) during P2380 formation, Glu-169 acts as the proton acceptor from the SB, whereas Asp-299 remains protonated but with a weaker hydrogen bonding than in P1. As discussed below, the unusual neutral charge state of both SB counterions in P2380 as compared with other microbial rhodopsins may serve as a critical element to facilitate cation transport and regulation of selectivity in the CaChR1 ion channel.
EXPERIMENTAL PROCEDURES
Expression, Purification, and Reconstitution of CaChR1 and Mutants
The expression, purification and reconstitution of wild-type and mutants of CaChR1 was recently described (10, 11, 21). Briefly, the seven-transmembrane domain of CaChR1 was expressed from Pichia pastoris in the presence of all-trans retinal, purified using a nickel-nitrilotriacetic acid-agarose affinity chromatography (Qiagen, Hilden, Germany), and reconstituted in Escherichia coli polar lipids (ECPL) with a mass ratio of 1:10 (CaChR1:ECPL).
Static Low-temperature FTIR Difference Spectroscopy
The protein samples for the static low-temperature FTIR measurements were prepared as reported previously (11, 22) using ∼50 μg of the protein for each experiment. Samples were slowly dried on a BaF2 window in a dry-box and then rehydrated through the vapor phase with a small (∼ 0.5-μl) drop of H2O, sealed in a sample cell with another BaF2 window, and mounted in a liquid nitrogen cryostat (Oxford Instruments, OptistatDN). Hydration levels were monitored before and after experiments at room temperature using the absorbance of the 3300-cm−1 water band to detect any drying of film after hydration. For measurements of CaChR1 at 270 K, the samples were first cooled from room temperature in the dark to avoid trapping of photointermediates. The film was allowed to equilibrate at 270 K for >0.5 h after which spectra were recorded using the cycle consisting of four steps: 1) dark, 2) illumination with a 505-nm LED, 3) dark, and 4) illumination with a 405-nm LED. All LEDs and LED control systems were from Thorlabs Inc. (Newton, NJ). An alternative method, referred to here as static decay, where the sample was allowed to decay back to the ground state without photoreversal during step 4, was also used in some cases (see “Results”). In either case, the four-step cycle was repeated at least 30 times, and the corresponding difference spectra (e.g. 2-1, 3-1, 4-3) were computed. Each acquired spectrum consisted of 200 scans (approximately 1 min total time) recorded at 4-cm−1 resolution using a Bio-Rad FTS-60A FTIR spectrometer (Bio-Rad, Digilab Division) equipped with a liquid nitrogen-cooled HgCdTe detector.
Time-resolved Rapid Scan FTIR Difference Spectroscopy
Protein films were prepared by depositing 50–100 μl of the proteoliposome suspension in a buffer consisting of 50 mm K2HPO4 adjusted to pH 7.2 onto a polished 2-mm thick, 25-mm diameter CaF2 window (Crystran, Poole, UK) and drying the sample under a gentle stream of argon. Films were rehydrated via the vapor phase and sealed in a temperature-controlled infrared cell (Model TFC, Harrick Scientific Corp., Ossining, NY) using a second CaF2 window. Time-resolved rapid scan FTIR spectra were obtained at 8-cm−1 spectral resolution using a 320-kHz scanner velocity corresponding to the data acquisition window of 8 ms with a Bruker IFS 66 v/s FTIR spectrometer (Bruker Optics, Germany) and a neodymium-doped yttrium aluminum garnet (Nd:YAG) pulsed laser as described previously (23). Data blocks of 500 scans were taken, each containing 80 time-resolved difference spectra.
Data Processing
Fourier self-deconvolution (FSD) was performed using Galactic software 7.02 (Thermo Fisher Scientific) with γ = 7 and Bessel smoothing set to 25%. Single value decomposition (SVD) of time-resolved FTIR difference spectra (24) as well as fitting of time decay components to exponential functions was performed using MATLAB (MathWorks, Inc. Natick, MA).
RESULTS
FTIR Difference Spectroscopy of the CaChR1 → P2380 Transition
To measure the FTIR differences for the transition from the unphotolyzed CaChR1 ground state to the P2380 intermediate, fully hydrated films of the protein reconstituted in lipids (ECPL) were recorded at 270 K using static FTIR difference spectroscopy (see “Experimental Procedures”). Time-resolved rapid scan FTIR differences were also measured at 5 and 20 °C using 532-nm neodymium-doped yttrium aluminum garnet laser-flash excitation (see “Experimental Procedures”).
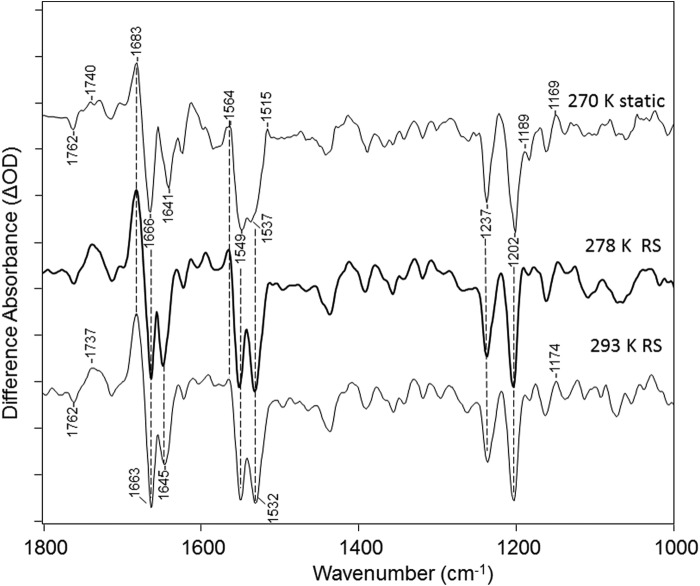
As seen in Fig. 2 both static and time-resolved methods resulted in very similar difference spectra. For example, the rapid scan difference spectra averaged over the first 45 ms after the laser flash excitation at both 5 °C and 20 °C (278 and 293 K) are very similar to the static spectra obtained at −3 °C (270 K). A similar agreement was obtained by analyzing the rapid scan data using SVD methods (see below and Fig. 3). Although not identical, these spectra are also similar to recently reported FTIR difference spectra recorded at room temperature of CaChR1 in detergent micelles (25, 26).
FIGURE 2.
Comparison of FTIR difference spectra of CaChR1 for static recorded at 270 K and rapid scan recorded at both 278 K and 293 K over the 1000–1800-cm−1 region (see “Experimental Procedures”). y axis markers indicate 0.2 mOD for CaChR1 static spectra. y axis markers are ∼0.2, 0.2, and 0.1 mOD for CaChR1 270 K static, 278 K RS, and 293 K RS spectra, respectively.
FIGURE 3.
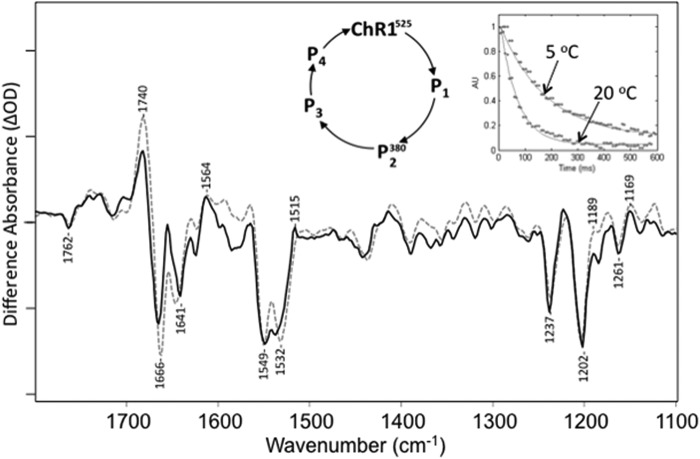
Comparison of time-resolved rapid scan FTIR difference basis spectrum derived from SVD analysis (dashed) recorded at 20 °C and static FTIR difference spectrum (solid) recorded at 270 K. Right inset, SVD-derived decays for time-resolved FTIR difference spectra at 5 and 20 °C. The time-resolved basis spectrum agrees well with the 270 K difference data. y axis markers are ∼0.8 and 0.4 mOD for time-resolved and static difference spectra, respectively. A photocycle scheme is also shown that is typical for ChRs.
An SVD analysis of the rapid scan, time-resolved data recorded at 293 K (20 °C) shown in Fig. 2 results in a first (largest amplitude) basis spectrum that is in excellent agreement with the static FTIR difference spectrum recorded at 270 K as shown in Fig. 3. Note that the second basis vector was 10 times smaller in magnitude than the first for both 5 °C and 20 °C. In addition, the time dependence data associated with this first basis spectra from the SVD analysis of both the 5 °C and the 20 °C data are shown in the Fig. 3 inset and are well fit by single exponential decays with time constants of ∼65 and 170 ms, respectively. Importantly, these time constants correspond well with P2380 decay time constants measured at the same temperatures by time-resolved laser flash visible absorption of suspensions of the CaChR1 membranes used to form the FTIR films.3 The global fit difference spectrum determined from SVD analysis also agrees well with the static measurements (Fig. 3). These results strongly indicate that CaChR1 decays almost exclusively back to the ground state from P2380 under these low-temperature conditions.
The static difference spectrum shown in Fig. 2 reflects the difference between 1 min of data acquisition before and 1 min of data acquisition during photo-steady illumination with the 505-nm light (spectrum 2-1 in the photoreversal cycle described under “Experimental Procedures”). Similar results were also obtained for the 3-1 difference reflecting changes occurring 1 min before and 1 min after the 505-nm light is turned off (Fig. 4). The smaller amplitude of the 3-1 versus 2-1 differences reflects the thermal decay of CaChR1 back to the unphotolyzed (dark) state. As expected, the subsequent 4-3 difference spectrum (shown inverted) matches well the 3-1 difference spectrum, indicating that the residual photoproducts formed after 1 min of thermal decay are fully photoreversed back to the dark state using 1 min of 405-nm illumination. Note that both these results support the conclusion (see below) that the transition from unphotolyzed state to P2380 is reflected in the difference spectra shown in Fig. 2.
FIGURE 4.
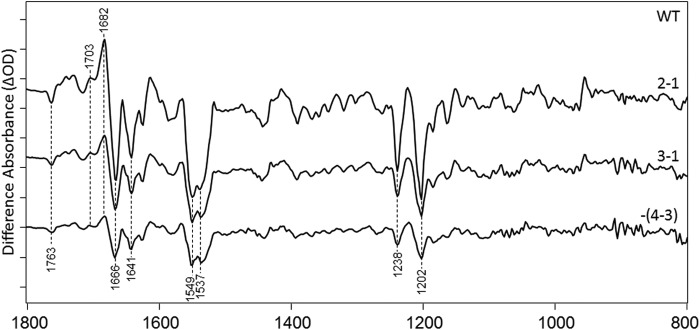
FTIR difference spectra in the 800–1800-cm−1 region of CaChR1 recorded using the photoreversal methods at 270 K (see “Experimental Procedures”). y axis markers are ∼0.2 mOD for all spectra.
The formation of the P2380 intermediate and the absence of significant contributions from other photointermediates under these conditions can also be deduced from the absence of positive bands in the fingerprint region between 1180 and 1195 cm−1 (Fig. 2). Normally, such positive bands appear due to the formation of a species with a 13-cis retinal chromophore and protonated SB. For example, a strong positive band appears in the CaChR1 → P1 FTIR difference spectrum measured at 80 K at 1196 cm−1 (11). In contrast, the absence of positive bands in this region is characteristic of a photointermediate with a deprotonated retinylidene SB such as seen for the BR → M412 transition, where the SB of M412 is deprotonated (27). Because P2380 is the only intermediate expected to have a deprotonated SB in the CaChR1 photocycle, significant contributions from other intermediates are unlikely.
A positive band also appears at 1564 cm−1, close to the expected frequency of the ethylenic stretch of the P2380 measured by RRS (25). Because no other strong positive band appears in this region, this further supports the conclusion that the P2380 intermediate is the major contributor to the FTIR difference spectra recorded under these conditions (Fig. 2).
A corresponding negative band also appears in the ethylenic stretching region at 1532 cm−1 (1537 cm−1 at low temperature), which has previously been assigned by RRS to the unphotolyzed state of CaChR1 (10, 25). Interestingly, a second prominent negative band appears at 1549 cm−1, as seen in the CaChR1 → P1 FTIR difference spectrum (11). Although this band has been associated with a proposed blue-shifted intermediate present in the dark state of CaChR1 (25), in the case of the CaChR1 → P1 difference spectrum, it has been assigned to the amide II vibration on the basis of its insensitivity to isotope labeling and substitution of the analog A2 retinal (3,4-dehydroretinal) (11). A similar insensitivity of this band is also observed for the CaChR1 → P2380 FTIR difference spectrum recorded at 230 K.4 Strong bands are also observed in the amide I regions at 1666 cm−1 (negative) and 1683 cm−1 (positive), which along with the amide II band indicate significant structural changes of the protein backbone that occur in the formation of P2380.
Band Assignments in the Carboxylic Acid C=O Stretch Region
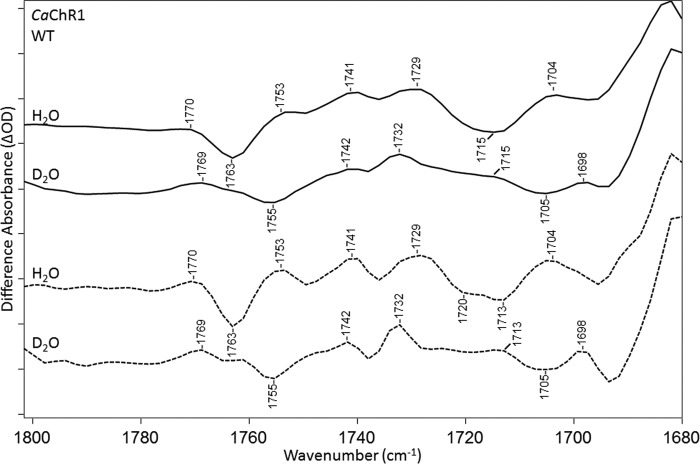
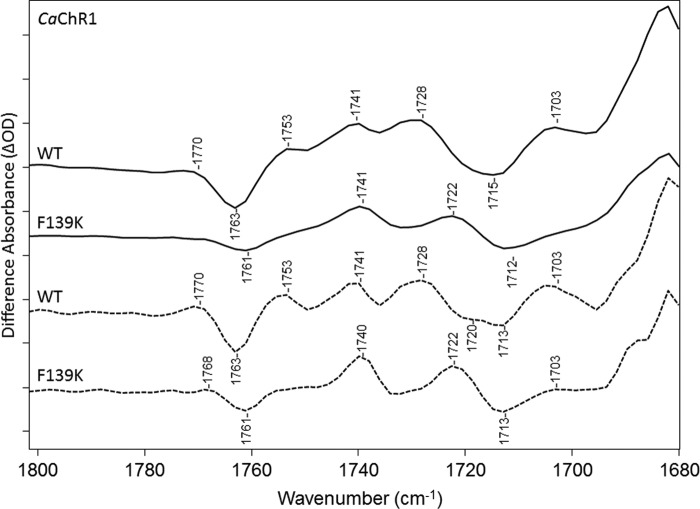
The 1700–1800-cm−1 region reflects alterations mainly in Asp/Glu residues, which can undergo changes in hydrogen bonding or protonation state. Several bands appear in this region as shown in Fig. 5. Most prominently, a negative band is located at 1763 cm−1, and positive bands are at 1770, 1753, 1741, 1729, and 1704 cm−1. A broad negative band also appears near 1715 cm−1 that resolves into two negative bands at 1720 and 1713 cm−1 in the FSD difference spectrum (see “Experimental Procedures”) (Fig. 5, dashed line).
FIGURE 5.
FTIR difference spectra of CaChR1 WT recorded at 270 K over the 1680–1800-cm−1 region in both H2O (first and third spectra) and D2O (second and fourth spectra). Spectra were acquired using static methods, and differences shown are the average of 2-1 in the photoreversal cycle (see “Experimental Procedures”). Dashed plots show FSD processed spectra as described under “Experimental Procedures.” y axis markers are ∼0.1 and 0.05 mOD for H2O and D2O spectra, respectively.
Depending on the strength of the hydrogen bonding, bands caused by the C=O stretch of carboxylic acids downshift 5–12 cm−1 because of hydrogen/deuterium exchange (28). As seen in Fig. 5, all of the difference bands identified in this region for CaChR1 in H2O undergo a downshift to a corresponding band in D2O, although not by the same amount. For example, the negative 1763 band downshifts ∼8 cm−1, whereas the 1753- and 1741-cm−1 bands downshift 12 and 9 cm−1, respectively.
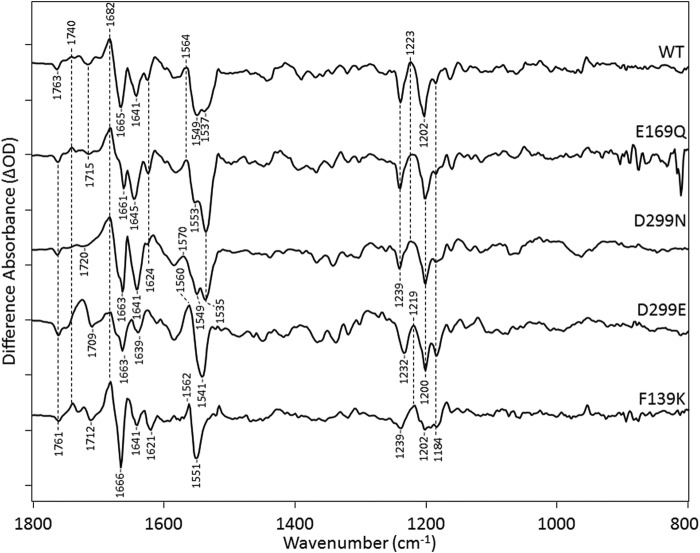
To assign bands in this region, the effects of substitutions of the residues Glu-169, Asp-299, and Phe-139 (Fig. 1B) were measured at 270 K (Fig. 6). All of these mutants appear to form predominantly P2380 based on the appearance of the 1564-cm−1 band assigned to the ethylenic mode of P2380. All of these mutations also have similar band structures in the fingerprint region, which as discussed above reflects an all-trans to 13-cis isomerization. Two exceptions, however, are the mutants F139K and D299E. In these cases, the appearance of a more negative band relative to WT appears near 1184 cm−1, indicative of the co-existence of a 13-cis retinal configuration in the unphotolyzed state (Fig. 6) (10). These 13-cis-containing states are also likely to produce photocycle intermediates, although the photoproducts may exhibit weak positive bands if associated with a deprotonated SB species similar to P2380 as noted above. Resonance Raman spectra also show such a band in the dark state of F139K and D299E relative to WT (data not shown). Interestingly, as discussed below, this mixed retinal composition is similar to what is observed in CrChR2 (10) and may be a consequence in the case of F139K of ionization of Glu-169, which can interact with the nearby Lys residue instead of a neutral phenylalanine (9, 10).
FIGURE 6.
FTIR difference spectra in the 800–1800-cm−1 region of CaChR1 and mutants recorded at 270 K in H2O using methods identical to shown in Fig. 2. The y axis tick marks are ∼0.5, 0.3, 0.8, 0.7, and 0.5 mOD for the spectra from top to bottom.
All of these mutants also display an increase in frequency of the negative band assigned to the ethylenic C=C stretch vibrations near 1537 cm−1 (see above) consistent with their blue-shifted visible absorption λmax (21). This effect agrees with the observed inverse linear correlation between υC=C and λmax for other rhodopsins (22, 29, 30) and as observed previously with RRS measurements of the E169Q and D299N mutants of CaChR1 (10). The most dramatic example of this effect is the upshift of this band to around 1551 cm−1 in F139K and 1541 cm−1 in D299E (Fig. 6) consistent with the upshifted ethylenic frequency measured by RRS (data not shown) (10). Note that these upshifts most likely hide the second negative band at 1549 cm−1 assigned to the amide II vibration (see above). Bands near 1665 cm−1 (negative) and 1682 cm−1 (positive) assigned in WT to the amide I mode also appear in all the mutants examined, although somewhat shifted in frequency.
E169Q Mutant
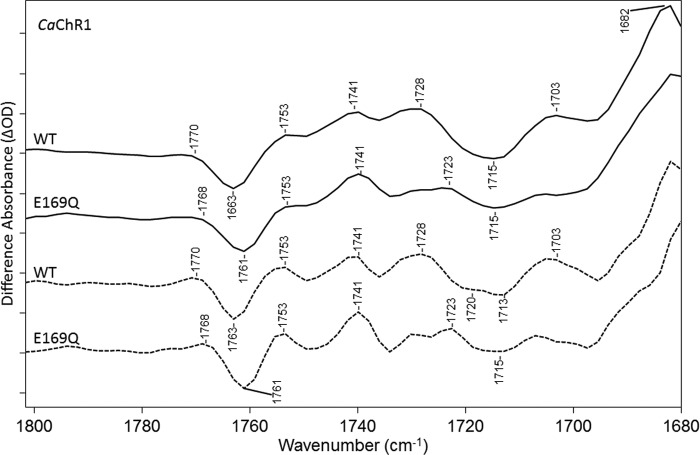
The mutant E169Q exhibits most of the bands observed in the carboxylic C=O stretch region for WT (Fig. 7). A small 2-cm−1 downshift in the positive/negative band at 1770/1763 cm−1 in WT is found, indicating that the corresponding COOH group is not from Glu-169 but its hydrogen bonding is slightly altered. The largest change occurs for the positive 1728-cm−1 band that drops in intensity relative to other bands in this region. In addition, there is a loss of intensity of the broad negative band seen in WT at 1715 cm−1, possibly due to the disappearance of the higher frequency component near 1720 cm−1 seen using FSD. Instead, a small positive band appears near 1723 cm−1. Thus, we conclude that this mutant causes a drop-out of positive/negative bands, which are assigned to Glu-169 and are consistent with a weakening of the hydrogen bonding of the Glu-169 COOH group during the CaChR1 → P2380 transition, at ∼1728/∼1720 cm−1.
FIGURE 7.
FTIR difference spectra in the 1680–1800-cm−1 region of CaChR1 WT (first and third spectra) and the mutant E169Q (second and fourth spectra) recorded at 270 K in H2O using methods identical to those described in the legend for Fig. 2. Dashed plots show FSD processed spectra as described under “Experimental Procedures.” y axis markers are ∼0.1 and 0.06 mOD for WT and E169Q spectra, respectively.
D299E Mutant
Although as noted above, a 13-cis retinal species is present in the D299E mutant, its contribution to the CaChR1 → P2380 difference spectrum could be minimized by using the decay protocol instead of photoreversal method described under “Experimental Procedures.” In this case, the negative band at 1183 cm−1 and a high frequency shoulder on the negative ethylenic located at 1541 cm−1, both reflective of the 13-cis species, were reduced (data not shown). Importantly, in the case of either photoreversal or decay, the 1680–1800-cm−1 region was very similar (data not shown).
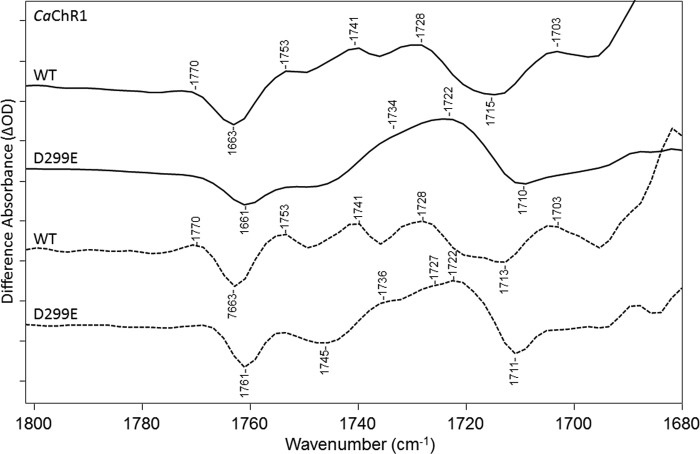
The largest change observed for this mutant is a decrease in intensity in the region 1740–1753 cm−1 (Fig. 8). Along with these changes, a significant increase in intensity occurs near 1722 cm−1 (Fig. 2). The bands near 1741 and 1728 cm−1 in WT may also be present as part of the broad positive high-frequency shoulder of the 1722-cm−1 band as seen most clearly in the D299E FSD difference spectrum. The positive band at 1703 cm−1 also disappears in the D299E mutant, which in the case of WT may be due to residual contributions from the K intermediate and assigned previously to Asp-299 protonation (11). It is also noted that a negative band still appears near 1761 cm−1 but is downshifted by 2 cm−1 similar to E169Q. Overall, the most likely explanation for these changes is that a positive band located in the region between 1740 and 1750 cm−1, assigned to Asp-299, downshifts ∼20–30 cm−1 due to the longer side chain (one carbon extra) in Glu as compared with Asp. Such a downshift due to a Asp → Glu substitution is not unusual and for example occurs in the BR mutant D85E where the positive 1761-cm−1 band assigned to Asp-85 downshifts ∼30 cm−1 in the BR → M412 difference spectrum (13).
FIGURE 8.
FTIR difference spectra in the 1680–1800-cm−1 region of CaChR1 WT (first and third spectra) and the mutant D299E (second and fourth spectra) recorded at 270 K in H2O using methods identical to those described in the legend for Fig. 2. Dashed plots show FSD processed spectra as described under “Experimental Procedures.” y axis markers are ∼0.1 and 0.03 mOD for WT and D299E spectra, respectively.
D299N Mutant
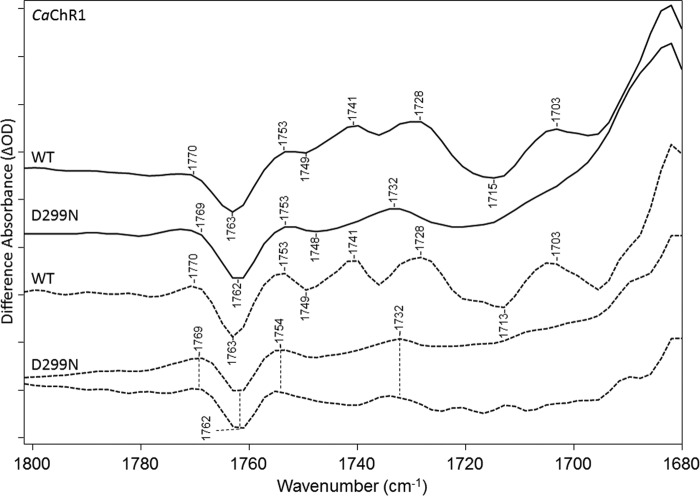
Similar to D299E, a drop in positive intensity occurs from 1740 to 1753 cm−1 again consistent with contributions from Asp-299 protonation in the WT spectrum in this region (Fig. 9). For example, the band appearing near 1741 cm−1 in WT is no longer present in D299N, replaced by a positive band near 1732 cm−1 similar to the shoulder in D299E. However, the larger band at 1722 cm−1 appearing in D299E is not present as expected because it was attributed to a downshift of the Asp-299 band due to the Asp to Glu substitution. In addition, the negative 1720-cm−1 band, which is resolved in the FSD of WT and assigned to deprotonation of Glu-169, disappears in the D299N spectrum. This is consistent with the earlier conclusion that Glu-169 is ionized in the unphotolyzed state of D299N (8, 11). A positive band also appears in D299N at 1732 cm−1, upshifted from the WT positive band at 1728 cm−1 consistent with Glu-169 still becoming protonated upon P2380 formation in this mutant but with a slightly weaker hydrogen bonding.
FIGURE 9.
FTIR difference spectra in the 1680–1800-cm−1 region of CaChR1 WT (first and third spectra) and the mutant D299N (second and fourth spectra) recorded at 270 K in H2O using methods identical to those described in the legend for Fig. 2. Dashed plots show FSD processed spectra as described under “Experimental Procedures.” y axis markers are ∼0.1 and 0.2 mOD for WT and D299N spectra, respectively.
F139K Mutant
The changes induced are very similar to the mutant E169Q in this region (Fig. 10). For example, the positive 1728-cm−1 band in WT drops in intensity relative to other bands in this region, revealing a less intense positive band at 1722 cm−1. The negative band at 1763 cm−1 is also downshifted by 2 cm−1 as observed in E169Q, D299N, and D299E but also reduced significantly in intensity relative to these other mutants. There may also be an absence of the positive 1753-cm−1 bands observed in WT and other mutants.
FIGURE 10.
FTIR difference spectra in the 1680–1800-cm−1 region of CaChR1 WT (first and third spectra) and the mutant F139K (second and fourth spectra) recorded at 270 K in H2O using methods identical to those described in the legend for Fig. 2. Dashed plots show FSD processed spectra as described under “Experimental Procedures.” y axis markers are ∼0.1 mOD for both WT and D299N spectra.
DISCUSSION
In this study, we have investigated proton transfers occurring in the low-efficiency CaChR1. CaChR1 exhibits several properties such as red-shifted visible absorption maximum and slow light inactivation, which makes it of interest as an optogenetic controlled cation channel (7). In addition, many of its properties including the presence of a fast outward directed photocurrent and absence of a red shift at low pH or when the Asp-85 is replaced by a neutral residue appear to be common to other low-efficiency ChRs (8, 10). Although less is known about the molecular properties of CaChR1 relative to the more extensively studied CrChR2, RRS shows that in the unphotolyzed state, at least under our conditions, retinal is completely all-trans similar to other microbial rhodopsins (10). In contrast, a significant level of 13-cis retinal is found in the unphotolyzed state of CrChR2, which can complicate analysis of its photocycle (9, 10).
Recent studies also show that in contrast to BR, where both SB counterions Asp-85 and Asp-212 are ionized, in CaChR1, the homologs Glu-169 and Asp-299 exist in a neutral and ionized state, respectively (8, 10, 21) (Fig. 1). One possible explanation for this difference relates to Arg-166, which is the homolog of Arg-82 in BR. As shown in Fig. 1A, the positive charge on the guanidinium group of Arg-82 is oriented toward the intracellular side of the bilayer membrane so that it interacts closely with Asp-85. In contrast, in the case of CaChR1, its orientation may be directed toward the extracellular side of the membrane, thereby weakening its interaction with the homolog Glu-169. The loss of this salt bridge interaction could result in an increase in the pKa of Glu-169 so that it remains protonated above pH 7 as observed (21).
In support of this explanation, substitution of Arg-166 with the neutral residue Ala does not significantly shift the CaChR1 λmax (21) as would be expected if it interacted closely with Glu-169. Interestingly, in the case of the chimera C1C2, a positively charged residue, Lys-132 located on helix B, is found to interact closely with the Asp-85 homolog Glu-162 (C1C2 sequence numbering) (Fig. 11) (21, 31). Other high-efficiency ChRs including CrChR1 and CrChR2 also retain a similar Lys at this position. However, in contrast, CaChR1 and other low-efficiency ChRs have a neutral residue in this position (Phe-139 in the case of CaChR1) (21). Thus, unlike BR, CaChR1 and most likely other low-efficiency ChRs have an unphotolyzed state photoactive site in which the electrostatic interactions mainly occur between the positively charged SB and the Asp-212 homolog (Asp-299), whereas the Asp-85 homolog (Glu-169) is neutral (i.e. protonated).
FIGURE 11.
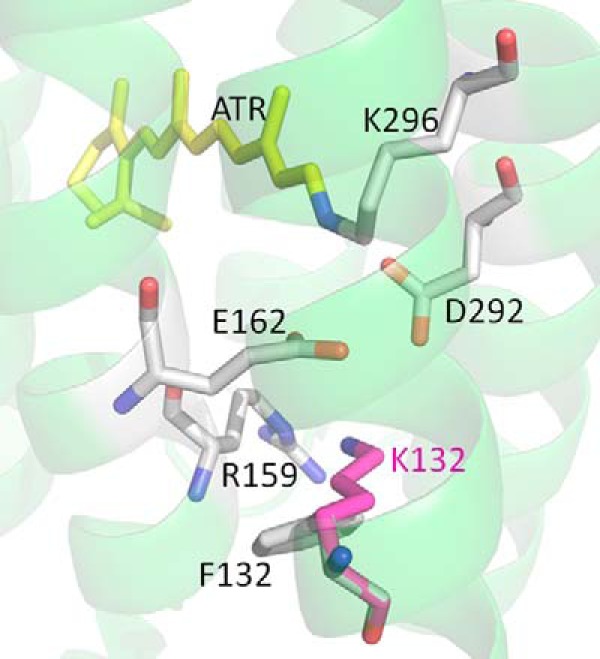
Three-dimensional structure of C1C2 chimera from Kato et al. (31) (Protein Data Bank ID 3UG9) showing the position of the residues homologous to the SB counterions Glu-169 and Asp-299 along with the positively charged residue Arg-166 in CaChR1. The residue Lys-132 (shown in pink) is the homolog to Phe-139 in CaChR1. Both residues are shown as a superposition. The numbering is based on the CrChR1 sequence.
A Proton Transfer Model
To further investigate the proton transfers that are involved in the formation of the open (e.g. conducting) channel P2380 state of CaChR1, FTIR difference spectroscopy was used along with site-directed mutagenesis. It is important to stress that this approach depends to a large extent on understanding the effects of point mutations on the overall structure and function of the protein. For this reason, the model proposed below takes into account results such as the effects of point mutations on visible absorption pH titration and photoinduced channel currents.
Because Glu-169 is protonated in the unphotolyzed state of CaChR1, it does not appear to be an SB proton acceptor in acidic or neutral conditions, in contrast to the homolog Asp-85 in BR, but Glu-169 is expected to play this role at alkaline pH (21). Photoinduced channel current measurements of CaChR1 in the D299N mutant in HEK293 cells indicated that Glu-169 when ionized is a far more efficient acceptor than Asp-299 during P2380 formation. Asp-299 was proposed as an alternative proton acceptor in neutral and acidic conditions and was also reported to play more of a role in channel opening than Glu-169 (8).
The current work along with an earlier FTIR difference study of the primary phototransition (11) suggests a model of the proton transfers in the early photocycle of CaChR1 that is consistent with the biophysical studies. The model postulates that a proton transfer relay mechanism exists between the SB and Asp-299 involving two steps (Fig. 12). (i) A proton is transferred from Glu-169 to Asp-299 during the formation of the P1 intermediate, leaving the Glu-169 in an ionized state and Asp-299 neutral; and (ii) Glu-169, now in an ionized state in P1, accepts a proton from the SB upon its deprotonation and the formation of P2380. Thus, as discussed below, in the P2380, both SB counterions are neutral, possibly triggering channel opening and the flow of cations. Evidence supporting this model based on the FTIR difference and the effects of mutagenesis is summarized below.
FIGURE 12.

Schematic model showing the proposed protonation of the ground state, P1 and P2380 intermediates in CaChR1 along with proposed proton transfers. The large green arrow indicates the photon absorption by the unphotolyzed CaChR1. The smaller arrows indicate proton transfers that occur during the CaChR1 → P1 light-driven transition (green) and P1 → P2380 thermal transition (red).
Asp-299 Is Protonated in P2380
As described under “Results,” positive intensity appears in the CaChR1 → P2380 difference spectrum between 1740 and 1753 cm−1, which is assigned to Asp-299. This is consistent with either a net protonation of the Asp-299 carboxylate or a hydrogen bond alteration of the Asp-299 carboxylic acid group, which occurs between the unphotolyzed state and P2380. However, as described above, independent evidence establishes that at neutral pH, Asp-299 is ionized in the unphotolyzed state (8), ruling out the second possibility (i.e. of a hydrogen bond alteration of a neutral carboxyl group). In addition, a positive band at 1703 cm−1 was assigned to the protonation of Asp-299 during P1 formation (11). It is unknown whether this protonation of Asp-299 occurs during or after 13-cis isomerization of the retinal chromophore during P1 formation. However, ultrafast infrared spectroscopy on CrChR2 reveals a fast deactivation of the excited state followed quickly within 0.5 ps of protein structural changes (32). These findings strongly argue against the possibility that Asp-299 functions as the primary SB proton acceptor during P2380 formation. Instead, the upshift in frequency of the Asp-299 band at 1703 cm−1 to 1741 cm−1 in P2380 indicates that its COOH group undergoes a significant weakening in hydrogen bonding between these two states. This is consistent with a loss of the carboxyl-carboxylate interaction formed between Glu-169 and Asp-299 in the dark state and P1 but lost in P2380 as shown in Fig. 12.
Glu-169 Acts as SB Proton Acceptor during Formation of P2380
A negative band between 1710 and 1720 cm−1 was assigned to Glu-169 during the CaChR1 → P1 primary transition, indicating that this residue deprotonates during this step of the photocycle (11) (Fig. 12). Consistent with this original assignment, a negative band is now assigned to Glu-169 near 1720 cm−1 in the CaChR1 → P2380 difference spectrum. In addition, a positive band assigned to Glu-169 appears near 1728 cm−1, indicating the reprotonation of Glu-169 from the SB upon P2380 formation. The upshift in frequency from ∼1720 to 1728 cm−1 is consistent with a loss of the strong carboxylate (Asp-299)/carboxylic acid (Asp-169) interaction postulated to exist in the ground state and replaced by two neutral forms of these residues in P2380 (Fig. 12).
F139K Has Similar Effect as E169Q in the Carboxylic Acid Stretch Region
The band assigned to the protonated form of Glu-169 at 1728 cm−1 disappears in both the E169Q and the F139K difference spectra. This observation is consistent with the proposed model because like the mutant E169Q, substitution of Phe-139 with a Lys could prevent Glu-169 from functioning as the SB acceptor group and abolish the band assigned to the protonation of this group. This might occur, for example, if the SB proton transferred directly to Asp-299.
One unusual feature of this model of P2380 is that both SB counterions exist in a neutral state along with a non-protonated SB. For example, in the case of the M412 intermediate of BR, Asp-85 is neutral but Asp-212 still has a full or partially negative charge (Fig. 1A). Similar results have also been deduced from FTIR studies of proteorhodopsin and sensory rhodopsin II (33). One possible explanation for this feature is that the region near these two residues and the SB functions as a type of selectivity filter for the CaChR1 cation channel, which opens at P2380. For example, many potassium channels contain a selectivity filter consisting of a narrow pore lined by electronegative carbonyl groups, which are positioned to replace the inner solvation shell of the permeating cation (34). In contrast, it is unlikely that a fully ionized carboxylate group would mimic solvation waters surrounding a cation and in fact might constitute an effective block for passive permeation. In support of this possibility, the chimeric C1C2 structure (31) reveals a putative cation pore that involves electronegative surfaces formed by transmembrane helices A, B, C, and G including Glu-162 and Asp-299 (homologs of Glu-169 and Asp-299 in CaChR1), which are aligned along the pore surface and thus might be in a position to help control cation permeation. In fact, the presence of the positively charged SB and negatively charged Asp-299 in the CaChR1 dark state (Fig. 11) could act as an effective block for cation permeation in contrast to the P2380 state where both Glu-169 and Asp-299 are neutral.
The presence of a neutral residue (Glu-169) in CaChR1 as opposed to a negative charge for the homologous residue in CrChR2 (35) could also account for the red-shifted λmax (525 nm versus 470 nm). Such a red shift is predicted on the basis of a simple point charge model for the SB counterion (36) and supported by earlier studies. For example, neutralization of Asp-85 in BR at low pH accounts for its observed red shift (37). The red-shifted λmax of sensory rhodopsin I at pH below 7 is also accounted for by neutralization of the Asp-76 SB proton counterion (38). However, other factors such the existence of an internal water molecule(s) positioned near the SB as in the case of W402 in BR (17) are also likely to play a role in the determination of the wavelength of visible absorption.
Another difference between BR, CaChR1, and CrChR2 is the isomer content in light- and dark-adapted states. In CaChR1, both RRS and FTIR data indicate that the chromophore remains in an almost pure all-trans isomer form (10, 11). In contrast, upon dark adaptation, BR reverts to approximately a 50/50 mixture of all-trans and 13-cis retinal (39–41). In addition, CrChR2 has a mixture of all-trans and 13-cis retinal in both light-adapted and dark-adapted states (9). This may indicate that the retinal binding pocket of CaChR1, unlike BR and CrChR2, does not easily accommodate a 13-cis retinal isomeric state. This would not be entirely unprecedented because a similar conclusion was reached for NpSRII on the basis of measurements on the rate of 13-cis retinal regeneration (42).
Further studies including additional FTIR difference spectroscopy, kinetic visible absorption, and mutagenesis experiments along with isotope labeling of residues will be necessary to test the suggested proton transfer model in CaChR1 as well as in other low-efficiency ChRs. In this regard, it is interesting to note that the presence of a positively charged residue (e.g. Lys-132) nearby the Asp-85 homolog in CrChR2 and other high-efficiency ChRs (8) is likely to result in a different dark state photoactive site and altered proton transfers as compared with CaChR1 and other low-efficiency ChRs.
Acknowledgments
We thank Erica Saint-Claire, Dan Russano, and Jihong Wang who participated in the early stages of this project along with Jonathan Wurtz who assisted in UV-visible absorption measurements and analysis.
This work was supported by National Science Foundation Grant CBET-1264434 and National Institutes of Health Grants 5R01EY21022 (to K. J. R.) and R01GM027750 (to J. L. S.). This work was also supported by the Hermann Eye Fund and Endowed Chair AU-0009 from the Robert A. Welch Foundation (to J. L. S.).
J. I. Ogren, J. Wurtz, and K. J. Rothschild, unpublished observations.
J. I. Ogren, A. Yi, and K. J. Rothschild, unpublished observations.
- ChR
- channelrhodopsin
- RRS
- resonance Raman spectroscopy
- CaChR1
- channelrhodopsin-1 from Chlamydomonas augustae
- CrChR2
- channelrhodopsin-2 from Chlamydomonas reinhardtii
- BR
- bacteriorhodopsin
- SB
- Schiff base
- C1C2
- chimera of CrChR1 and CrChR2
- FSD
- Fourier-self deconvolution
- SVD
- single value decomposition
- ECPL
- Escherichia coli polar lipids
- mOD
- milli-optical density.
REFERENCES
- 1. Sineshchekov O. A., Jung K. H., Spudich J. L. (2002) Two rhodopsins mediate phototaxis to low- and high-intensity light in Chlamydomonas reinhardtii. Proc. Natl. Acad. Sci. U.S.A. 99, 8689–8694 [DOI] [PMC free article] [PubMed] [Google Scholar]
- 2. Zhang F., Vierock J., Yizhar O., Fenno L. E., Tsunoda S., Kianianmomeni A., Prigge M., Berndt A., Cushman J., Polle J., Magnuson J., Hegemann P., Deisseroth K. (2011) The microbial opsin family of optogenetic tools. Cell 147, 1446–1457 [DOI] [PMC free article] [PubMed] [Google Scholar]
- 3. Arenkiel B. R., Peca J., Davison I. G., Feliciano C., Deisseroth K., Augustine G. J., Ehlers M. D., Feng G. (2007) In vivo light-induced activation of neural circuitry in transgenic mice expressing channelrhodopsin-2. Neuron 54, 205–218 [DOI] [PMC free article] [PubMed] [Google Scholar]
- 4. Gradinaru V., Mogri M., Thompson K. R., Henderson J. M., Deisseroth K. (2009) Optical deconstruction of parkinsonian neural circuitry. Science 324, 354–359 [DOI] [PMC free article] [PubMed] [Google Scholar]
- 5. Kokaia M., Sørensen A. T. (2011) The treatment of neurological diseases under a new light: the importance of optogenetics. Drugs Today (Barc.) 47, 53–62, 10.1358/dot.2011.47.1.1543306 [DOI] [PubMed] [Google Scholar]
- 6. Spudich J. L., Sineshchekov O. A., Govorunova E. G. (2014) Mechanism divergence in microbial rhodopsins. Biochim. Biophys. Acta 1837, 546–552 [DOI] [PMC free article] [PubMed] [Google Scholar]
- 7. Hou S. Y., Govorunova E. G., Ntefidou M., Lane C. E., Spudich E. N., Sineshchekov O. A., Spudich J. L. (2012) Diversity of Chlamydomonas channelrhodopsins. Photochem. Photobiol. 88, 119–128 [DOI] [PMC free article] [PubMed] [Google Scholar]
- 8. Sineshchekov O. A., Govorunova E. G., Wang J., Li H., Spudich J. L. (2013) Intramolecular proton transfer in channelrhodopsins. Biophys. J. 104, 807–817 [DOI] [PMC free article] [PubMed] [Google Scholar]
- 9. Nack M., Radu I., Bamann C., Bamberg E., Heberle J. (2009) The retinal structure of channelrhodopsin-2 assessed by resonance Raman spectroscopy. FEBS Lett. 583, 3676–3680 [DOI] [PubMed] [Google Scholar]
- 10. Ogren J. I., Mamaev S., Russano D., Li H., Spudich J. L., Rothschild K. J. (2014) Retinal chromophore structure and Schiff base interactions in red-shifted channelrhodopsin-1 from Chlamydomonas augustae. Biochemistry 53, 3961–3970 [DOI] [PMC free article] [PubMed] [Google Scholar]
- 11. Ogren J. I., Yi A., Mamaev S., Li H., Lugtenburg J., DeGrip W. J., Spudich J. L., Rothschild K. J. (2015) Comparison of the structural changes occurring during the primary phototransition of two different channelrhodopsins from Chlamydomonas algae. Biochemistry 54, 377–388 [DOI] [PMC free article] [PubMed] [Google Scholar]
- 12. Luecke H., Schobert B., Cartailler J. P., Richter H. T., Rosengarth A., Needleman R., Lanyi J. K. (2000) Coupling photoisomerization of retinal to directional transport in bacteriorhodopsin. J. Mol. Biol. 300, 1237–1255 [DOI] [PubMed] [Google Scholar]
- 13. Braiman M. S., Mogi T., Marti T., Stern L. J., Khorana H. G., Rothschild K. J. (1988) Vibrational spectroscopy of bacteriorhodopsin mutants: light-driven proton transport involves protonation changes of aspartic acid residues 85, 96, and 212. Biochemistry 27, 8516–8520 [DOI] [PubMed] [Google Scholar]
- 14. Lanyi J. K. (2006) Proton transfers in the bacteriorhodopsin photocycle. Biochim. Biophys. Acta 1757, 1012–1018 [DOI] [PubMed] [Google Scholar]
- 15. Rothschild K. J., Braiman M. S., He Y. W., Marti T., Khorana H. G. (1990) Vibrational spectroscopy of bacteriorhodopsin mutants. Evidence for the interaction of aspartic acid 212 with tyrosine 185 and possible role in the proton pump mechanism. J. Biol. Chem. 265, 16985–16991 [PubMed] [Google Scholar]
- 16. Fahmy K., Weidlich O., Engelhard M., Sigrist H., Siebert F. (1993) Aspartic acid-212 of bacteriorhodopsin is ionized in the M and N photocycle intermediates: an FTIR study on specifically 13C-labeled reconstituted purple membranes. Biochemistry 32, 5862–5869 [DOI] [PubMed] [Google Scholar]
- 17. Luecke H., Schobert B., Richter H. T., Cartailler J. P., Lanyi J. K. (1999) Structure of bacteriorhodopsin at 1.55 A resolution. J. Mol. Biol. 291, 899–911 [DOI] [PubMed] [Google Scholar]
- 18. Brown L. S., Sasaki J., Kandori H., Maeda A., Needleman R., Lanyi J. K. (1995) Glutamic acid 204 is the terminal proton release group at the extracellular surface of bacteriorhodopsin. J. Biol. Chem. 270, 27122–27126 [DOI] [PubMed] [Google Scholar]
- 19. Bousché O., Braiman M., He Y. W., Marti T., Khorana H. G., Rothschild K. J. (1991) Vibrational spectroscopy of bacteriorhodopsin mutants: evidence that ASP-96 deprotonates during the M → N transition. J. Biol. Chem. 266, 11063–11067 [PubMed] [Google Scholar]
- 20. Bousché O., Sonar S., Krebs M. P., Khorana H. G., Rothschild K. J. (1992) Time-resolved Fourier transform infrared spectroscopy of the bacteriorhodopsin mutant Tyr-185 → Phe: Asp-96 reprotonates during O formation; Asp-85 and Asp-212 deprotonate during O decay. Photochem. Photobiol. 56, 1085–1095 [DOI] [PubMed] [Google Scholar]
- 21. Li H., Govorunova E. G., Sineshchekov O. A., Spudich J. L. (2014) Role of a helix B lysine residue in the photoactive site in channelrhodopsins. Biophys J. 106, 1607–1617 [DOI] [PMC free article] [PubMed] [Google Scholar]
- 22. Bergo V., Amsden J. J., Spudich E. N., Spudich J. L., Rothschild K. J. (2004) Structural changes in the photoactive site of proteorhodopsin during the primary photoreaction. Biochemistry 43, 9075–9083 [DOI] [PubMed] [Google Scholar]
- 23. Bergo V. B., Ntefidou M., Trivedi V. D., Amsden J. J., Kralj J. M., Rothschild K. J., Spudich J. L. (2006) Conformational changes in the photocycle of Anabaena sensory rhodopsin: absence of the Schiff base counterion protonation signal. J. Biol. Chem. 281, 15208–15214 [DOI] [PubMed] [Google Scholar]
- 24. Hendler R. W., Meuse C. W., Braiman M. S., Smith P. D., Kakareka J. W. (2011) Infrared and visible absolute and difference spectra of bacteriorhodopsin photocycle intermediates. Appl. Spectrosc. 65, 1029–1045 [DOI] [PMC free article] [PubMed] [Google Scholar]
- 25. Muders V., Kerruth S., Lórenz-Fonfría V. A., Bamann C., Heberle J., Schlesinger R. (2014) Resonance Raman and FTIR spectroscopic characterization of the closed and open states of channelrhodopsin-1. FEBS Lett. 588, 2301–2306 [DOI] [PubMed] [Google Scholar]
- 26. Lorenz-Fonfria V. A., Muders V., Schlesinger R., Heberle J. (=2014) Changes in the hydrogen-bonding strength of internal water molecules and cysteine residues in the conductive state of channelrhodopsin-1. J. Chem. Phys. 141, 10.1063/1.4895796 [DOI] [PubMed] [Google Scholar]
- 27. Roepe P., Ahl P. L., Das Gupta S. K., Herzfeld J., Rothschild K. J. (1987) Tyrosine and carboxyl protonation changes in the bacteriorhodopsin photocycle. 1. M412 and L550 intermediates. Biochemistry 26, 6696–6707 [DOI] [PubMed] [Google Scholar]
- 28. Maeda A., Sasaki J., Shichida Y., Yoshizawa T., Chang M., Ni B., Needleman R., Lanyi J. K. (1992) Structures of aspartic acid-96 in the L and N intermediates of bacteriorhodopsin: analysis by Fourier transform infrared spectroscopy. Biochemistry 31, 4684–4690 [DOI] [PubMed] [Google Scholar]
- 29. Bergo V., Spudich E. N., Spudich J. L., Rothschild K. J. (2002) A Fourier transform infrared study of Neurospora rhodopsin: similarities with archaeal rhodopsins. Photochem Photobiol 76, 341–349 [DOI] [PubMed] [Google Scholar]
- 30. Bergo V., Spudich E. N., Spudich J. L., Rothschild K. J. (2003) Conformational changes detected in a sensory rhodopsin II-transducer complex. J. Biol. Chem. 278, 36556–36562 [DOI] [PubMed] [Google Scholar]
- 31. Kato H. E., Zhang F., Yizhar O., Ramakrishnan C., Nishizawa T., Hirata K., Ito J., Aita Y., Tsukazaki T., Hayashi S., Hegemann P., Maturana A. D., Ishitani R., Deisseroth K., Nureki O. (2012) Crystal structure of the channelrhodopsin light-gated cation channel. Nature 482, 369–374 [DOI] [PMC free article] [PubMed] [Google Scholar]
- 32. Neumann-Verhoefen M. K., Neumann K., Bamann C., Radu I., Heberle J., Bamberg E., Wachtveitl J. (2013) Ultrafast infrared spectroscopy on channelrhodopsin-2 reveals efficient energy transfer from the retinal chromophore to the protein. J. Am. Chem. Soc. 135, 6968–6976 [DOI] [PubMed] [Google Scholar]
- 33. Kralj J. M., Bergo V. B., Amsden J. J., Spudich E. N., Spudich J. L., Rothschild K. J. (2008) Protonation state of Glu142 differs in the green- and blue-absorbing variants of proteorhodopsin. Biochemistry 47, 3447–3453 [DOI] [PubMed] [Google Scholar]
- 34. Doyle D. A., Morais Cabral J., Pfuetzner R. A., Kuo A., Gulbis J. M., Cohen S. L., Chait B. T., MacKinnon R. (1998) The structure of the potassium channel: molecular basis of K+ conduction and selectivity. Science 280, 69–77 [DOI] [PubMed] [Google Scholar]
- 35. Ito S., Kato H. E., Taniguchi R., Iwata T., Nureki O., Kandori H. (2014) Water-containing hydrogen-bonding network in the active center of channelrhodopsin. J. Am. Chem. Soc. 136, 3475–3482 [DOI] [PubMed] [Google Scholar]
- 36. Honig B., Dinur U., Nakanishi K., Balogh-Nair V., Gawinowicz M. A., Arnaboldi M., Motto M. G. (1979) An external point-charge model for wavelength regulation in visual pigments. J. Am. Chem. Soc. 101, 7084–7086 [Google Scholar]
- 37. Rath P., Marti T., Sonar S., Khorana H. G., Rothschild K. J. (1993) Hydrogen bonding interactions with the Schiff base of bacteriorhodopsin: resonance Raman Spectroscopy of the mutants D85N and D85A. J. Biol. Chem. 268, 17742–17749 [PubMed] [Google Scholar]
- 38. Rath P., Spudich E., Neal D. D., Spudich J. L., Rothschild K. J. (1996) Asp76 is the Schiff base counterion and proton acceptor in the proton-translocating form of sensory rhodopsin I. Biochemistry 35, 6690–6696 [DOI] [PubMed] [Google Scholar]
- 39. Pettei M. J., Yudd A. P., Nakanishi K., Henselman R., Stoeckenius W. (1977) Identification of retinal isomers isolated from bacteriorhodopsin. Biochemistry 16, 1955–1959 [DOI] [PubMed] [Google Scholar]
- 40. Smith S. O., Pardoen J. A., Lugtenburg J., Mathies R. A. (1987) Vibrational analysis of the 13-cis-retinal chromophore in dark-adapted bacteriorhodopsin. J. Phys. Chem. 91, 804–819 [Google Scholar]
- 41. Roepe P. D., Ahl P. L., Herzfeld J., Lugtenburg J., Rothschild K. J. (1988) Tyrosine protonation changes in bacteriorhodopsin: a Fourier transform infrared study of BR548 and its primary photoproduct. J. Biol. Chem. 263, 5110–5117 [PubMed] [Google Scholar]
- 42. Hirayma J., Kamo N., Imamoto Y., Shichida Y., Yoshizawa T. (1995) Reason for the lack of light-dark adaptation in pharaonis phoborhodopsin: reconstitution with 13-cis-retinal. FEBS Lett. 364, 168–170 [DOI] [PubMed] [Google Scholar]


