

Background: Arrestins regulate the signaling of rhodopsin-like G protein-coupled receptors.
Results: We isolated the infrared spectra of rhodopsin·arrestin-1 complex formation.
Conclusion: Complex formation stabilizes the active receptor and is accompanied by β-sheet loss. During decay, arrestin stabilizes only half of the receptor population in the active form.
Significance: Our new approach extends knowledge from x-ray structures and other recent spectroscopic studies.
Keywords: arrestin, G protein-coupled receptor (GPCR), infrared spectroscopy (IR spectroscopy), rhodopsin, signal transduction, spectroscopy
Abstract
In the G protein-coupled receptor rhodopsin, light-induced cis/trans isomerization of the retinal ligand triggers a series of distinct receptor states culminating in the active Metarhodopsin II (Meta II) state, which binds and activates the G protein transducin (Gt). Long before Meta II decays into the aporeceptor opsin and free all-trans-retinal, its signaling is quenched by receptor phosphorylation and binding of the protein arrestin-1, which blocks further access of Gt to Meta II. Although recent crystal structures of arrestin indicate how it might look in a precomplex with the phosphorylated receptor, the transition into the high affinity complex is not understood. Here we applied Fourier transform infrared spectroscopy to monitor the interaction of arrestin-1 and phosphorylated rhodopsin in native disc membranes. By isolating the unique infrared signature of arrestin binding, we directly observed the structural alterations in both reaction partners. In the high affinity complex, rhodopsin adopts a structure similar to Gt-bound Meta II. In arrestin, a modest loss of β-sheet structure indicates an increase in flexibility but is inconsistent with a large scale structural change. During Meta II decay, the arrestin-rhodopsin stoichiometry shifts from 1:1 to 1:2. Arrestin stabilizes half of the receptor population in a specific Meta II protein conformation, whereas the other half decays to inactive opsin. Altogether these results illustrate the distinct binding modes used by arrestin to interact with different functional forms of the receptor.
Introduction
Nearly every physiological system in the animal organism is controlled in some part by G protein-coupled receptors (GPCRs).2 These cell surface receptors share a common structure and activation mechanism whereby agonist binding induces structural changes within the seven-transmembrane helical bundle of the receptor that activate the cytoplasmic face for binding of G proteins (1). In the GPCR rhodopsin, the absorption of a quantum of visible light induces 11-cis-/all-trans isomerization of the retinal ligand, which is bound to the opsin apoprotein via a protonated Schiff base. This converts the retinal from an inverse agonist to a potent agonist that triggers stepwise conformational changes of the protein. Milliseconds after light activation, the receptor exists in equilibrium between the so-called Meta I and Meta II states (Scheme 1). Meta I displays few structural deviations from dark state rhodopsin, including a slightly moved transmembrane helix 5 (TM5) (2). Deprotonation of the Schiff base accompanies the change to Meta IIa, the first of three identified Meta II substates (3, 4).
SCHEME 1.
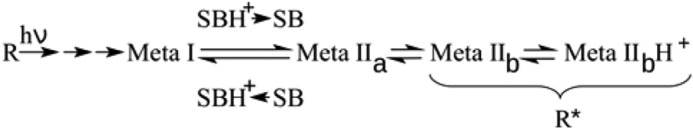
The subsequently formed Meta IIb (5) is the first to exhibit an outward tilt of TM6 (6), which is stabilized by rearrangements of conserved domains and new interactions. TM6 movement opens the conserved (E/D)RY region near the cytoplasmic end of TM3 for protonation of the carboxyl group of Glu-1343.49 (numbering according to Ballesteros and Weinstein (7)) after its release from Arg-1353.50, thus enabling the Meta IIbH+ state (1, 3). Although rhodopsin is a special case because of its covalently bound ligand, the different receptor states have structural equivalents in other GPCRs that are activated by diffusible ligands (8). Furthermore, we recently observed that peptide analogues of the C termini of the α and γ subunits of Gt have distinct preferences for the different Meta II substates (9). Hence, both Meta IIb and Meta IIbH+ are involved in specific stages of the coupling to the G protein and thus form together the active R* state of the receptor (9).
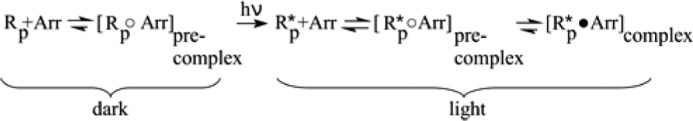
R* decays to the aporeceptor opsin within minutes after light activation when the retinal Schiff base linkage is hydrolyzed and all-trans-retinal is released. Before this occurs, R* signaling is terminated in a two-step process. First, rhodopsin kinase phosphorylates several sites within the receptor C-terminal tail. Second, arrestin-1 binds phosphorylated R* (R*p), thereby blocking further interaction of R*p with Gt. Besides their role as quenchers of GPCR signaling, arrestins can also mediate their own signaling pathways (10). In the visual system, arrestin can induce the uptake of all-trans-retinal by phosphorylated opsin apoprotein (11). Based on this finding, a role for arrestin-1 as a protector of the rod cell against the toxic effects of all-trans-retinal has recently been proposed (12).
Structurally arrestin consists of two crescent-shaped lobes composed largely of β-sheet termed the N- and C-domains (13, 14). The conformation of basal arrestin is stabilized by multiple interlobe hydrogen bonds and hydrophobic interactions, including extensive interactions between the long C-terminal tail of arrestin (C-tail) and the N-domain. Arrestin (Arr) binding to R*p occurs in a stepwise process as shown in Scheme 2.
SCHEME 2.
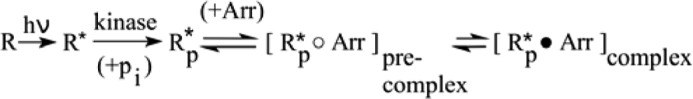
The first step entails a precomplex R*p○Arr in which interaction with the phosphorylated C terminus of the receptor displaces the C-tail of arrestin and thereby activates arrestin for R* binding (for a review, see Ref. 15). Arrestin activation entails an interlobe rotation and displacements of several key receptor-binding loops in the central crest region (16, 17). Together, these conformational changes prime arrestin for the intramolecular conversion required for the second binding step and formation of the high affinity complex R*p·Arr (18). Although a recent crystal structure of arrestin bound to a phosphopeptide mimic of the phosphorylated receptor C terminus gives some indication of what arrestin might look like in the precomplex (17), no high resolution information for the high affinity arrestin·receptor complex has so far been reported.
Fourier transform infrared (FTIR) spectroscopy is a powerful tool to monitor functional changes in proteins. It can be applied to membrane suspensions in a similar composition as occurs in situ. FTIR studies of rhodopsin have elucidated the structural alterations during the early rhodopsin activation pathway (19, 20) as well as the differences between the Meta II states (4, 21). Here we applied this method to observe the interaction of arrestin-1 with phosphorylated rhodopsin in native rod outer segment disc membranes. Our results provide insight into how the structures of rhodopsin and arrestin are affected by one another during the light-induced transition from the precomplex to the high affinity complex. The FTIR data indicate further that during the decay of active R* arrestin stabilizes half of the receptor population in the active form, whereas the other half of the population decays to inactive opsin. These findings verify our previous results (11, 22) and elucidate the conformational changes in rhodopsin and arrestin during the decay process.
EXPERIMENTAL PROCEDURES
Sample Preparation
11-cis-Retinal was generated from commercially available all-trans-retinal (Sigma) by light exposure and purified using high pressure liquid chromatography (23). The high affinity peptide analogue derived from the C terminus of the Gt α subunit (NH2-ILENLKDCGLF-COOH) was synthesized commercially. Phosphorylated rhodopsin in native disc membranes was prepared as described (11). Briefly, rod outer segments were isolated from frozen bovine retina (W. L. Lawson Co.) by a sucrose gradient method. Rhodopsin was phosphorylated by the native rhodopsin kinase present in rod outer segments at room temperature under white light in the presence of 8 mm adenosine triphosphate (ATP) (buffer conditions, 100 mm potassium phosphate, pH 7.4, 2 mm magnesium chloride). Two hours after the onset of illumination, 20 mm hydroxylamine was added to hydrolyze all retinal Schiff bases. The disc membranes containing phosphorylated opsin were then washed several times with 100 mm HEPES buffer, pH 7.0 and resuspended in 100 mm HEPES buffer, pH 8.0. Phosphorylated rhodopsin was regenerated by adding a 3-fold molar excess of 11-cis-retinal to phosphorylated opsin. Regeneration was quenched by the addition of 20 mm O-tert-butylhydroxylamine (24), which was then removed by several washing steps.
The efficiency of phosphorylation of the receptors in disc membranes was verified by UV/visible spectroscopy by comparing the amplitude of Meta II stabilization by arrestin with that stabilized by the high affinity peptide analogue of the Gt α subunit C terminus (11). This method indicated that 100% of receptors in the preparations used for this study were capable of interacting with arrestin as light-activated Meta II. Bovine arrestin-1 lacking native cysteine and tryptophan residues (C63A,C128S,C143A,W194F) was expressed in Escherichia coli and purified as described (25). This mutant arrestin is functionally equivalent to wild-type arrestin (22).
Membranes containing phosphorylated rhodopsin were pelleted by centrifugation (14,000 × g, 30 min) and then resuspended with a solution of concentrated arrestin (∼1 mm) in 100 mm HEPES buffer, pH 8. The resulting suspension was again pelleted by centrifugation and transferred to a BaF2 cuvette for FTIR measurements. Final concentrations were 300–500 μm phosphorylated rhodopsin with a 2-fold excess of arrestin. Note that the maximum amount of active receptor accessible for interaction with arrestin in the highly concentrated FTIR samples was similar to the amount accessible to the peptide analogue of the Gt α subunit C terminus (typically >85% as estimated by the FTIR difference spectra (26)). Control samples of rhodopsin alone were prepared in an identical fashion without arrestin.
p44 purification was modified based on the previously published protocol (16). We optimized p44 expression levels by using freshly transformed E. coli BL21 cells for expression, culturing at 28 °C, and inducing with 30 μm isopropyl β-d-thiogalactopyranoside for 24 h. Cells were lysed by passing three times through a microfluidizer (Microfluidics Corp., M-110L). Purification was performed similarly as for arrestin except the strong cation exchanger SP-Sepharose (GE healthcare) was used for the second ion exchange step followed by an additional purification step using size exclusion chromatography.
Spectroscopy and Data Analysis
FTIR spectroscopy was performed with a Bruker ifs66/v vacuum spectrometer equipped with a liquid N2-cooled HgCdTe detector. Samples were measured in a temperature controlled BaF2 cuvette (4-μm optical pathlength) in rapid scan mode with a time resolution of ≥200 ms. Illumination (5 s) was performed by four light-emitting diodes (λmax = 580 nm, 50,000 millicandelas; Winger Electronics GmbH and Co. KG, Dessau-Rosslau, Germany) placed to achieve a homogeneous irradiation that light-activated ∼100% of rhodopsin.
A set of N time-dependent IR absorbance spectra (absorbance as a function of wavenumber and time, A(ν,ti); i = 1 … N where ν is wavenumber and t is time) was recorded covering the time span before (at least 2 min), during, and after illumination. A spectrum of the dark state was calculated by averaging all spectra measured during the 2-min dark period. This dark state average was then subtracted from each spectrum of the complete set to obtain a set of difference spectra D(ν,t) as described (27). Hence, negative peaks in the difference spectra correspond to vibrations of the initial dark state, and positive bands correspond to the illuminated state. Slow baseline distortions of the spectra that occurred due to slight temperature variations of the sample and/or the detector were seen as baseline drifts in the time period before illumination. After onset of the illumination, the light-induced spectral changes were partially superimposed on the drift. The data set was corrected for such drifts by extrapolating and subtracting the time-dependent changes observed before illumination at each recorded wavenumber vj. All data sets were normalized by multiplication with a normalization factor estimated for each data set by a linear global fit of the spectral range between 1220 and 1260 cm−1 to the reference spectrum. In cases of pure Meta II conditions, this was additionally verified by the intensity of the Meta II marker band at 1768 cm−1. Spectra describing pure transition components (b-spectra) and the corresponding kinetic constants of these components were derived by a combination of singular value decomposition (SVD) and global fitting as described (28, 29). Briefly, the measured and baseline-corrected time-dependent data sets of difference spectra D(ν,t) were decomposed into three matrices: D = U × S × VT where U is an orthogonal matrix of independent spectral components, S is the matrix of the singular values, and V is the matrix of kinetics. In the next step, a rotation procedure based on the autocorrelation function of the columns of V was applied, and components containing only noise were discarded. Thus, a new data set with improved signal-to-noise ratio was obtained. Finally, after re-establishing orthonormality by a second application of SVD, a global fit procedure utilizing the columns of the kinetics matrix was applied under the assumption of a sequential reaction scheme. This yielded b-spectra that represent the difference spectra of pure transitions from one state to the next characterized by the same kinetics (29). Calculations were performed with GNU Octave. To uncover differences between the samples with and without arrestin, double differences (ΔD) were calculated by subtracting the b-spectra (difference spectra) without arrestin (R*p − Rp) from the spectra obtained in the presence of arrestin (R*′p·Arr′ − Rp○Arr) where R*′p and Arr′ denote the protein forms in the high affinity complex. Small contributions of Meta I that might occur due to unbound receptor were estimated by linear global fitting to a Meta I reference spectrum obtained at −20 °C, pH 8 using a least square algorithm (26) and subtracted accordingly. Positive bands in the double difference spectra therefore occur due to vibrations of the high affinity R*′p·Arr′ complex, whereas negative bands result from vibrations of the Rp○Arr precomplex.
The double difference can be expressed as follows.
Using the spectrum of rhodopsin○arrestin precomplex formation δ, which is the difference of the absorption spectrum of the precomplex and the corresponding absorption spectra of uncomplexed rhodopsin and arrestin, δ = Rp○Arr − (Rp + Arr), the double difference can be written as follows.
In other words, this double difference covers all changes that occur during transition from Meta II and uncomplexed arrestin to their complexed forms with the exception of all changes that already have appeared in arrestin and rhodopsin during precomplex formation (δ). Bands due to high affinity complex formation are normally positive in amplitude.
The change in β-sheet content of the samples was estimated using the change in absorbance at the band position at 1623 cm−1 of a mixture of R*p and Arr illuminated at pH 8, 30 °C. The contribution of β-sheet to the total absorbance was obtained by fitting the absorbance spectrum of the dark state in the amide I region by a sum of Lorentzian functions (30). As reference, 100 mm HEPES buffer was used.
RESULTS
Experimental Strategy
Arrestin affinity for the aporeceptor opsin increases as the level of receptor phosphorylation increases (31), and efficient binding to light-activated rhodopsin requires at least three phosphates per receptor (31, 32). We prepared samples for spectroscopy by mixing a 2-fold molar excess of arrestin with concentrated native rod outer segment membranes containing dark state rhodopsin that was highly phosphorylated to favor complete association. Control experiments indicated that preparations containing either lower levels of receptor phosphorylation or less concentrated arrestin yield FTIR spectra that are noisy and difficult to interpret.
We compared the FTIR difference spectra of phosphorylated rhodopsin with those of nonphosphorylated rhodopsin. Both preparations yielded nearly identical difference spectra of Meta II formation at pH 7 and 20 °C (Meta II conditions; Fig. 1A), indicating that the influence of phosphorylation itself on the active state structure of the receptor is negligible. Under Meta I conditions (pH 8, 1 °C), we observed that receptor phosphorylation shifted the Meta I/Meta II equilibrium toward Meta II (Fig. 1B), which has been reported previously (33). For experiments using arrestin, we can safely assume nearly all receptors are in precomplex with arrestin in the dark state because of the high phosphorylation content of our receptor preparations and the fact that arrestin binds phosphorylated rhodopsin (Rp) with a KD of ∼1 μm (11, 34). Hence, our data reflect the light-triggered transition from the precomplex of arrestin and Rp to the high affinity complex of arrestin and R*p as shown in Scheme 3.
FIGURE 1.
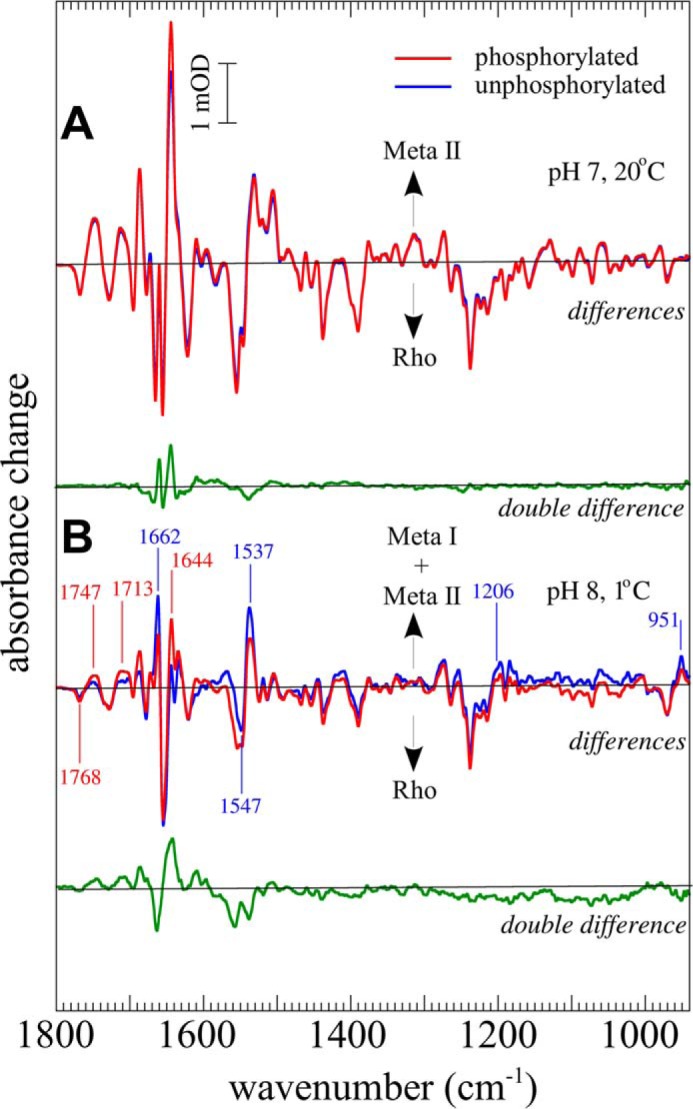
Influence of phosphorylation on the meta states of rhodopsin. A, FTIR difference spectra (illuminated state minus dark state) of Rp (red) and nonphosphorylated R (blue) under conditions favoring Meta II (pH 7, 20 °C). Negative bands occur due to vibrations of the dark state of R or Rp (Rho), whereas positive bands occur due to vibrations of the corresponding illuminated states (Meta I and/or Meta II). The double difference (difference spectrum of phosphorylated sample minus difference spectrum of nonphosphorylated sample) is shown in green. B, FTIR difference spectra of phosphorylated rhodopsin (red) and nonphosphorylated rhodopsin (blue) under conditions favoring Meta I (pH 8, 1 °C) and double difference (green). Difference bands typical for Meta I (1662 1547, 1537, 1206, and 951 cm−1) and Meta II (1768, 1747, 1713, and 1644 cm−1) are indicated.
SCHEME 3.
The Fingerprint of Arrestin Binding
We first investigated arrestin-1 binding to Rp under conditions favoring Meta II (30 °C). Difference spectra of the illumination of phosphorylated rhodopsin (illuminated state minus dark state) were recorded as a function of time in the presence and absence of arrestin. Measurements in the presence of arrestin were performed at pH 8 in the interest of arrestin stability, whereas measurements in the absence of arrestin were performed at pH 5, which is optimal for Meta IIbH+ formation (4, 21).
To minimize the influence of decay processes due to the high temperature, pure difference spectra of the light-induced activation were calculated by SVD and global analysis as described (see “Experimental Procedures” and Ref. 29), and residual Meta I occurring under this condition (<10%) was estimated by a least square global fitting procedure (26) and subtracted. The accuracy of this method was verified by comparing the absorbance changes at 1768 and 1748 cm−1 where typical Meta II bands that are due to changes of hydrogen bonding of Asp-832.47 occur (35). This procedure yielded spectra solely representing vibrational patterns of the rhodopsin-Meta II transition and arrestin binding. Accordingly, the difference spectrum in the presence of arrestin (Fig. 2A, red) is a superposition of the difference spectrum of receptor activation in the absence of arrestin under optimal Meta II conditions (Fig. 2A, blue) and all changes induced in both proteins by high affinity complex formation. Typical Meta II features include the prominent marker bands at 1768 (C=O mode of protonated Asp-832.47; Meta IIa), 1727/1748 (protonated Asp-832.47 and Glu-1223.37; Meta IIb/Meta IIbH+), 1713 (protonation of Glu-1133.23, counterion of the Schiff base), 1644 (amide I mode of Meta IIb/Meta IIbH+), and 1555 cm−1 (amide II and C=C stretch of the chromophore) (20). Specific changes induced by complex formation were then extracted by the double difference spectrum (difference spectrum with arrestin minus difference spectrum without arrestin; Fig. 2B, green), which we refer to as the “arrestin binding spectrum” (ABS). The ABS reflects all structural alterations in both proteins that are due to high affinity complex formation. New features in the amide I region include a large positive band at 1660 cm−1 accompanied by smaller positive bands at 1685 and 1642 cm−1 and two negative bands at 1694 and 1625 cm−1. By position and relative intensity, the amide I bands at 1694 and 1625 cm−1 likely represent high and low frequency modes of β-sheets or β-turns (36, 37). Using model proteins, it was observed that such bands undergo a slight deuteration-induced downshift when caused by β-sheets or β-turns (38). In the ABS, the two bands shift to 1684 and 1622 cm−1 in 2H2O, respectively, which correspond well to the expected values (Fig. 2C, green for H2O and red for 2H2O). Using the infrared absorbance at 1622 cm−1, we estimated that ∼5% of the total β-sheet structure was lost upon activation. The changes in the amide I region are accompanied by bands at 1539 (positive) and 1555 cm−1 (negative) in the amide II range, which is also sensitive to changes of the secondary structure. Typical amide II bands of β-sheets often occur near 1533 cm−1, but positions between 1523 and 1555 cm−1 have been observed (39) or calculated (40). In comparison, the main absorption band of β-sheet-rich arrestin-1 occurs in the amide II range at 1548 cm−1 (data not shown). Hence, we conclude that the negative difference band seen at 1555 cm−1 also reflects in part loss of β-sheet in agreement with the observations made from the amide I region.
FIGURE 2.
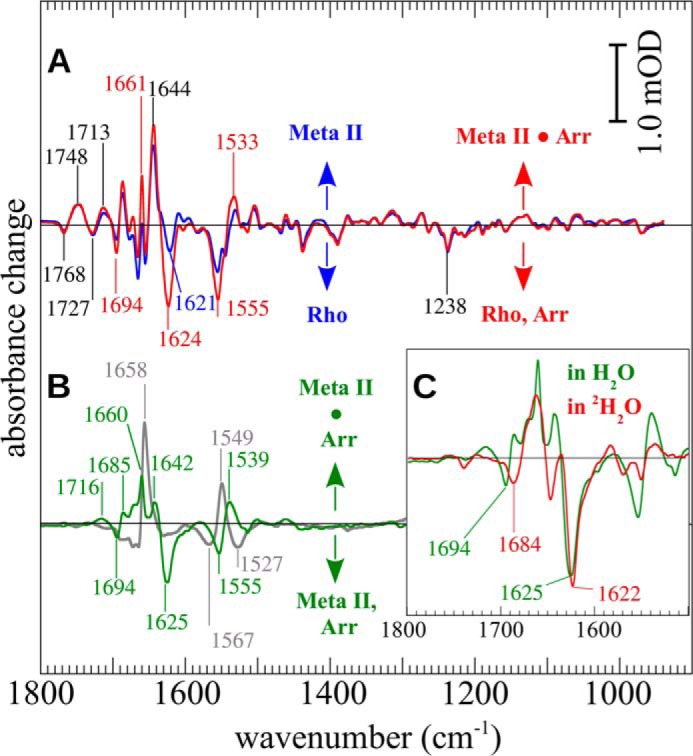
FTIR spectroscopy of phosphorylated rhodopsin (Rho) activation and Arr binding. A, the difference spectra (illuminated state minus dark state) of phosphorylated rhodopsin in the absence (blue) or presence (red) of an excess of arrestin (R*p·Arr difference spectrum) measured at 30 °C. New bands that occur in the presence of arrestin are indicated in red. B, deviations between the arrestin-free and the arrestin-containing sample are more clearly seen in the double difference spectrum (dark green) where the pure Meta II difference spectrum is subtracted from the R*p·Arr difference spectrum (ABS). For comparison, the double difference spectrum obtained with the high affinity peptide analogue derived from the C terminus of the α subunit of the G protein is also shown (gray; peptide binding spectrum). Inset, H2O/2H2O exchange leads to significant shifts of the two prominent negative bands at 1694 and 1625 cm−1 in the arrestin binding spectrum (green, in H2O; red, in 2H2O).
The large positive band at 1660 cm−1 in the ABS was similar to the dominant band seen in the binding spectrum of a high affinity peptide analogue of the C terminus of the Gt α subunit (“peptide binding spectrum”; Fig. 2B, gray) that was assigned to conformational changes of rhodopsin induced by peptide binding (41). Formation of the C-terminal reverse turn (C-cap) in the arrestin finger loop (42) might also contribute to this band.
Interestingly, we observed no large deviation of the spectra in the region below 1300 cm−1 where the vibrational modes of phosphate groups are expected (43, 44). This lack of signal argues against light-induced binding of free arrestin to R*p during the experiment (because it was already in the precomplex) and indicates a very limited change in the interactions of phosphate groups in the transition from the precomplex to the high affinity complex.
Arrestin-induced Shift of Receptor Conformation
Arrestin-induced changes of receptor conformation were recorded under conditions favoring Meta I (0 °C, pH 8) where binding of arrestin leads to a shift of the Meta I/Meta II equilibrium toward Meta II (18). Global analysis of the time-dependent data sets of light-activation of Rp in the absence of arrestin yielded the expected monophasic transition (t½ < 1 s) to a mixture of 75% Meta I and 25% Meta II (Fig. 3A, blue). In the presence of arrestin, the analysis indicated a biphasic process. A fast component, completed within the illumination period (t½ < 1 s) (Fig. 3A, red), contained ∼50% Meta II. The augmentation of Meta II is seen by the marker bands at 1768, 1748, and 1713 cm−1, and arrestin binding is indicated by the bands at 1694, 1624, and 1555 cm−1. In this spectrum, the prominent band at 1661 cm−1 is a marker for both Meta I and Meta IIbH+ (9). Consequently, the intensity of this band is significantly higher than in the reference measured in absence of arrestin where only Meta I contributes to this band. The spectral signature of the subsequent slow component (t½ ∼ 20 s) is shown in Fig. 3B (red). Comparison with a pure Meta II minus Meta I difference spectrum (Fig. 3B, blue) reveals contributions of both the Meta I to Meta IIbH+ conversion (1768, 1744, 1713, and 1644 cm−1) and arrestin binding (1694, 1624, 1661, and 1555 cm−1). Besides these two transitions, no further contributions to the spectral signature were observed. Note that although the band at 1661 cm−1 generally indicates the presence of either Meta I or Meta IIbH+ the contribution of Meta I to this band in the arrestin binding spectrum can be excluded. The correction procedure applied to remove residual shares of Meta I in the spectra used to calculate the arrestin binding spectrum was based on global fitting, which took into account the whole spectral signature of Meta I. If any residual Meta I contributed to 1661 cm−1, then other bands typical for Meta I, such as 1547, 1537, or 1206 cm−1 (compare Fig. 1), would have also indicated the presence of this species. However, this was not the case.
FIGURE 3.
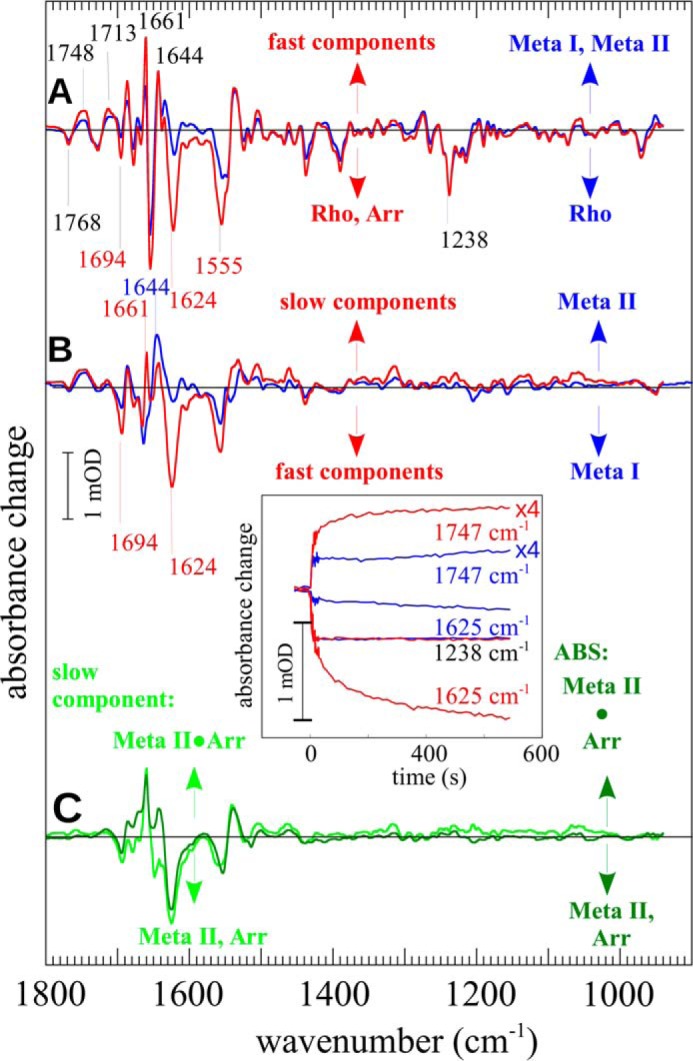
Arrestin-induced shift of the Meta I/Meta II equilibrium. Illumination of a mixture of Arr and dark state Rp (Rho) was performed under conditions favoring Meta I (pH 8, 0 °C). Global analysis revealed two components. A, the first component (red) occurred seconds after illumination. For comparison, the difference spectrum of an arrestin-free Rp sample under the same conditions is given (blue). B, the second component (red) appeared within minutes after illumination (t½ ∼ 20 s) and closely resembles the difference spectrum of the conversion from Meta I to Meta II as given for comparison (blue). C, the double difference spectra showing the arrestin-induced structural alterations of solely the slow component (light green) in comparison with the ABS (dark green as in Fig. 1B). Inset, time courses of marker bands of retinal isomerization (1238 cm−1), Meta IIb formation (1747 cm−1), and arrestin β-sheet alterations (1625 cm−1) are given for experiments in the absence (blue) and presence (red) of arrestin. The bands at 1747 cm−1 were enlarged by a factor of 4 for better visibility.
The overall kinetics of the subprocesses of light activation, namely cis/trans isomerization (characterized i.e. by the band at 1238 cm−1), Meta IIb formation (1748 cm−1), and loss of arrestin β-sheet associated with high affinity binding (1625 cm−1) is shown in Fig. 3, inset. In the absence of arrestin, all bands showed a rise time faster than the time resolution of the experiment (blue traces). In the presence of arrestin (red traces), those bands reflecting structural alterations occurring prior to Meta II formation (e.g. 1238 cm−1) were still fast, but changes of Meta IIb/Meta IIbH+ (1748 and 1644 cm−1) and arrestin (1625 cm−1) displayed an additional slow component. This kinetic similarity indicates that the loss of arrestin β-sheet corresponds to the stabilization of Meta IIb/Meta IIbH+; in other words, arrestin binds the active receptor conformation. Essentially all accessible light-activated receptors were stabilized as Meta IIb/Meta IIbH+ (>90%) with ≈50% in the fast reaction and ≈50% in the slow reaction as estimated by the global fit procedure. Both the fast and slow components were characterized by the same spectral signature of arrestin binding (Fig. 3C, ABS).
The identical spectral signatures of the fast and slow components provide strong evidence that both components originated from the same Rp○Arr precomplex and resulted in the same high affinity R*p·Arr complex (Scheme 3). However, this conclusion relies on the assumption that all arrestin was in precomplex with Rp before illumination. To test this hypothesis, we performed experiments with p44 (45), a naturally occurring, preactivated splice variant of arrestin lacking the regulatory C-tail that is completely bound to dark state Rp even at low micromolar concentrations (46). Interestingly, we observed that p44 showed the same biphasic binding kinetics (Fig. 4A) with a contribution of the fast component of 58 ± 5% in the case of p44 and of 51 ± 5% for arrestin. The binding spectrum of p44 was nearly identical to the ABS (Fig. 4B). The similarities between p44 and arrestin support the supposition that arrestin was in precomplex with Rp before illumination in our experiments.
FIGURE 4.
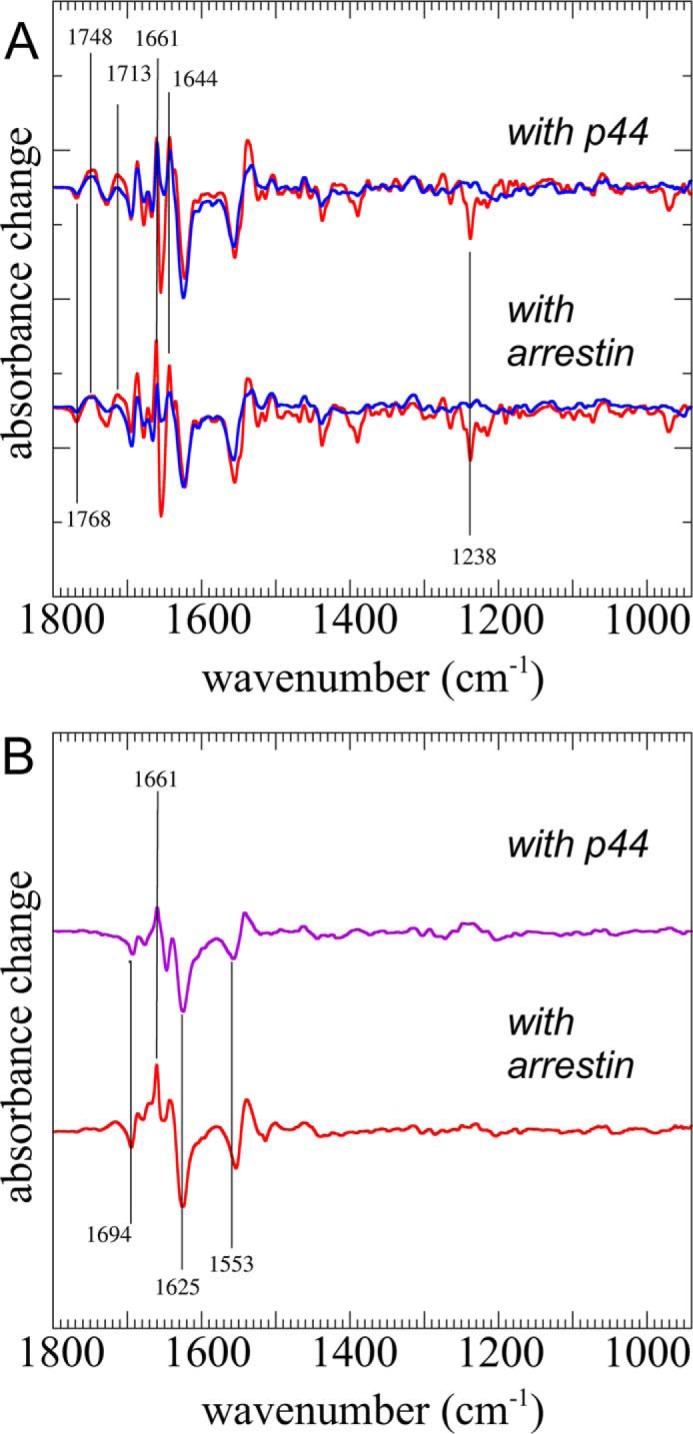
Interaction of Rp with the arrestin splice variant p44. A, difference spectra of the fast (red) and slow (blue) components of a mixture of phosphorylated rhodopsin and p44 (upper spectra) or arrestin (lower spectra) following light activation. B, binding spectrum of p44 (violet) and ABS (red) as calculated from the slow components.
Decay of the R*p·Arr Complex
To investigate the stability of the R*p·Arr complex, kinetic traces at different wavelengths were extracted from time-dependent spectral data sets obtained at 30 °C, pH 8. Kinetics of Meta IIb/Meta IIbH+ formation and decay were followed at 1644 cm−1 with and without arrestin (Fig. 5A). In the presence of arrestin (red), the initial amplitude of the band following light activation was almost doubled due to the arrestin-induced shift in the meta equilibrium toward Meta IIb/Meta IIbH+. Decay of Meta IIb/Meta IIbH+ was monophasic with similar half-times of t½ = 110 s and t½ = 100 s with and without arrestin, respectively. In the absence of arrestin (blue), the amplitude of the band decayed completely to dark state level, whereas in the presence of arrestin it remained elevated at ∼50% of the initial light-activated level. The bands at 1625 and 1694 cm−1, which monitor changes in β-sheet content accompanying the R*p·Arr complex formation, followed a similar time course as Meta II decay (Fig. 5B). Analogously to the 1644 cm−1 band, these bands plateaued at ∼50% of their initial level in the presence of arrestin. In the absence of arrestin, only the residual overlapping bands that occur at these positions due to alterations of rhodopsin (compare Fig. 1) were seen. In this case, the negative bands follow Meta II decay.
FIGURE 5.
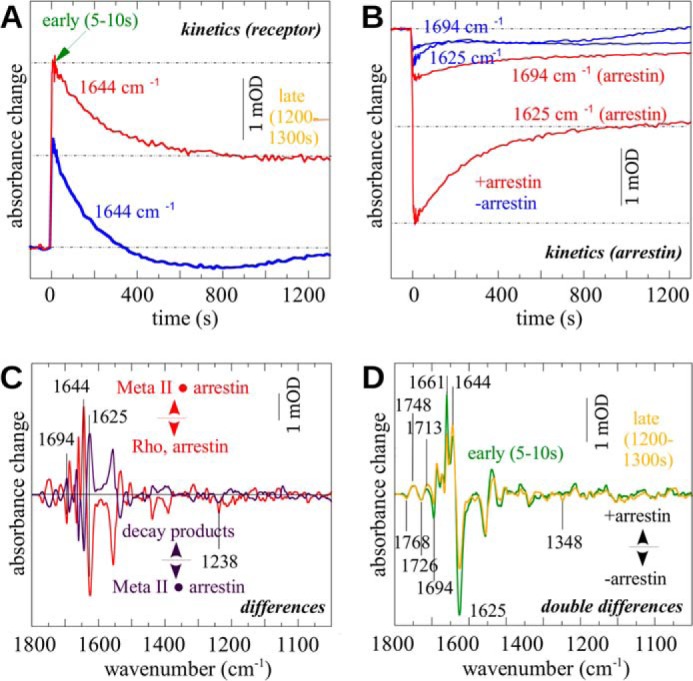
Decay of the R*p·Arr complex. Rp was illuminated with orange light at 30 °C in the presence and absence of arrestin, and the sample was observed spectroscopically over time. A, kinetics of the 1644 cm−1 amide I band indicative for the Meta IIb subspecies (red, sample with arrestin; blue, sample without arrestin). B, kinetics of the bands at 1694 and 1625 cm−1 reflecting conformational alterations of β-sheets (red). In the arrestin-free case (blue), small residual bands of rhodopsin remain at both positions that indicate Meta II decay and formation of opsin and/or Meta III. C, by SVD and global fitting, the main components of the illumination (red) and subsequent decay process (violet) were determined. The amplitudes of typical Meta II marker bands indicate that after decay half of the receptor population remains in a Meta II-like state. D, double differences (difference spectra with arrestin minus difference spectra without arrestin) at the beginning (5–10 s after illumination; dark green) and at the end of the decay process (∼1200–1300 s after illumination; orange). Positive bands indicate arrestin-dependent increases in absorption, whereas negative bands indicate arrestin-dependent losses of absorption.
SVD and global analysis were used to estimate additional bands that decayed with the same kinetics in the presence of arrestin. The resulting “deactivation spectrum” reflects the changes that occur in the infrared spectrum of R*p·Arr during the decay process (Fig. 5C, purple). The “activation spectrum” resulting from light activation of Rp○Arr of the same sample is shown for comparison (Fig. 5C, red). The activation and deactivation spectra are essentially mirror images of one another, although the relative amplitudes of most peaks in the deactivation spectrum are only half those in the activation spectrum. This result indicates that half of the R*p·Arr complex that formed after light activation remained in a stabilized form, whereas the other half decayed to an inactive form of the receptor that resembles dark state rhodopsin. Because 11-cis-retinal was not present and regeneration was not possible, we conclude that this half of the receptor population decayed to inactive opsin.
From the time-dependent data sets, difference spectra were extracted immediately after illumination and when the stationary level was reached. In the double differences immediately after illumination (Fig. 5D, green) and after the decay period (Fig. 5D, orange) the typical Meta IIb/Meta IIbH+ bands (e.g. 1768, 1748, 1661, and 1644 cm−1) show the arrestin-induced shift of the meta equilibrium toward R*p. The fact that these bands also occurred in the late double difference (orange) confirms that, in the presence of arrestin, a significant portion of the receptor population remains in a Meta IIb/Meta IIbH+-like state at the end of the decay period. Because all arrestin-specific bands occur in regions where they overlap with bands caused by rhodopsin, only the subtraction of the difference spectra without arrestin at the beginning and the end of the measurement allowed estimation of the fraction of arrestin that remained in an activated form. By this means, we estimated that the typical change in β-sheet content was observed in 50% of total arrestin, suggesting that during decay half of arrestin reverts back to the conformation present before light activation.
In the absence of arrestin, a band at 1348 cm−1 occurred within 20 min after the end of the illumination. It manifests as a negative band in the double difference (Fig. 5D, orange). This band is a marker of the Meta III intermediate, a decay product of Meta II (47). In the presence of arrestin, no such band occurred, supporting the notion that Meta III formation is prevented in the presence of arrestin (48).
To investigate the receptor population stabilized in the active form, experiments with hydroxylamine, a strong nucleophile that can readily enter the ligand binding pocket of Meta II and hydrolyze the retinal Schiff base, were performed. In the presence of 100 mm hydroxylamine, the formation of a Meta II-like state from illuminated phosphorylated rhodopsin could not be resolved after the first few seconds of measurement. At this time scale, an opsin-like state was observed (Fig. 6A, blue), suggesting that Meta II decay in the presence of hydroxylamine was very fast compared with the temporal resolution of the experiment. The intense band at 1348 cm−1 indicates changes of the Schiff base at this time scale (47, 49). In the presence of both arrestin and hydroxylamine, transient Meta II was represented by two components. The first component was fast (t½ < 1.5 s; Fig. 6A, green) and showed a moderate formation of Meta II as indicated by the corresponding marker bands (see Fig. 6A, red, for a spectrum of high affinity R*p·Arr complex formation in the absence of hydroxylamine). The intensity of the bands in the presence of hydroxylamine was only ∼50% of the level achieved in the absence of hydroxylamine. This population of arrestin-stabilized Meta II decayed to opsin in a second component with a half-time of ∼20 s (Fig. 6B). These results suggest that, although arrestin cannot prevent hydroxylamine-induced decay of Meta II, arrestin binds half of the receptor population fast enough to inhibit immediate retinal Schiff base hydrolysis by hydroxylamine. Notably, this observation mirrors the fast binding phase observed in the absence of hydroxylamine (Fig. 3) and indicates that half of the receptors can form the high affinity complex with arrestin very quickly (<1 s) following illumination. Furthermore, these experiments show that arrestin stabilizes Meta II and not simply an active form of opsin (Ops*) (50) because the spectral signatures of the active receptor in the presence of arrestin were influenced by hydroxylamine.
FIGURE 6.
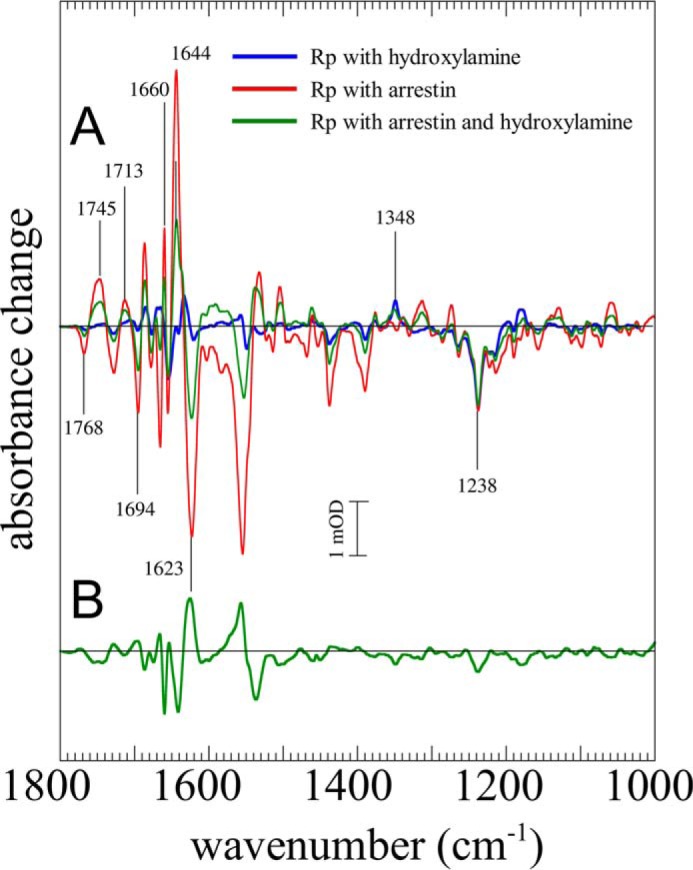
Stabilization of Meta II in presence of hydroxylamine. A, difference spectra of the fast component of illuminated phosphorylated rhodopsin in the presence of hydroxylamine (100 mm) either in the absence (blue) or presence (green) of arrestin (pH 8, 30 °C). For comparison, a spectrum of Meta II formation in the presence of arrestin measured without hydroxylamine is given (red). In the presence of arrestin and hydroxylamine, typical Meta II difference bands, i.e. at 1768, 1745, 1713, and 1644 cm−1, showed ∼50% of the intensity that occurred in the hydroxylamine-free case. B, difference spectrum of the slow component of illuminated phosphorylated rhodopsin in the presence of both arrestin and hydroxylamine. The Meta II difference bands are developed in the negative direction compared with the fast component.
DISCUSSION
In this study, we applied FTIR difference spectroscopy to observe the interactions of arrestin-1 and Rp in native disc membranes. Under the experimental conditions, most arrestin was in precomplex with Rp in the dark (34), and the changes in infrared absorbance after illumination reflect the transition from the precomplex to the high affinity complex (Schemes 2 and 3). Our understanding of how precomplex formation activates arrestin for binding R*p has greatly improved with the recent x-ray crystal structures of preactivated arrestins (16, 17). However, these structures do not indicate how the structure of arrestin transforms from the precomplex to the high affinity complex. The molecular details of this conversion have been spectroscopically probed before. Pulsed EPR experiments (double electron-electron resonance) have indicated that the overall shape of arrestin remains the same, and changes are localized to flexible loops in the central crest region (51). In contrast, NMR experiments suggest that arrestin undergoes a global unstructuring and transition to a molten globule (34). The FTIR data presented here do not support the molten globule hypothesis and reveal that ∼5% of β-sheet content, about 8 residues worth, is lost. This modest melting of β-sheet might lead to increased flexibility in specific parts of the protein to facilitate binding. Although we can state that the FTIR data reflect changes in β-sheet content due to the transition from the precomplex to the high affinity complex, the data do not indicate where those β-sheet changes occur. However, because rhodopsin contains only a very small amount of β-sheet, primarily forming a cytoplasmic “lid” for the retinal binding pocket (52), we assume that the loss of β-sheet occurs in arrestin or at the interface between rhodopsin and arrestin in the precomplex and/or in the high affinity complex.
Two recent crystal structures give some clues regarding where changes in β-sheet occur. As reported by Shukla et al. (17), a peptide analogue of the phosphorylated receptor C terminus forms two short stretches of antiparallel β-sheet with arrestin near the N terminus of arrestin and at the base of the finger loop. The intermolecular interaction essentially replaces the intramolecular interaction with the C-tail of arrestin in the basal state. If the intermolecular β-sheet were lost again upon high affinity interaction, this could explain the observed loss of β-sheet. However, the high β-sheet content of arrestin suggests that these changes more likely occur within arrestin itself. Notably, the structure reported by Szczepek et al. (42) in which a peptide analogue of the arrestin finger loop is bound within the cytoplasmic crevice of the active receptor indicates a partial melting of the β-sheet bordering the finger loop when this loop penetrates the binding crevice of the receptor. In any case, we can conclude that the changes in β-sheet structure facilitate the additional interactions associated with the transition from the relatively low affinity precomplex to the high affinity complex (18, 53, 54).
Our FTIR data report not only changes in arrestin but also in the receptor. The data show that arrestin binds to and stabilizes Meta IIb/Meta IIbH+ similarly to the G protein (see Scheme 1). Because nearly every receptor molecule in the sample was stabilized in the active conformation, we conclude that arrestin bound the light-activated receptor at a stoichiometry of nearly 1:1 (18, 22). This light-induced stoichiometry is consistent with that previously reported by us and others (18, 22, 54–56). Intriguingly, two kinetic components were observed for the formation of the R*p·Arr complex. Roughly half of the precomplexed population transitioned to the high affinity complex quickly (seconds or faster), whereas the other half of the population transitioned slowly (minutes). The double difference spectra of the fast and slow components are nearly identical, arguing that both components originated from the same Rp○Arr precomplex and resulted in the same high affinity R*p·Arr complex. Different explanations for the observed biphasicity can be made. First, space limitations on the rod disc membrane due to the naturally high concentration of rhodopsin could restrict arrestin binding. In this case, about half of the precomplexed arrestins would bind quickly to their associated receptors, thereby limiting space on the membrane surface for the remaining precomplexed arrestins to bind. Binding of the remaining arrestins would depend on slow rearrangements of both binding partners on the membrane surface. The second explanation is that receptors are dimerized, and that one-to-one arrestin binding requires a slow dissolution of the dimer. Finally, it is possible that there are two or more types of precomplex within the population that are spectroscopically indistinguishable and transition to the high affinity complex at different rates.
Following light activation, Meta II decays to opsin and all-trans-retinal. Previously, we reported that arrestin traps all-trans-retinal in a Schiff base-linked form in half the population of phosphorylated opsin following Meta II decay (11). The FTIR data presented here both confirm this previous finding and identify the receptor species that remain after decay. Arrestin stabilizes half the population in the active conformation, whereas the other half decays to inactive opsin with a rate similar to that in the absence of arrestin. FTIR bands monitoring changes in β-sheet indicate that during decay half of arrestin is released from the high affinity complex. Taken together, these data strongly suggest a shift in the functional arrestin-receptor stoichiometry from 1:1 for light-activated Meta II to 1:2 following decay. This shift in the functional stoichiometry has been previously observed by our group using different experimental methods (11). The lack of additional changes in the FTIR spectrum (such as intense phosphate bands below 1300 cm−1) during decay suggests that the arrestin released from the high affinity complex reverts back to a state similar to that in the precomplex. This would further suggest that arrestin is not released into solution during decay but remains bound to phosphorylated, inactive state opsin (50) similar to the precomplex with dark state rhodopsin. Hence, we propose a model whereby one arrestin couples to a receptor dimer composed of one opsin and one Meta II while an additional arrestin interacts with the phosphorylated receptor C terminus as in the precomplex.
The most curious and unexplained aspect of these observations is that every phosphorylated receptor can interact with arrestin as light-induced Meta II, but only half of these receptors are stabilized as Meta II by arrestin following decay. Intriguingly, the FTIR results indicate that the Meta II species stabilized after decay is essentially the same as that bound by arrestin after light activation. Furthermore, the overall conformation of arrestin bound to Meta II is the same after light activation and after decay. Despite the high level of molecular detail provided by FTIR spectroscopy, the molecular mechanism driving the shift in arrestin-receptor stoichiometry during the decay process remains unclear.
CONCLUSION
We have established a new approach to study the coupling of rhodopsin and arrestin in native disc membranes with respect to protein concentration, lipid environment, and water content. Our results go beyond x-ray structures of the isolated components and complement other recent spectroscopic studies on complex formation (34, 51). The salient results of the study are a net loss of arrestin β-sheet upon transition from the precomplex to the high affinity complex, stabilization of the helix-tilted active form of the receptor by arrestin, and arrestin-mediated stabilization of half of the receptor population as all-trans-retinal-bound active Meta II. The fact that only half of the receptor population is free to decay to the opsin apoprotein is consistent with our previously proposed model of asymmetric receptor dimers bound to arrestin (11). Future studies will investigate the functional roles of the different arrestin binding modes for rhodopsin (12) and GPCRs in general (57).
Acknowledgments
We thank Anja Koch and Brian Bauer for technical assistance.
This work was supported by Deutsche Forschungsgemeinschaft Collaborative Research Grant SFB 740 (to K. P. H. and M. H.) and Grant SO1037/1-2 (to M. E. S.), European Research Council Advanced Grant “Towards Understanding the Structure and Dynamics of Receptor Protein” (TUDOR) (to K. P. H.), and German Federal Ministry of Education and Research (Bundesministerium für Bildung und Forschung) Grant 05K13KH1 (to Peter Hegemann).
- GPCR
- G protein-coupled receptor
- Gt
- G protein transducin
- TM
- transmembrane helix
- Meta
- Metarhodopsin
- FTIR
- Fourier transform infrared
- R
- rhodopsin
- Rp
- phosphorylated rhodopsin
- R*p
- phosphorylated R*
- Arr
- arrestin
- SVD
- singular value decomposition
- ABS
- arrestin binding spectrum.
REFERENCES
- 1. Hofmann K. P., Scheerer P., Hildebrand P. W., Choe H. W., Park J. H., Heck M., Ernst O. P. (2009) A G protein-coupled receptor at work: the rhodopsin model. Trends Biochem. Sci. 34, 540–552 [DOI] [PubMed] [Google Scholar]
- 2. Ye S., Zaitseva E., Caltabiano G., Schertler G. F., Sakmar T. P., Deupi X., Vogel R. (2010) Tracking G-protein-coupled receptor activation using genetically encoded infrared probes. Nature 464, 1386–1389 [DOI] [PubMed] [Google Scholar]
- 3. Knierim B., Hofmann K. P., Ernst O. P., Hubbell W. L. (2007) Sequence of late molecular events in the activation of rhodopsin. Proc. Natl. Acad. Sci. U.S.A. 104, 20290–20295 [DOI] [PMC free article] [PubMed] [Google Scholar]
- 4. Mahalingam M., Martínez-Mayorga K., Brown M. F., Vogel R. (2008) Two protonation switches control rhodopsin activation in membranes. Proc. Natl. Acad. Sci. U.S.A. 105, 17795–17800 [DOI] [PMC free article] [PubMed] [Google Scholar]
- 5. Arnis S., Hofmann K. P. (1993) Two different forms of metarhodopsin II: Schiff base deprotonation precedes proton uptake and signaling state. Proc. Natl. Acad. Sci. U.S.A. 90, 7849–7853 [DOI] [PMC free article] [PubMed] [Google Scholar]
- 6. Ahuja S., Hornak V., Yan E. C., Syrett N., Goncalves J. A., Hirshfeld A., Ziliox M., Sakmar T. P., Sheves M., Reeves P. J., Smith S. O., Eilers M. (2009) Helix movement is coupled to displacement of the second extracellular loop in rhodopsin activation. Nat. Struct. Mol. Biol. 16, 168–175 [DOI] [PMC free article] [PubMed] [Google Scholar]
- 7. Ballesteros J. A., Weinstein H. (1995) Integrated methods for the construction of three-dimensional models and computational probing of structure-function relations in G protein-coupled receptors. Methods Neurosci. 25, 366–428 [Google Scholar]
- 8. Deupi X., Kobilka B. K. (2010) Energy landscapes as a tool to integrate GPCR structure, dynamics, and function. Physiology 25, 293–303 [DOI] [PMC free article] [PubMed] [Google Scholar]
- 9. Elgeti M., Rose A. S., Bartl F. J., Hildebrand P. W., Hofmann K.-P., Heck M. (2013) Precision vs flexibility in GPCR signaling. J. Am. Chem. Soc. 135, 12305–12312 [DOI] [PubMed] [Google Scholar]
- 10. Lefkowitz R. J. (2013) Arrestins come of age: a personal historical perspective. Prog. Mol. Biol. Transl. Sci. 118, 3–18 [DOI] [PubMed] [Google Scholar]
- 11. Sommer M. E., Hofmann K. P., Heck M. (2012) Distinct loops in arrestin differentially regulate ligand binding within the GPCR opsin. Nat. Commun. 3, 995. [DOI] [PMC free article] [PubMed] [Google Scholar]
- 12. Sommer M. E., Hofmann K. P., Heck M. (2014) Not just signal shutoff: the protective role of arrestin-1 in rod cells. Handb. Exp. Pharmacol. 219, 101–116 [DOI] [PubMed] [Google Scholar]
- 13. Granzin J., Wilden U., Choe H. W., Labahn J., Krafft B., Büldt G. (1998) X-ray crystal structure of arrestin from bovine rod outer segments. Nature 391, 918–921 [DOI] [PubMed] [Google Scholar]
- 14. Hirsch J. A., Schubert C., Gurevich V. V., Sigler P. B. (1999) The 2.8 Å crystal structure of visual arrestin: a model for arrestin's regulation. Cell 97, 257–269 [DOI] [PubMed] [Google Scholar]
- 15. Gurevich V. V., Hanson S. M., Song X., Vishnivetskiy S. A., Gurevich E. V. (2011) The functional cycle of visual arrestins in photoreceptor cells. Prog. Retin. Eye Res. 30, 405–430 [DOI] [PMC free article] [PubMed] [Google Scholar]
- 16. Kim Y. J., Hofmann K. P., Ernst O. P., Scheerer P., Choe H.-W., Sommer M. E. (2013) Crystal structure of pre-activated arrestin p44. Nature 497, 142–146 [DOI] [PubMed] [Google Scholar]
- 17. Shukla A. K., Manglik A., Kruse A. C., Xiao K., Reis R. I., Tseng W.-C., Staus D. P., Hilger D., Uysal S., Huang L.-Y., Paduch M., Tripathi-Shukla P., Koide A., Koide S., Weis W. I., Kossiakoff A. A., Kobilka B. K., Lefkowitz R. J. (2013) Structure of active β-arrestin-1 bound to a G-protein-coupled receptor phosphopeptide. Nature 497, 137–141 [DOI] [PMC free article] [PubMed] [Google Scholar]
- 18. Schleicher A., Kühn H., Hofmann K. P. (1989) Kinetics, binding constant, and activation energy of the 48-kDa protein-rhodopsin complex by extra-metarhodopsin II. Biochemistry 28, 1770–1775 [DOI] [PubMed] [Google Scholar]
- 19. Siebert F., Mäntele W., Gerwert K. (1983) Fourier-transform infrared spectroscopy applied to rhodopsin. The problem of the protonation state of the retinylidene Schiff base re-investigated. Eur. J. Biochem. 136, 119–127 [DOI] [PubMed] [Google Scholar]
- 20. Siebert F. (1995) Application of FTIR spectroscopy to the investigation of dark structures and photoreactions of visual pigments. Isr. J. Chem. 35, 309–323 [Google Scholar]
- 21. Elgeti M., Kazmin R., Heck M., Morizumi T., Ritter E., Scheerer P., Ernst O. P., Siebert F., Hofmann K. P., Bartl F. J. (2011) Conserved Tyr223(5.58) plays different roles in the activation and G-protein interaction of rhodopsin. J. Am. Chem. Soc. 133, 7159–7165 [DOI] [PubMed] [Google Scholar]
- 22. Sommer M. E., Hofmann K. P., Heck M. (2011) Arrestin-rhodopsin binding stoichiometry in isolated rod outer segment membranes depends on the percentage of activated receptors. J. Biol. Chem. 286, 7359–7369 [DOI] [PMC free article] [PubMed] [Google Scholar]
- 23. Garwin G. G., Saari J. C. (2000) High-performance liquid chromatography analysis of visual cycle retinoids. Methods Enzymol. 316, 313–324 [DOI] [PubMed] [Google Scholar]
- 24. Piechnick R., Heck M., Sommer M. E. (2011) Alkylated hydroxylamine derivatives eliminate peripheral retinylidene Schiff bases but cannot enter the retinal binding pocket of light-activated rhodopsin. Biochemistry 50, 7168–7176 [DOI] [PubMed] [Google Scholar]
- 25. Sommer M. E., Smith W. C., Farrens D. L. (2006) Dynamics of arrestin-rhodopsin interactions: acidic phospholipids enable binding of arrestin to purified rhodopsin in detergent. J. Biol. Chem. 281, 9407–9417 [DOI] [PubMed] [Google Scholar]
- 26. Bartl F., Ritter E., Hofmann K. P. (2000) FTIR spectroscopy of complexes formed between metarhodopsin II and C-terminal peptides from the G-protein α- and γ-subunits. FEBS Lett. 473, 259–264 [DOI] [PubMed] [Google Scholar]
- 27. Ritter E., Elgeti M., Hofmann K. P., Bartl F. J. (2007) Deactivation and proton transfer in light-induced metarhodopsin II/metarhodopsin III conversion: a time-resolved Fourier transform infrared spectroscopic study. J. Biol. Chem. 282, 10720–10730 [DOI] [PubMed] [Google Scholar]
- 28. Henry E. R., Hofrichter J. (1992) Singular value decomposition: application to analysis of experimental data. Methods Enzymol. 210, 129–192 [Google Scholar]
- 29. Elgeti M., Ritter E., Bartl F. J. (2008) New insights into light-induced deactivation of active rhodopsin by SVD and global analysis of time-resolved UV/Vis- and FTIR-data. Z. Phys. Chem. 222, 1117–1129 [Google Scholar]
- 30. Goormaghtigh E. (1990) Secondary structure and dosage of soluble and membrane proteins by attenuated total reflection Fourier-transform infrared spectroscopy on hydrated films. Eur. J. Biochem. 193, 409–420 [DOI] [PubMed] [Google Scholar]
- 31. Vishnivetskiy S. A., Raman D., Wei J., Kennedy M. J., Hurley J. B., Gurevich V. V. (2007) Regulation of arrestin binding by rhodopsin phosphorylation level. J. Biol. Chem. 282, 32075–32083 [DOI] [PMC free article] [PubMed] [Google Scholar]
- 32. Mendez A., Burns M. E., Roca A., Lem J., Wu L. W., Simon M. I., Baylor D. A., Chen J. (2000) Rapid and reproducible deactivation of rhodopsin requires multiple phosphorylation sites. Neuron 28, 153–164 [DOI] [PubMed] [Google Scholar]
- 33. Gibson S. K., Parkes J. H., Liebman P. A. (1998) Phosphorylation stabilizes the active conformation of rhodopsin. Biochemistry 37, 11393–11398 [DOI] [PubMed] [Google Scholar]
- 34. Zhuang T., Chen Q., Cho M.-K., Vishnivetskiy S. A., Iverson T. M., Gurevich V. V., Sanders C. R. (2013) Involvement of distinct arrestin-1 elements in binding to different functional forms of rhodopsin. Proc. Natl. Acad. Sci. U.S.A. 110, 942–947 [DOI] [PMC free article] [PubMed] [Google Scholar]
- 35. Fahmy K., Jäger F., Beck M., Zvyaga T. A., Sakmar T. P., Siebert F. (1993) Protonation states of membrane-embedded carboxylic acid groups in rhodopsin and metarhodopsin II: a Fourier-transform infrared spectroscopy study of site-directed mutants. Proc. Natl. Acad. Sci. 90, 10206–10210 [DOI] [PMC free article] [PubMed] [Google Scholar]
- 36. Bandekar J., Krimm S. (1979) Vibrational analysis of peptides, polypeptides, and proteins: characteristic amide bands of β-turns. Proc. Natl. Acad. Sci. 76, 774–777 [DOI] [PMC free article] [PubMed] [Google Scholar]
- 37. Krimm S. (1962) Infrared spectra and chain conformation of proteins. J. Mol. Biol. 4, 528–540 [DOI] [PubMed] [Google Scholar]
- 38. Arrondo J. L., Muga A., Castresana J., Goñi F. (1993) Quantitative studies of the structure of proteins in solution by Fourier-transform infrared spectroscopy. Prog. Biophys. Mol. Biol. 59, 23–56 [DOI] [PubMed] [Google Scholar]
- 39. Vedantham G., Sparks H. G., Sane S. U., Tzannis S., Przybycien T. M. (2000) A holistic approach for protein secondary structure estimation from infrared spectra in H2O solutions. Anal. Biochem. 285, 33–49 [DOI] [PubMed] [Google Scholar]
- 40. Cooper E. A., Knutson K. (1995) Fourier transform infrared spectroscopy investigations of protein structure. Pharm. Biotechnol. 7, 101–143 [DOI] [PubMed] [Google Scholar]
- 41. Vogel R., Martell S., Mahalingam M., Engelhard M., Siebert F. (2007) Interaction of a G protein-coupled receptor with a G protein-derived peptide induces structural changes in both peptide and receptor: a Fourier-transform infrared study using isotopically labeled peptides. J. Mol. Biol. 366, 1580–1588 [DOI] [PubMed] [Google Scholar]
- 42. Szczepek M., Beyrière F., Hofmann K. P., Elgeti M., Kazmin R., Rose A., Bartl F. J., von Stetten D., Heck M., Sommer M. E., Hildebrand P. W., Scheerer P. (2014) Crystal structure of a common GPCR-binding interface for G protein and arrestin. Nat. Commun. 5, 4801. [DOI] [PMC free article] [PubMed] [Google Scholar]
- 43. Klähn M., Mathias G., Kötting C., Nonella M., Schlitter J., Gerwert K., Tavan P. (2004) IR spectra of phosphate ions in aqueous solution: predictions of a DFT/MM approach compared with observations. J. Phys. Chem. A 108, 6186–6194 [Google Scholar]
- 44. Allin C., Ahmadian M. R., Wittinghofer A., Gerwert K. (2001) Monitoring the GAP catalyzed H-Ras GTPase reaction at atomic resolution in real time. Proc. Natl. Acad. Sci. U.S.A. 98, 7754–7759 [DOI] [PMC free article] [PubMed] [Google Scholar]
- 45. Smith W. C., Milam A. H., Dugger D., Arendt A., Hargrave P. A., Palczewski K. (1994) A splice variant of arrestin. Molecular cloning and localization in bovine retina. J. Biol. Chem. 269, 15407–15410 [PubMed] [Google Scholar]
- 46. Schröder K., Pulvermüller A., Hofmann K. P. (2002) Arrestin and its splice variant Arr1–370A (p44). Mechanism and biological role of their interaction with rhodopsin. J. Biol. Chem. 277, 43987–43996 [DOI] [PubMed] [Google Scholar]
- 47. Bartl F. J., Ritter E., Hofmann K. P. (2001) Signaling states of rhodopsin: absorption of light in active metarhodopsin II generates an all-trans-retinal bound inactive state. J. Biol. Chem. 276, 30161–30166 [DOI] [PubMed] [Google Scholar]
- 48. Sommer M. E., Farrens D. L. (2006) Arrestin can act as a regulator of rhodopsin photochemistry. Vis. Res. 46, 4532–4546 [DOI] [PMC free article] [PubMed] [Google Scholar]
- 49. Vogel R., Siebert F., Mathias G., Tavan P., Fan G., Sheves M. (2003) Deactivation of rhodopsin in the transition from the signaling state meta II to meta III involves a thermal isomerization of the retinal chromophore C=D. Biochemistry 42, 9863–9874 [DOI] [PubMed] [Google Scholar]
- 50. Vogel R., Siebert F. (2001) Conformations of the active and inactive states of opsin. J. Biol. Chem. 276, 38487–38493 [DOI] [PubMed] [Google Scholar]
- 51. Kim M., Vishnivetskiy S. A., Van Eps N., Alexander N. S., Cleghorn W. M., Zhan X., Hanson S. M., Morizumi T., Ernst O. P., Meiler J., Gurevich V. V., Hubbell W. L. (2012) Conformation of receptor-bound visual arrestin. Proc. Natl. Acad. Sci. U.S.A. 109, 18407–18412 [DOI] [PMC free article] [PubMed] [Google Scholar]
- 52. Palczewski K., Kumasaka T., Hori T., Behnke C. A., Motoshima H., Fox B. A., Le Trong I., Teller D. C., Okada T., Stenkamp R. E., Yamamoto M., Miyano M. (2000) Crystal structure of rhodopsin: a G protein-coupled receptor. Science 289, 739–745 [DOI] [PubMed] [Google Scholar]
- 53. Zhang L., Sports C. D., Osawa S., Weiss E. R. (1997) Rhodopsin phosphorylation sites and their role in arrestin binding. J. Biol. Chem. 272, 14762–14768 [DOI] [PubMed] [Google Scholar]
- 54. Bayburt T. H., Vishnivetskiy S. A., McLean M. A., Morizumi T., Huang C.-C., Tesmer J. J., Ernst O. P., Sligar S. G., Gurevich V. V. (2011) Monomeric rhodopsin is sufficient for normal rhodopsin kinase (GRK1) phosphorylation and arrestin-1 binding. J. Biol. Chem. 286, 1420–1428 [DOI] [PMC free article] [PubMed] [Google Scholar]
- 55. Hanson S. M., Gurevich E. V., Vishnivetskiy S. A., Ahmed M. R., Song X., Gurevich V. V. (2007) Each rhodopsin molecule binds its own arrestin. Proc. Natl. Acad. Sci. U.S.A. 104, 3125–3128 [DOI] [PMC free article] [PubMed] [Google Scholar]
- 56. Tsukamoto H., Sinha A., DeWitt M., Farrens D. L. (2010) Monomeric rhodopsin is the minimal functional unit required for arrestin binding. J. Mol. Biol. 399, 501–511 [DOI] [PMC free article] [PubMed] [Google Scholar]
- 57. Maurice P., Guillaume J.-L., Benleulmi-Chaachoua A., Daulat A. M., Kamal M., Jockers R. (2011) GPCR-interacting proteins, major players of GPCR function. Adv. Pharmacol. 62, 349–380 [DOI] [PubMed] [Google Scholar]