

Abstract
We obtained insight into normal lung function by proteome analysis of bronchoalveolar lavage fluid (BALF) from six normal human subjects using a “Lyse-N-Go’ shotgun proteomic protocol. Intra-sample variation was calculated using three different label-free methods, (i) protein sequence coverage; (ii) peptide spectral counts and (iii) peptide single-ion current areas (PICA), which generates protein expression data by summation of the area under the curve for a given peptide single-ion current trace and then adding values for all peptides from that same parent protein. PICA gave the least intra-subject variability and was used to calculate differences in protein expression between the six subjects. We observed an average threefold inter-sample variability, which affects analysis of changes in protein expression that occur in different diseases. We detected 167 unique proteins with >100 proteins detected in each of the six individual BAL samples, 42 of which were common to all six subjects. Gene ontology analysis demonstrated enrichment of several biological processes in the lung, reflecting its expected role in gas exchange and host defense as an immune organ. The same biological processes were enriched compared to either plasma or total genome proteome, suggesting an active enrichment of plasma proteins in the lung rather than passive capillary leak.
Keywords: Bronchoalveolar lavage, Lung, Normal
1 Introduction
A better understanding of the normal human bronchoalveolar lavage fluid (BALF) proteome and normal biological variability in proteomes between subjects is essential for understanding the changes that occur with disease and injury [1–7]. Proteome analysis of BALF has been used to identify new biomarkers and to obtain insight into the pathogenesis of a range of lung diseases including idiopathic pulmonary fibrosis [5], cystic fibrosis [8], sarcoidosis [9], chronic obstructive pulmonary disease (COPD) [10, 11] and adult respiratory distress syndrome (ARDS) [12–14]. Many lung diseases are characterized by changes in the barrier properties of the lung, up-regulation of normally expressed proteins, or changes in the balance of pro and anti-inflammatory proteins [15]. Thus, in order to understand the pathogenesis of lung diseases it is important to evaluate not only the spectrum of proteins expressed in lung diseases, but also the spectrum of proteins in normal BALF and their variation between subjects.
Protein identification and measurement of relative changes in protein expression using MS has been facilitated by a number of recent advances. For example, using methods that circumvent the need for stable isotope labeling, one may obtain semi-quantitative data on differences in protein expression between samples. Relevant to the analysis of large numbers of clinical samples, these label-free methods generate data on each sample independently, allowing subsequent calculation ofany pair-wise comparisons. In contrast, stable isotope-labeling methods (e.g. ICAT, iTRAQ, SILAC) [16–18] require that data be acquired by predetermined pair-wise (or higher) comparisons. Additional comparisons require dividing one ratio by another, thereby creating new sources of error. Advances in proteomic technology include development of mass spectrometers capable ofmore accurate precursor ion measurement and better detection sensitivity. The enlargement of protein sequence databases has also helped to make pertinent identifications much easier [19].
We took advantage of these improvements in MS and label-free data analysis to directly analyze BALF from six normal human subjects without prior fractionation and established a BALF protein similarity profile that includes a limited assessment of the variability between six normal human subjects. We tested three different semi-quantitative proteomic methods to determine which of them generated the least intra-sample variability. They included (i) protein sequence coverage [20], (ii) peptide spectral counting [21], and (iii) peptide single-ion current areas (PICA) calculated using novel in-house software described herein and referred to as PICA™.
Finally, to gain insight into the function of the lung microenvironment, we determined what biological functions and proteins were specifically enriched in BALF compared to the total genome proteome and to the plasma proteome.
2 Materials and methods
2.1 BALF collection
The protocol for collecting BALF was approved by the Institutional Review Board at the University of Washington. Written informed consent was obtained from each healthy, non-smoking subject prior to enrollment in the study. Samples from six subjects were analyzed. BAL was performed as previously described [22–24]. Briefly, five separate 30-mL aliquots of 0.89% sterile saline were instilled into the right middle lobe or lingula. BALF was centrifuged immediately after collection and cell-free supernatants were aliquoted into polypropylene tubes and stored at −70°C prior to Lyse-N-Go preparation. Total protein measurements were made on aliquots of supernatants using the Bradford assay.
2.2 Lyse-N-Go preparation
The Lyse-N-Go shotgun proteomic sample preparation consisted of the following as previously published [25]. Equal volumes of each cell-free BALF supernatant sample were denatured with 8 M Urea in 50 mM NH4HCO3 and then reduced by addition of 5 mM Tris(2-carboxyethyl)phosphine hydrochloride at 37°C for 30 min and alkylated by 10 mM iodoacetamide in the dark for 1 h. Alkylation was stopped by addition of 10 mM DTT for 5 min. The solution was diluted to 2 M urea with 20% methanol/50 mM NH4HCO3, pH 8.5 and then underwent proteolysis for 16 h using a 1:20 w/w trypsin-to-protein ratio. The tryptic digest was desalted with micro-spin cartridge (Nest Group, MA) and completely dried using a Speed-Vac (Thermo-Savant, Milford, MA). At this point, the sample was used directly for LC-MS/MS analysis.
2.3 LC-MS/MS analysis
Each sample was analyzed in quadruplicate by LC-MS using a Michrom Paradigm MS4B HPLC system (Michrome Bior esources, CA) that was coupled as previously described [26] via ESI on-line to a linear IT (LTQ) FT-ICR mass spectrometer (i.e. LTQ-FT ThermoFinnigan, CA). A T-splitter system was employed to achieve a constant flow rate of 200 nL/min. Reversed-phase separations were performed using 75 μm id × 360 μm od × 12 cm long fused silica capillary columns with a ESI frit (Polymicro Technologies, Phoenix, AZ), which were slurry-packed in-house with 5 μm, 200-Å pore size Magic C-18 AQ beads (Michrome Bioresources)in a pressure cell (Brechbuhler, Spring, TX). After injecting 0.1 μg of total sample onto the column, a 15-min wash with 85% buffer A (100% water) and 10% buffer C (1% v/v formic acid in water) was applied and peptides were eluted using a linear gradient of 5% solvent B (100% ACN) to 45% solvent B in 60 min, then to 80% in 5 min where the ACN concentration remained for 10 min prior to column re-equilibration at 5%. Buffer C remained constant at 10% during gradient operation. The LTQ-FT mass spectrometer was operated in a data-dependent mode such that precursor ion survey scans of 400–1800 u were acquired in the FT-ICR with resolution R = 100 000 at m/z 524 (after accumulation to a target value of 1 000 000 in the ICR cell) and peptide MS/MS spectra in the LTQ IT. The five most intense ions were sequentially isolated in the linear IT and subjected to CID in series using a trap target value of 5000 and 60 s of dynamic exclusion. The total MS-MS/MS scan cycle time was ∼1.5 s. The general MS conditions were ESI voltage, 1.3 kV; ion transfer tube temperature, 2007C; and normalized collision energy, 30%. Ion-selection threshold was 3000 counts for MS/MS.
2.4 Protein identification
For database searches, MS/MS spectral RAW (Thermo-Finnigan) files were first converted to mzXML format using ReAdW software program [27]. The individual spectra for each RAW file were extracted from the mzXML file into corresponding DTA files (required as input to SEQUEST), using program mzXML2Other (http://tools.proteomecenter.org/mzxml2other.php). The MS/MS spectra were then matched to protein sequence in the IPI Human 2.31 database (http://www.ebi.ac.uk/IPI/IPIhuman.html) using SEQUEST. Criteria for matching a peptide MS/MS spectrum to a peptide sequence were Xcorr>1.9 with charge state 1+, Xcorr>2.2 with charge state 2+, or Xcorr>3.75 with charge state 3+, as well as ΔCn>/0.1. Peptide MS/MS spectra passing these criteria were utilized for protein identifications. A protein was considered to be identified only if ProteinProphet probability >0.8 [28] and if more than one unique tryptic peptide was found for each protein.
2.5 Gene ontology analysis
We used a web-based implementation of Database for Annotation, Visualization and Integrated Discovery (DAVID) [29] to functionally annotate identified proteins in BALF based on the Gene Ontology (GO) database (http://www.geneontology.org) [30]. Enriched functional categories within BALF proteins relative to the entire human proteome were determined using a variant of the one-tailed Fisher exact probability to determine whether a given GO process is over-represented compared to what would be expected by random chance. Since many GO categories were evaluated simultaneously, the problem of multiple comparisons was addressed using false discovery-rate analysis (FDR) as implemented in DAVID (FDR cutoff <0.05). We then repeated the above analysis to assess enrichment of BALF proteins relative to ∼3000 human plasma proteins [31].
2.6 Calculation of relative protein abundance
Protein abundance was assessed at the peptide level for sets of quadruplicate data for each of the three semi-quantitative methods: (i) protein-sequence coverage, (ii) peptide spectral count and (iii) PICA. Each method is described below as well as the method for calculation of intra-sample variability.
2.6.1 Protein-sequence coverage calculations
Protein-sequence coverage was calculated from quadruplicate LC-MS/MS data using Xinteract software (http://tools.proteomecenter.org/TPP.php). Unique peptide sequences were counted only once to determine each protein's sequence coverage. Intra-sample reproducibility was determined by the percentage of peptide sequences present in all of the quadruplicate LC-MS/MS datasets.
2.6.2 Peptide spectral count calculations
Peptide spectral counts were determined by the number of times a peptide that matched a given protein was selected for CID, including all repeated selections of the same peptide. Thus, a protein's spectral count value was the sum of all peptide CID acquired for that protein. A protein's expression level was indicated by the sum of peptide spectral counts in quadruplicate runs [20, 21]. Intra-sample reproducibility for each subject was measured by matching percentage of peptide spectral count data sets in the quadruplicate runs.
2.6.3 PICA calculations
Calculation of PICA values consisted of two parts: (i) verification of replicate LC-MS reproducibility using a previously published method [32] followed by (ii) extraction of actual peptide ion abundance values using a new method described below. Briefly, reproducibility was checked after converting identified peptides from each LC-MS/MS dataset into a 3-D matrix of scan number, peptide mass and ion intensity value using a signal filtering algorithm and peptide single-ion current trace detection algorithm [32]. This software extracted 2ˆ(n-1)*1000 ion traces at a specific presentation level n, according to their ion intensities. For example, at level 1 (the highest level), the top 1000 peptide single-ion current traces (defined by a single header and m/z) were extracted based on their ion intensities; at level 2, 2000 were extracted; at level 3, 4000 were extracted, and so on. Next, using an ion-current detection algorithm, single-ion current traces from the same peptide were grouped and a unique ID was assigned to each peptide single-ion current trace that correlated to a distinct peptide. Intra-sample re-producibility was measured by percentage of aligned peptide single-ion current trace patterns in the quadruplicate LC-MS analyses.
PICA values were calculated from single-ion current traces for all peptides from a given protein using in-house developed software we refer to as PICA™. Briefly, chroma-tographic peak area and theoretical m/z of three isotope peaks for all possible charge states (up to four) were calculated and corresponding retention time points collected. After global normalization of the entire LC-MS dataset, peptide ion traces were smoothed by Savitzky-Golay algorithm across time and extracted from all 24 experiments only if peptide ion traces persisted in accurate m/z (± 0.01) over their respective retention time windows (initially ± 3 min). Then, the peak area of a given peptide single ion current trace was used to quantify the amount of that peptide relative to the normalized total. Representative single-ion chromatograms of two peptides with different intensities are illustrated in Fig. 1. We previously compared the ability of label-free PICA™ software to detect the same differentially expressed proteins as the isotope-coded affinity tag (ICAT) method [33] using a standard mixture of proteins of known concentrations and found that both methods performed similarly with a mean squared error of 0.09 (Soyoung Ryu, B. G., YoungAh Goo, S. R., Shaffer, S., Radulovic, D., Goodlett, D. R., Comparison of a label-free quantitative proteomic method based on peptide ion current area to the isotope coded affinity tag method. Cancer Informatics 2007, submitted). In a separate study, we validated differentially expressed proteins identified by the PICA method using Western blot analysis [34].
Figure 1.
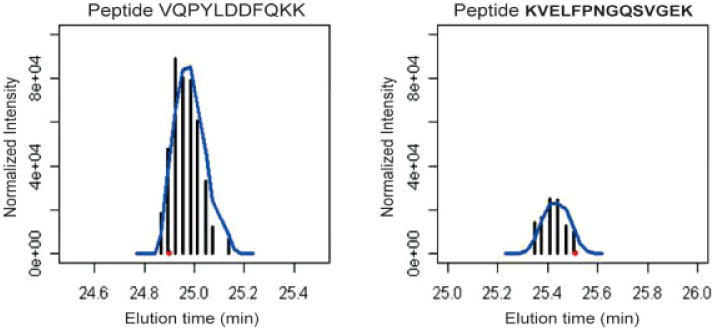
Single ion chromatograms of peptide VQPYLDDFQKK (charge states 2) (left) and peptide KVELFPNGQSVGEK (charge state 2) (right). The black vertical lines represent the normalized intensity. Blue line indicates the peak smoothed by Savitzky-Golay filtering. The red dot is the elution time when the peptide was subjected to MS2 scan.
2.7 Statistical analysis
Student's t-test [35] was used for comparison of parametric data. Spearman correlation coefficient is used to measure correlation in nonparametric statistics when the data are in ordinal form. Spearman rank order correlation coefficient was calculated to compare plasma and BALF concentrations (VasserStats http://faculty.vassar.edu/lowry/VassarStats.html). All tests were two-tailed and p values <0.05 were considered significant.
3 Results
3.1 Proteome content of normal human BALF
The BALF from six healthy, non-smoking human subjects was analyzed in quadruplicate by a Lyse-N-Go shotgun proteomic workflow using an LTQFT mass spectrometer. From 24 LC-MS/MS experiments conducted on six unique BALF samples, 167 unique proteins (Supporting Information Table 1) were identified. Approximately 100 proteinswereidentified in BALF of each subject. Of the 167 total proteins, 42 were identified in all six subjects (Table 1) and an additional 30 were identified in at least five different subjects. A number of plasma proteins, such as albumin, immunoglobulins and transferrin were identified in all six subjects, similar toreports of prior proteomic analysis innormal BALF [7, 14, 36]. Several pulmonary-specific proteins such as surfactant protein B, surfactant protein D, mucin, and PLUNC (Long palate, lung and nasal epithelium carcinoma-associated protein 1) [37] were also identified in all subjects and surfactant protein A was identified in four of six subjects.
Table 1. Semi-quantitative analysis of 42 common proteins in six normal BALFa.
| Protein IPI | Common name | Rank order | PICA | PepSC | ProSC (%) | Biological process |
|---|---|---|---|---|---|---|
| IPI00022434 | Serum albumin | 1 | 2.3E9±5.9E8 | 380.7±96.5 | 90.1±1.5 | Transport |
| IPI00022463 | Serotransferrin | 2 | 5.4E8±9.5E7 | 208.7±29.4 | 60.3±7 | Transport |
| IPI00006705 | Clara cell protein | 3 | 3.1E8±1.6E8 | 28.2±16.5 | 61.9±12.7 | Signaling |
| IPI00305457 | Serpin peptidase inhibitor, clade A | 4 | 1.6E8±1.1E8 | 66.5±8.7 | 46.5±4.1 | Unknown |
| IPI00164623 | Complement C3 | 5 | 1.2E8±1.9E7 | 91.7±19.2 | 27.6±4.3 | Inflammation |
| IPI00216722 | Alpha-1-B glycoprotein | 6 | 8.3E7±1.3E7 | 8.7±2.8 | 14 ±3.5 | Unknown |
| IPI00023673 | Lectin, galactoside-binding, soluble, 3 binding protein | 7 | 7.1E7±1.2E7 | 8.7±4 | 11 ±3.2 | Signaling |
| IPI00019038 | Lysozyme C | 8 | 6.6E7±3.2E7 | 18.7±4.2 | 37.4±8.8 | Cellular carbohydrate metabolism |
| IPI00296083 | Pulmonary surfactant-associated protein B | 9 | 5.6E7±3.2E7 | 23.5±12.9 | 21 ±7.5 | Lipid metabolism |
| IPI00004618 | Ig gamma-4 chain C region | 10 | 5.3E7±2.5E7 | 24.8±5.6 | 41.7±3.4 | Immune |
| IPI00218816 | Hemoglobin beta chain | 11 | 4.8E7±2.4E7 | 49 ±82.2 | 65.8±20.4 | Transport |
| IPI00022488 | Hemopexin | 12 | 4.1E7±1.1E7 | 29 ±6.2 | 33.8±4.1 | Transport |
| IPI00291878 | Pulmonary surfactant-associated protein D | 13 | 3.9E7±5.2E6 | 17 ±4.6 | 22.5±4.8 | Immune |
| IPI00022432 | Transthyretin | 14 | 3.9E7±1.1E7 | 18.2±5.5 | 57.1±9.6 | Transport |
| IPI00017601 | Ceruloplasmin | 15 | 3.7E7±3.2E7 | 17.7±7.5 | 13.9±5.9 | Transport |
| IPI00021439 | Actin, cytoplasmic 1b | 16 | 3.4E7±2.3E7 | 15.3±6.9 | 48.5±9.3 | Unknown |
| IPI00375506 | Complement component 4A | 17 | 3.2E7±8.6E6 | 19.8±5.3 | 9.8±4.4 | Unknown |
| IPI00022431 | Alpha-2-HS-glycoprotein | 18 | 3.2E7±7.7E6 | 10.3±4.6 | 23.4±11.1 | Immune |
| IPI00021841 | Apolipoprotein A-I | 19 | 3.1E7±9.5E6 | 9.3±7.8 | 16.6±8.7 | Transport |
| IPI00298853 | Vitamin D-binding protein | 20 | 2.5E7±1.2E7 | 34 ±8.6 | 27.1±6.1 | Transport |
| IPI00178926 | Immunoglobulin J chainb | 21 | 1.8E7±4.2E6 | 13.2±2.6 | 19.3±4.5 | Immune |
| IPI00007047 | Calgranulin A | 22 | 1.5E7±8.2E6 | 5 ±2.8 | 20.4±10.3 | Inflammation |
| IPI00291262 | Clusterin | 23 | 1.1E7±2.0E6 | 7.5±3.1 | 11.7±2.4 | Immune; lipid metabolism |
| IPI00022429 | Alpha-1-acid glycoprotein 1 precursor | 24 | 1.1E7±3.2E6 | 12 ±3.7 | 15.3±5.9 | Inflammation |
| IPI00166729 | Zinc-alpha-2-glycoprotein | 25 | 9.8E6±3.7E6 | 6.5±2.3 | 17.2±2.2 | Immune |
| IPI00012165 | Mucin 5B precursorb | 26 | 9.1E6±1.9E6 | 7.2±4.8 | 2.4±1.2 | Cell adhesion |
| IPI00291410 | Long palate, lung and nasal epithelium carcinoma associated protein 1b | 27 | 8.6E6±5.2E6 | 9.5±4.2 | 19.5±7.9 | Unknown |
| IPI00066193 | Uteroglobin-related protein 2b | 28 | 8.5E6±5.5E6 | 6.7±3.3 | 35.6±16.9 | Proliferation |
| IPI00004656 | Beta-2-microglobulin | 29 | 7.7E6±3.1E6 | 8.5±2.8 | 29.6±0.4 | Immune |
| IPI00377087 | Gelsolin | 30 | 6.7E6±4.7E6 | 4.8±2.7 | 6.2±1 | Cellular protein metabolism |
| IPI00016710 | Calcyphosineb | 31 | 5.2E6±4.8E6 | 7.5±6.6 | 17.8±9.7 | Signaling |
| IPI00032220 | Angiotensinogen precursor | 32 | 5.1E6±1.8E6 | 4.2±3.5 | 7.1±3.2 | Signaling |
| IPI00291866 | Plasma protease C1 inhibitor | 33 | 4.4E6±9.4E5 | 7.7±3.6 | 11.4±3.2 | Coagulation |
| IPI00020091 | Alpha-1-acid glycoprotein 2 | 34 | 4.2E6±1.4E6 | 9.2±5.6 | 16.±10.3 | Immune |
| IPI00014260 | Deleted in malignant brain tumors 1b | 35 | 3.5E6±6.1E5 | 6 ±3 | 11.3±2.2 | Immune; proliferation |
| IPI00298860 | Lactotransferrin | 36 | 2.8E6±2.4E6 | 6.2±4.8 | 9.4±5.5 | Transport; immune |
| IPI00216691 | Profilin-1b | 37 | 2.7E6±1.6E6 | 2.7±2 | 13.8±7.4 | Cellular organization and biogenesis |
| IPI00163563 | Phosphatidylethanolamine-binding protein 1b | 38 | 2.5E6±1.5E6 | 4.2±2.5 | 10.8±2.2 | Unknown |
| IPI00029717 | Fibrinogen alpha chain | 39 | 2.1E6±1.7E6 | 2.8±3.6 | 7 ±2.2 | Unknown |
| IPI00299547 | Neutrophil gelatinase-associated lipocalin | 40 | 1.4E6±2.0E5 | 3.5±0.8 | 8.6±2.4 | Transport |
| IPI00008494 | Intercellular adhesion molecule-1 | 41 | 1.3E6±5.3E5 | 9.5±6.3 | 9.8±3.7 | Unknown |
| IPI00333982 | Ig gamma-3 chain C region (Heavy chain disease protein) (HDC)b | 42 | 3.9E5±2.3E5 | 6.7±2 | 32 ±3.4 | Immune |
Each protein's average expression from three methods is listed and rank order of each protein from PICA is noted: 1 is the most abundant and 42 the least abundant protein.
Proteins omitted from BALF vs. serum rank order comparison due to lack of information on serum concentration.
3.2 Intra- and inter-subject variation of normal human BALF
Three different semi-quantitative methods, protein-sequence coverage, peptide spectral counting and PICA, were compared for ability to assess both intra- and inter-subject proteome variability. The intra-sample variability of each method was analyzed using the quadruplicate data for each of the six subject BALF samples (Fig. 2). Protein-sequence coverage and peptide spectral counting showed similar intra-sample variability at 63% (range = 33–73%; SD = 1.3–12.7%) and 65% (range = 21–74%; SD = 1.6–19.5%) similarity, respectively. In contrast, PICA™ analysis, based directly on MS1 precursor ion data, showed much less intra-sample variability at 88% similarity (range = 76–93%) and a much tighter SD (0.8–5.1%). Therefore, we used PICA values for inter-sample comparisons. This analysis revealed an inter-sample variability that ranged at 1–6-fold for the 42 common proteins (Fig. 3). In one subject, fibrinogen, profilin and β-hemoglobin levels were over 50-fold greater than levels in other subjects and these data points were excluded from the inter-sample variability calculations.
Figure 2.
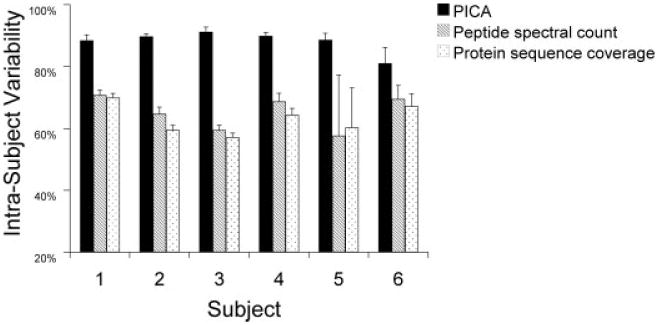
Comparison of intra-sample variability of three label-free methods. Peptide single ion current area (PICA) values, peptide spectral counts and protein sequence coverage were each used to analyze intra-sample variability from quadruplicate LC-MS/MS data for 42 common BALF proteins. Average intra-sample variability is shown with SD for each method.
Figure 3.
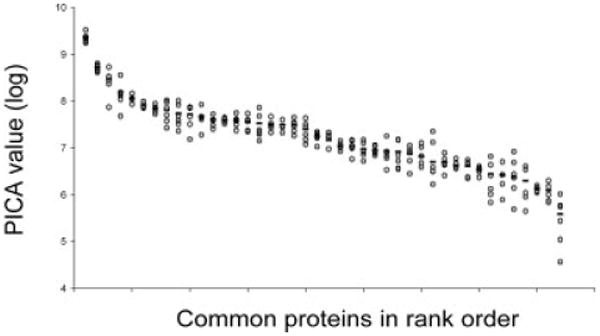
Inter-sample variability of 42 common BALF proteins among six subjects. Variation in protein expression among the six subjects was calculated from peptide single ion current (PICA) values for the 42 common BALF proteins. Data are shown as log (PICA) versus the rank order plot using values shown in Table 1. Open circles represent individual subjects, line represents average value of six subjects
3.3 Biological processes/functions enriched in BALF
We compared the representation of Gene Ontology classifications (i.e. molecular function, biological process and cellular component) from the total identified BALF proteome, a subset of the human proteome, to the predicted distribution of the entire human proteome in all six subjects. Significantly enriched functional categories are shown as a heat map based on p-values (Fig. 4). Processes were grouped using a hierarchical clustering algorithm to emphasize patterns based on enrichment significance. The most significantly enriched processes were remarkably similar in the six subjects (orange-red), whereas there was increased inter-subject variability in the less significantly enriched processes (blue). We found an unexpected enrichment in BALF of proteins involved in carbohydrate binding/metabolism when compared to either the entire human proteome or the human plasma proteome in the majority of subjects. For some processes, there was a high degree of concordance in the specific proteins identified among the six subjects. For example, iron ion homeostasis was significantly enriched and contained identical proteins in all six subjects: cerulo-plasmin (ferroxidase), haptoglobin, hemopexin, lacto-transferrin, and transferrin. Innate immune response was also highly enriched in all six subjects, but only half of the specific proteins were identified in all six subjects. Nevertheless, despite some differences in specific proteins identified, the BALF environment was enriched for similar processes in all six subjects (Fig. 4).
Figure 4.
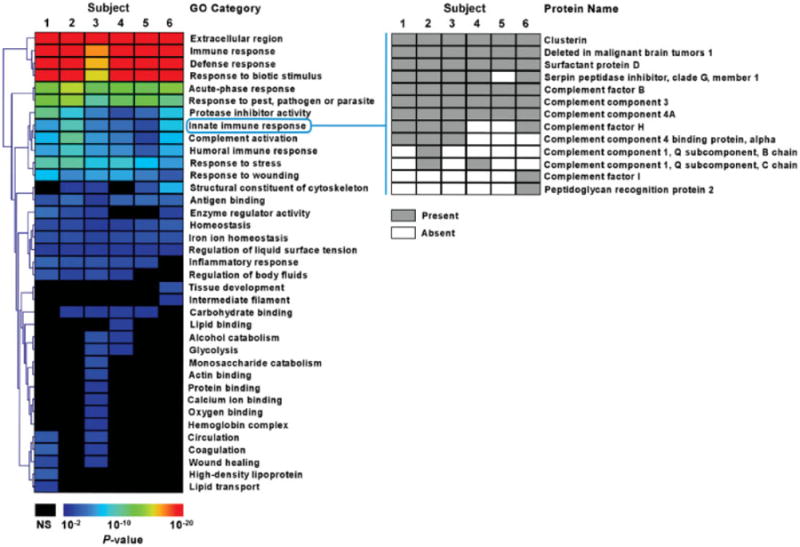
Gene ontology analysis of BALF proteome. Heat map representation of enriched functional categories in BALF proteins from six subjects. The GO processes are hierarchically clustered based on their enrichment significance (p-values). Protein membership of a representative process, innate immune response, is shown emphasizing the presence of both common and unique proteins among the subjects; NS means insignificant p-value.
The observed enrichment of these processes was statistically robust despite corrections for multiple comparisons (Supporting Information Table 3). We also compared the distribution of the BALF proteome to the expected distribution of normal human plasma proteome (Supporting Information Table 4). Surprisingly, even using the plasma proteome subset of the human proteome, the same functional categories were again enriched in BALF. This suggests an active role for lung cells in processes such as defense/immune response as opposed to the passive movement of specific proteins from plasma to airspaces. Of note, we found no significant differences in these results when we used either common proteins or unique proteins in BALF, again suggesting that while there may be differences in specific proteins found in individuals, the overall airspace milieu is similar with regard to biological processes represented.
3.4 Specific proteins enriched in BALF
To complement the assessment of biological processes enriched in the lung, we were interested in enrichment of specific proteins in the lung compared to plasma. To determine this, we first ranked BALF proteins based on their relative abundance determined by PICA (most abundant to least abundant). We then compared their order in BALF to their predicted order in plasma based on published plasma reference values [38] (Fig. 5) because plasma samples were not available for the subjects. Ofthe 42 proteins in common to all six patients BALF, 11 were omitted due to lack of reference plasma levels. Of the 31 remaining proteins, there was only a fair correlation between plasma and BALF proteins rank order (R = 0.32, p =0.07). As expected, pulmonary-derived proteins, e.g. surfactant protein-D and B and Clara cell protein, had higher relative expression in BALF than plasma. Several plasma proteins were over-represented in BALF relative to plasma and are involved in lung immune function and inflammation, such as lysozyme [39], α-1 antitrypsin [40] and Mac2-binding protein [41]. Thus, individual proteins that are enriched in BALF relative to plasma are involved in known functions of the lung including regulation of surface tension (surfactants) and immune function and inflammation. Furthermore, both overrepresented individual proteins and biological processes suggest that the normal BALF protein profile is not simply a reflection of passive diffusion of plasma proteins, but confirm a more complex mechanism governing origin of lung proteins.
Figure 5.
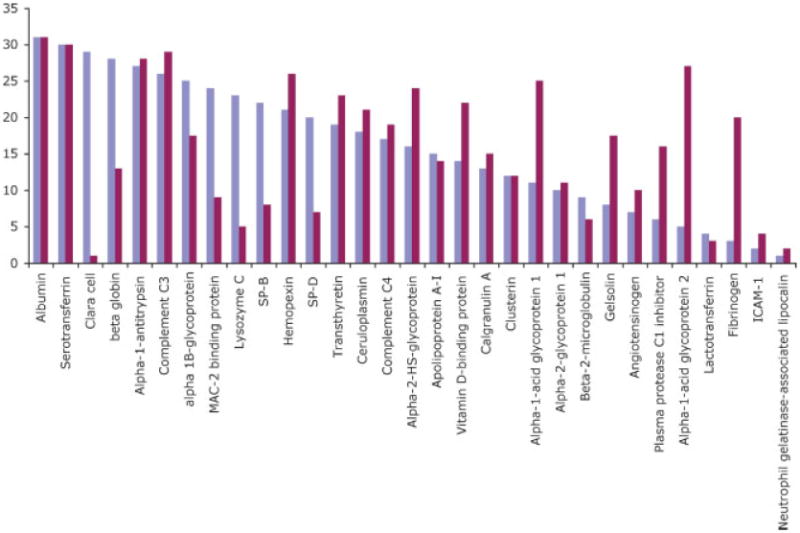
Relative abundance of 31 common proteins in BALF (blue) and plasma (red). BALF rank order was determined using the average PICA value of six subjects. Plasma rank order was determined using previously published values [38]. Data were normalized to albumin (far left) because it is the most abundant protein in both plasma and BALF. Proteins with significantly higher rank order in BALF compared to plasma included Clara C protein, surfactant protein B, surfactant protein D, lysozyme, α1 antitrypsin and Mac2 binding protein.
4 Discussion
4.1 The Lyse-N-Go approach applied to normal human BALF
This study was designed to (i) characterize the normal human BALF proteome in a limited subject set, (ii) compare differences in BALF proteome expression between subjects, and (iii) assess the accuracy of three different MS-based methods to measure intra- and inter-sample variability. To this end, we used a simple shotgun proteomic Lyse-N-Go approach to directly analyze BALF proteins without prior protein fractionation or depletion of high-abundance proteins. The three label-free methods vary in degree of ease of use and sophistication of software required, but all three circumvented the need for stable isotopic labeling by chemical [16, 42–44], metabolic [18, 45–47], or enzymatic [48–50] methods. Since significant protein loss occurs during stable isotope labeling [16, 19], this becomes rate limiting when working with samples of limited quantity and low protein concentrations typical of clinical BALF samples [12].
4.2 Intra-sample variability measured by three MS methods
To determine which of three label-free methods would be most accurate for assessing inter-sample proteome differences, we first compared their ability to assess intra-sample variation of replicate LC-MS analyses of the six normal BALF samples. Protein-sequence coverage is the simplest of the three methods used. Both protein-sequence coverage and peptide spectral counting generated higher intra-sample variability relative to PICA values. The reasons for the high calculated variability differ between the two MS2-based methods. Factors affecting protein sequence coverage calculation of intra-sample variability include (i) the use of dynamic exclusion, which does not completely prevent a previously selected peptide from being reselected [20, 21], but would prevent detection of additional peptides during a given exclusion time window, and consequently affects expression levels of proteins coded by these additional peptides; and (ii) bias due to the length of a given protein; e.g. when a shorter protein and longer protein are identified by peptides with the same length and both proteins are present at the same solution concentration, a higher sequence coverage results for the shorter protein. Given these limitations, we expected protein sequence coverage to under-sample peptides present in the mixture compared to the other two methods, but it is also the easiest of the three methods to conduct.
Peptide spectral counting takes into account all tandem mass spectra for a given peptide no matter how many times it is selected for CID. An advantage of peptide spectral counting is that a standard software package such as Excel is sufficient to calculate the differences in relative protein expression. While the same general limitations of protein-sequence coverage apply to peptide spectral counting, we found that peptide spectral counting provided only slightly better intra-sample variability than protein-sequence coverage (Fig. 2). While the use of dynamic exclusion during LC-MS/MS analysis of a complex peptide mixture limits the number of times a single peptide may be selected for CID, peptides from highly expressed proteins and peptides that ionize well are more likely to be reselected for CID compared to other peptides. This is true even though some element of randomness contributes to re-selection of peptide previously selected for CID [20]. Thus, our results agree with prior comparisons [20, 21] that peptide spectral counting presents a slightly better reflection of protein rank order in a sample than protein-sequence coverage.
The direct use of MS1 data by PICA™ to calculate intra-sample variability was superior to the results obtained by the two MS2-based methods. This is most likely because the MS1 data used by PICA™ software is dependent only on precursor ion scans for individual peptides rather than the intermittent selection of a peptide for CID that occur for a given peptide during peptide spectral counting. Therefore, the PICA based method is not affected by limitations of dynamic exclusion during data-dependent acquisition or by the length of a given protein. Data quality is a direct function of the amount of time designated to record precursor ion scans during LC-MS/MS analysis [32]. Because we measured the presence of all observable peptides by MS, this method should have the least intra-sample variability, which we confirmed.
4.3 Inter-sample biological variability among the six normal BALF samples
To calculate inter-sample biological variation of proteins present in the six BALF samples, we used the PICA method because this method had the best intra-sample reproducibility (Fig. 2). We found that the majority of common proteins (i.e. albumin, transferrin, IgG, α1-acid-glycoprotein-1, SP-D, and complement component C3) had expression differences ranging up to five-fold between the six BALF samples (Fig. 3). However, some proteins, e.g. fibrinogen, profilin and β-hemoglobin, had much larger differences in expression (over 50-fold) across the six subjects. The reasons for this are not entirely clear, but may be due to the presence of isoforms of these proteins. Unlike 2-DE, which separates protein isoforms prior to identification, shotgun proteomic approaches cannot distinguish isoforms where homologous peptides are detected. In these cases shotgun proteomic methods will present an isoform-composite signal, which can skew results [51]. Thus, we speculate that degenerate (or homologous) peptides derived from different forms of fibrinogen, profilin and hemoglobins may have increased measured inter-sample variability.
Many studies of lung diseases have reported changes in BALF protein expression in disease states compared to normal controls on 2-D PAGE [7, 14, 52]. Our study demonstrates the potential large degree of variability among different normals, thus making interpretation of changes with disease more problematic. Finally, since only approximately half of the proteins identified were common to all six subjects, there may be even more biological variability than we observed in 42 common proteins.
4.4 BALF proteome
We demonstrate that we can readily identify ∼100 proteins per BALF sample without any significant sample preparation. This analysis likely underestimates the number of unique and common proteins present in normal BALF samples [53]. As shown in plasma-proteome studies, high protein-sequence coverage is obtained on relatively few proteins unless prior fractionation of the proteome or depletion of high-abundance proteins is done [31, 54]. Depletion of high-abundance proteins was avoided because it would have altered the interpretation of the normal lung lavage environment. To increase the number of identified proteins beyond the ∼100 proteins per sample found here, proteome fractionation prior to identification by LC-MS/MS methods will be needed.
Previous studies of proteomic analysis of BALF have generally used 2-DE. In all of the prior studies of normal BALF, the majority of proteins identified were serum proteins [7, 14]. For example, the earliest 2-D gel analysis of BALF soluble proteins identified 23 serum proteins, which made up 97% of the total BALF protein [36]. In the most complete database of 2-D gel protein map, the majority of proteins identified in their analysis were also identified in our current study [7]. Most of the proteins missing from our list were intracellular proteins such as calcyclin, calreticulin, and nuclear chloride-ion channel. This difference may relate to initial sample preparation and method for removal of cells from BALF. In a more recent study by Bowler et al. [14], all proteins identified in normal epithelial lining fluid were identified in our study as well. Thus, our method is able to identify similar proteins as previous studies with minimal sample preparation time. In addition, we identified a number of important proteins not previously identified by 2-DE including surfactant protein B, surfactant protein D, carbonic anhydrase, angiotensinogen, leukotriene hydrolase and mucin (Supporting Information Table 1). Of note, none of the previous proteomic analysis of BALF, including the current analysis, has identified surfactant protein C, which may relate to its hydrophobicity and/or relative concentration.
Proteins found in normal BALF may originate from a variety of sources including passive and active transport of plasma proteins [55], and cellular production by resident structural cells (i.e. pulmonary epithelial cells, Clara cells) or resident circulating cells (alveolar macrophages, lung lymphocytes) [56]. In addition, many of the identified plasma proteins are also synthesized in the lung (including transferrin, fibrinogen, immunoglobulins, apoprotein A1, etc.), making determination of origin unclear. However, Gene Ontology analysis demonstrated that the same functional categories that were enriched relative to the total human proteome were also enriched relative to the smaller plasma proteome set (Supporting Information Tables 2 and 3), arguing for active enrichment and against passive movement of specific proteins from plasma to airspaces.
Functional classification provides a global assessment of the lung microenvironment and can confirm known functions of the lung as well as suggest unsuspected lung functions. The lung is a major entry site for pathogens, and serves as an important immune organ, as evident by the overrepresented processes such as immune response, and acute phase response, and by the overrepresented specific proteins such as surfactants (Figs. 4 and 5). Carbohydrate metabolism was significantly enriched in lung BALF in four out of six samples. Interestingly, surfactants contain carbohydrate recognition domains that can bind to carbohydrate ligands on microorganisms or circulating cells. Thus, enrichment in proteins involved in carbohydrate metabolism may reflect a role in immune function or host defense, or other functions such as regulation of energy homeostasis, or regulation of matrix components such as glycosaminoglycans.
While there was significant variability in the specific proteins identified in each subject, there was remarkable similarity in the highly significantly enriched processes in all six subjects. Gene Ontology analysis is less affected by missed identification of a specific protein, or multiple isoforms of proteins both of which may result from shotgun proteomic analysis. Significantly enriched processes had p-values ranging from 10−2 to 10−25 when analyzing ≤100 proteins per subject. Thus, one is able to make global assessments of changes in the lung space environment using a “core” number of identified proteins that is relatively unaffected by the sampling issues inherent in shotgun proteomic analysis. Changes in enriched processes in lung disease may provide new insights into mechanisms of disease using a small number of identified proteins.
We studied BALF proteomes from six healthy human subjects, compared intra-sample variability of several label-free MS-based proteomic methods and determined biological variability of common proteins from subject to subject. The intra-subject variation calculated directly from MS1 data via PICA™ analysis was consistently better than peptide spectral counting or protein-sequence coverage, suggesting extraction of peptide abundance from MS1-based methods provided a more reliable assessment of relative protein quantification than the MS2-based label-free methods. Significant inter-sample variability suggests that biological variability in normal protein expression must be taken into account when comparing disease versus normal. In addition, determination of over-represented biological processes in the lung confirmed the importance of known roles of the lung in host defense and immune response and suggested additional roles of the lung in carbohydrate metabolism. Analysis of enriched processes during disease versus control may provide insight into disease pathogenesis using even a small number of identified proteins.
Acknowledgments
We thank Dr. David Park for assistance with bronchoscopy and the following NIH grants for funding in part: RO1 HL73028, HL083481, K24HL086796-02, SCCOR P50 HL073996, ALA Career Investigator Award (LMS), HL074223 (SAG), 1U54AI57141-01 (DRG) and P30ES007033-10 (DRG) and NIH contract N01-HV-28179.
Abbreviations
- BALF
bronchoalveolar lavage fluid
- PICA
peptide single ion current areas
Footnotes
The authors have declared no conflict of interest.
References
- 1.Lindahl M, Stahlbom B, Tagesson C. Newly identified proteins in human nasal and bronchoalveolar lavage fluids: potential biomedical and clinical applications. Electrophoresis. 1999;20:3670–3676. doi: 10.1002/(SICI)1522-2683(19991201)20:18<3670::AID-ELPS3670>3.0.CO;2-Z. [DOI] [PubMed] [Google Scholar]
- 2.Lindahl M, Stahlbom B, Svartz J, Tagesson C. Protein patterns of human nasal and bronchoalveolar lavage fluids analyzed with two-dimensional gel electrophoresis. Electrophoresis. 1998;19:3222–3229. doi: 10.1002/elps.1150191828. [DOI] [PubMed] [Google Scholar]
- 3.Lindahl M, Ekstrom T, Sorensen J, Tagesson C. Two dimensional protein patterns of bronchoalveolar lavage fluid from non-smokers, smokers, and subjects exposed to asbestos. Thorax. 1996;51:1028–1035. doi: 10.1136/thx.51.10.1028. [DOI] [PMC free article] [PubMed] [Google Scholar]
- 4.Wattiez R, Hermans C, Bernard A, Lesur O, et al. Human bronchoalveolar lavage fluid: two-dimensional gel electrophoresis, amino acid microsequencing and identification of major proteins. Electrophoresis. 1999;20:1634–1645. doi: 10.1002/(SICI)1522-2683(19990601)20:7<1634::AID-ELPS1634>3.0.CO;2-J. [DOI] [PubMed] [Google Scholar]
- 5.Lenz AG, Meyer B, Costabel U, Maier K. Bronchoalveolar lavage fluid proteins in human lung disease: analysis by two-dimensional electrophoresis. Electrophoresis. 1993;14:242–244. doi: 10.1002/elps.1150140141. [DOI] [PubMed] [Google Scholar]
- 6.Reynolds HY. Use of bronchoalveolar lavage in humans–past necessity and future imperative. Lung. 2000;178:271–293. doi: 10.1007/s004080000032. [DOI] [PMC free article] [PubMed] [Google Scholar]
- 7.Noel-Georis I, Bernard A, Falmagne P, Wattiez R. Database of bronchoalveolar lavage fluid proteins. J Chromatogr B Analyt Technol Biomed Life Sci. 2002;771:221–236. doi: 10.1016/s1570-0232(02)00114-9. [DOI] [PubMed] [Google Scholar]
- 8.von Bredow C, Birrer P, Griese M. Surfactant protein A and other bronchoalveolar lavage fluid proteins are altered in cystic fibrosis. Eur Respir J. 2001;17:716–722. doi: 10.1183/09031936.01.17407160. [DOI] [PubMed] [Google Scholar]
- 9.Griese M. Pulmonary surfactant in health and human lung diseases: state of the art. Eur Respir J. 1999;13:1455–1476. doi: 10.1183/09031936.99.13614779. [DOI] [PubMed] [Google Scholar]
- 10.Soler N, Torres A, Ewig S, Gonzalez J, et al. Bronchial microbial patterns in severe exacerbations of chronic obstructive pulmonary disease (COPD) requiring mechanical ventilation. Am J Respir Crit Care Med. 1998;157:1498–1505. doi: 10.1164/ajrccm.157.5.9711044. [DOI] [PubMed] [Google Scholar]
- 11.Plymoth A, Lofdahl CG, Ekberg-Jansson A, Dahlback M, et al. Human bronchoalveolar lavage: biofluid analysis with special emphasis on sample preparation. Proteomics. 2003;3:962–972. doi: 10.1002/pmic.200300387. [DOI] [PubMed] [Google Scholar]
- 12.Schnapp LM, Donohoe S, Chen J, Sunde DA, et al. Mining the acute respiratory distress syndrome proteome: identification of the insulin-like growth factor (IGF)/IGF-binding protein-3 pathway in acute lung injury. Am J Pathol. 2006;169:86–95. doi: 10.2353/ajpath.2006.050612. [DOI] [PMC free article] [PubMed] [Google Scholar]
- 13.Pittet JF, Mackersie RC, Martin TR, Matthay MA. Biological markers of acute lung injury: prognostic and pathogenetic significance. Am J Respir Crit Care Med. 1997;155:1187–1205. doi: 10.1164/ajrccm.155.4.9105054. [DOI] [PubMed] [Google Scholar]
- 14.Bowler RP, Duda B, Chan ED, Enghild JJ, et al. Proteomic analysis of pulmonary edema fluid and plasma in patients with acute lung injury. Am J Physiol Lung Cell Mol Physiol. 2004;286:L1095–1104. doi: 10.1152/ajplung.00304.2003. [DOI] [PubMed] [Google Scholar]
- 15.Park WY, Goodman RB, Steinberg KP, Ruzinski JT, et al. Cytokine balance in the lungs of patients with acute respiratory distress syndrome. Am J Respir Crit Care Med. 2001;164:1896–1903. doi: 10.1164/ajrccm.164.10.2104013. [DOI] [PubMed] [Google Scholar]
- 16.Gygi SP, Rist B, Gerber SA, Turecek F, et al. Quantitative analysis of complex protein mixtures using isotopecoded affinity tags. Nat Biotechnol. 1999;17:994–999. doi: 10.1038/13690. [DOI] [PubMed] [Google Scholar]
- 17.Ross PL, Huang YN, Marchese JN, Williamson B, et al. Multiplexed protein quantitation in Saccharomyces cerevisiae using amine-reactive isobaric tagging reagents. Mol Cell Proteomics. 2004;3:1154–1169. doi: 10.1074/mcp.M400129-MCP200. [DOI] [PubMed] [Google Scholar]
- 18.Ong SE, Kratchmarova I, Mann M. Properties of 13C-substituted arginine in stable isotope labeling by amino acids in cell culture (SILAC) J Proteome Res. 2003;2:173–181. doi: 10.1021/pr0255708. [DOI] [PubMed] [Google Scholar]
- 19.Aebersold R, Mann M. Mass spectrometry-based proteomics. Nature. 2003;422:198–207. doi: 10.1038/nature01511. [DOI] [PubMed] [Google Scholar]
- 20.Wang W, Zhou H, Lin H, Roy S, et al. Quantification of proteins and metabolites by mass spectrometry without isotopic labeling or spiked standards. Anal Chem. 2003;75:4818–4826. doi: 10.1021/ac026468x. [DOI] [PubMed] [Google Scholar]
- 21.Liu H, Sadygov RG, Yates JR., 3rd A model for random sampling and estimation of relative protein abundance in shotgun proteomics. Anal Chem. 2004;76:4193–4201. doi: 10.1021/ac0498563. [DOI] [PubMed] [Google Scholar]
- 22.Steinberg KP, Milberg JA, Martin TR, Maunder RJ, et al. Evolution of bronchoalveolar cell populations in the adult respiratory distress syndrome. Am J Respir Crit Care Med. 1994;150:113–122. doi: 10.1164/ajrccm.150.1.8025736. [DOI] [PubMed] [Google Scholar]
- 23.Matute-Bello G, Liles WC, Radella F, 2nd, Steinberg KP, et al. Neutrophil apoptosis in the acute respiratory distress syndrome. Am J Respir Crit Care Med. 1997;156:1969–1977. doi: 10.1164/ajrccm.156.6.96-12081. [DOI] [PubMed] [Google Scholar]
- 24.Greene KE, Wright JR, Steinberg KP, Ruzinski JT, et al. Serial changes in surfactant-associated proteins in lung and serum before and after onset of ARDS. Am J Respir Crit Care Med. 1999;160:1843–1850. doi: 10.1164/ajrccm.160.6.9901117. [DOI] [PubMed] [Google Scholar]
- 25.Foss EJ, Radulovic D, Shaffer SA, Ruderfer DM, et al. Genetic basis of proteome variation in yeast. Nat Genet. 2007;39:1369–1375. doi: 10.1038/ng.2007.22. [DOI] [PubMed] [Google Scholar]
- 26.Yi EC, Lee H, Aebersold R, Goodlett DR. A microcapillary trap cartridge-microcapillary high-performance liquid chromatography electrospray ionization emitter device capable of peptide tandem mass spectrometry at the attomole level on an ion trap mass spectrometer with automated routine operation. Rapid Commun Mass Spectrom. 2003;17:2093–2098. doi: 10.1002/rcm.1150. [DOI] [PubMed] [Google Scholar]
- 27.Pedrioli PG, Eng JK, Hubley R, Vogelzang M, et al. A common open representation of mass spectrometry data and its application to proteomics research. Nat Biotechnol. 2004;22:1459–1466. doi: 10.1038/nbt1031. [DOI] [PubMed] [Google Scholar]
- 28.Nesvizhskii AI, Keller A, Kolker E, Aebersold R. A statistical model for identifying proteins by tandem mass spectrometry. Anal Chem. 2003;75:4646–4658. doi: 10.1021/ac0341261. [DOI] [PubMed] [Google Scholar]
- 29.Dennis G, Jr, Sherman BT, Hosack DA, Yang J, et al. DAVID: Database for Annotation, Visualization, and Integrated Discovery. Genome Biol. 2003;4:P3. [PubMed] [Google Scholar]
- 30.Ashburner M, Ball CA, Blake JA, Botstein D, et al. Gene ontology: tool for the unification of biology. The Gene Ontology Consortium. Nat Genet. 2000;25:25–29. doi: 10.1038/75556. [DOI] [PMC free article] [PubMed] [Google Scholar]
- 31.Omenn GS, States DJ, Adamski M, Blackwell TW, et al. Overview of the HUPO Plasma Proteome Project: results from the pilot phase with 35 collaborating laboratories and multiple analytical groups, generating a core dataset of 3020 proteins and a publicly-available database. Proteomics. 2005;5:3226–3245. doi: 10.1002/pmic.200500358. [DOI] [PubMed] [Google Scholar]
- 32.Radulovic D, Jelveh S, Ryu S, Hamilton TG, et al. Informatics platform for global proteomic profiling and bio-marker discovery using liquid chromatography-tandem mass spectrometry. Mol Cell Proteomics. 2004;3:984–997. doi: 10.1074/mcp.M400061-MCP200. [DOI] [PubMed] [Google Scholar]
- 33.Li XJ, Zhang H, Ranish JA, Aebersold R. Automated statistical analysis of protein abundance ratios from data generated by stable-isotope dilution and tandem mass spectrometry. Anal Chem. 2003;75:6648–6657. doi: 10.1021/ac034633i. [DOI] [PubMed] [Google Scholar]
- 34.Goo YA, Shaffer S, Malmstroem L, Walashek L, et al. Identification of secreted glycoproteins of human prostate and bladder stromal cells by comparative quantitativ proteomics. J Proteome Res. 2007 doi: 10.1002/pros.20853. accepted. [DOI] [PMC free article] [PubMed] [Google Scholar]
- 35.Fisher R. The International Congress of Mathematics. Vol. 2. Toronto: 1924. On a distribution yielding the error functions of several well known statistics; pp. 805–813. [Google Scholar]
- 36.Bell DY, Haseman JA, Spock A, McLennan G, et al. Plasma proteins of the bronchoalveolar surface of the lungs of smokers and nonsmokers. Am Rev Respir Dis. 1981;124:72–79. doi: 10.1164/arrd.1981.124.1.72. [DOI] [PubMed] [Google Scholar]
- 37.Bingle CD, Bingle L. Characterisation of the human plunc gene, a gene product with an upper airways and nasopharyngeal restricted expression pattern. Biochim Biophys Acta. 2000;1493:363–367. doi: 10.1016/s0167-4781(00)00196-2. [DOI] [PubMed] [Google Scholar]
- 38.Directory of Services, and Use and Interpretation of Tests. Speciality Laboratories; Santa Monica, CA: 2001. [Google Scholar]
- 39.Ganz T. Antimicrobial polypeptides in host defense of the respiratory tract. J Clin Invest. 2002;109:693–697. doi: 10.1172/JCI15218. [DOI] [PMC free article] [PubMed] [Google Scholar]
- 40.Ghafouri B, Stahlbom B, Tagesson C, Lindahl M. Newly identified proteins in human nasal lavage fluid from non-smokers and smokers using two-dimensional gel electrophoresis and peptide mass fingerprinting. Proteomics. 2002;2:112–120. [PubMed] [Google Scholar]
- 41.Ullrich A, Sures I, D'Egidio M, Jallal B, et al. The secreted tumor-associated antigen 90K is a potent immune stimulator. J Biol Chem. 1994;269:18401–18407. [PubMed] [Google Scholar]
- 42.Zhou H, Ranish JA, Watts JD, Aebersold R. Quantitative proteome analysis by solid-phase isotope tagging and mass spectrometry. Nat Biotechnol. 2002;20:512–515. doi: 10.1038/nbt0502-512. [DOI] [PubMed] [Google Scholar]
- 43.Griffin TJ, Gygi SP, Rist B, Aebersold R, et al. Quantitative proteomic analysis using a MALDI quadrupole time-of-flight mass spectrometer. Anal Chem. 2001;73:978–986. doi: 10.1021/ac001169y. [DOI] [PubMed] [Google Scholar]
- 44.Chakraborty A, Regnier FE. Global internal standard technology for comparative proteomics. J Chromatogr A. 2002;949:173–184. doi: 10.1016/s0021-9673(02)00047-x. [DOI] [PubMed] [Google Scholar]
- 45.Oda Y, Huang K, Cross FR, Cowburn D, et al. Accurate quantitation of protein expression and site-specific phosphorylation. Proc Natl Acad Sci USA. 1999;96:6591–6596. doi: 10.1073/pnas.96.12.6591. [DOI] [PMC free article] [PubMed] [Google Scholar]
- 46.Krijgsveld J, Ketting RF, Mahmoudi T, Johansen J, et al. Metabolic labeling of C. elegans and D. melanogaster for quantitative proteomics. Nat Biotechnol. 2003;21:927–931. doi: 10.1038/nbt848. [DOI] [PubMed] [Google Scholar]
- 47.Veenstra TD, Martinovic S, Anderson GA, Pasa-Tolic L, et al. Proteome analysis using selective incorporation of isotopically labeled amino acids. J Am Soc Mass Spectrom. 2000;11:78–82. doi: 10.1016/S1044-0305(99)00120-8. [DOI] [PubMed] [Google Scholar]
- 48.Stewart II, Thomson T, Figeys D. 18O labeling: a tool for proteomics. Rapid Commun Mass Spectrom. 2001;15:2456–2465. doi: 10.1002/rcm.525. [DOI] [PubMed] [Google Scholar]
- 49.Yao X, Freas A, Ramirez J, Demirev PA, et al. Proteolytic 18O labeling for comparative proteomics: model studies with two serotypes of adenovirus. Anal Chem. 2001;73:2836–2842. doi: 10.1021/ac001404c. [DOI] [PubMed] [Google Scholar]
- 50.Mayya V, Han DK. Proteomic applications of protein quantification by isotope-dilution mass spectrometry. Expert Rev Proteomics. 2006;3:597–610. doi: 10.1586/14789450.3.6.597. [DOI] [PubMed] [Google Scholar]
- 51.Nesvizhskii AI, Aebersold R. Interpretation of shotgun proteomic data: the protein inference problem. Mol Cell Proteomics. 2005;4:1419–1440. doi: 10.1074/mcp.R500012-MCP200. [DOI] [PubMed] [Google Scholar]
- 52.Sabounchi-Schutt F, Astrom J, Hellman U, Eklund A, et al. Changes in bronchoalveolar lavage fluid proteins in sarcoidosis: a proteomics approach. Eur Respir J. 2003;21:414–420. doi: 10.1183/09031936.03.00060902. [DOI] [PubMed] [Google Scholar]
- 53.Wu J, Kobayashi M, Sousa EA, Liu W, et al. Differential proteomic analysis of bronchoalveolar lavage fluid in asthmatics following segmental antigen challenge. Mol Cell Proteomics. 2005;4:1251–1264. doi: 10.1074/mcp.M500041-MCP200. [DOI] [PubMed] [Google Scholar]
- 54.Betgovargez E, Knudson V, Simonian MH. Characterization of proteins in the human serum proteome. J Biomol Tech. 2005;16:306–310. [PMC free article] [PubMed] [Google Scholar]
- 55.John TA, Vogel SM, Minshall RD, Ridge K, et al. Evidence for the role of alveolar epithelial gp60 in active transalveolar albumin transport in the rat lung. J Physiol. 2001;533:547–559. doi: 10.1111/j.1469-7793.2001.0547a.x. [DOI] [PMC free article] [PubMed] [Google Scholar]
- 56.Kim KJ, Malik AB. Protein transport across the lung epithelial barrier. Am J Physiol Lung Cell Mol Physiol. 2003;284:L247–259. doi: 10.1152/ajplung.00235.2002. [DOI] [PubMed] [Google Scholar]