Abstract
Phosphoryl transfer reactions are ubiquitous in biology, and the understanding of the mechanisms whereby these reactions are catalyzed by protein and RNA enzymes is central to reveal design principles for new therapeutics. Two of the most powerful experimental probes of chemical mechanism involve the analysis of linear free energy relations (LFERs) and the measurement of kinetic isotope effects (KIEs). These experimental data report directly on differences in bonding between the ground state and the rate-controlling transition state, which is the most critical point along the reaction free energy pathway. However, interpretation of LFER and KIE data in terms of transition state structure and bonding optimally requires the use of theoretical models. In this work, we apply density-functional calculations to determine KIEs for a series of phosphoryl transfer reactions of direct relevance to the 2’-O-transphosphorylation that leads to cleavage of the phosphodiester backbone of RNA. We first examine a well-studied series of phosphate and phosphorothioate mono-, di- and triesters that are useful as mechanistic probes and for which KIEs have been measured. Close agreement is demonstrated between the calculated and measured KIEs, establishing the reliability of our quantum model calculations. Next, we examine a series of RNA transesterification model reactions with a wide range of leaving groups in order to provide a direct connection between observed Brønsted coefficients and KIEs with the structure and bonding in the transition state. These relations can be used for prediction or to aid in the interpretation of experimental data for similar non-enzymatic and enzymatic reactions. Finally, we apply these relations to RNA phosphoryl transfer catalyzed by ribonuclease A, and demonstrate the reaction coordinate-KIE correlation is reasonably preserved. A prediction of the secondary deuterium KIE in this reaction is also provided. These results demonstrate the utility of building up knowledge of mechanism through the systematic study of model systems to provide insight into more complex biological systems such as phosphoryl transfer enzymes and ribozymes.
Keywords: Isotope effect, RNA, Leaving-group effect, Reaction mechanisms, Enzyme catalysis
Introduction
The chemistry of phosphorus is central to many essential biological processes such as cell signaling, energy conversion, and gene regulation. 1–5 Of interest here is the study of phosphoryl transfer reactions in RNA, and in particular, those reactions catalyzed by small prototype RNA and protein enzymes, including the hammerhead, 6 hairpin, 7 hepatitis delta virus, 8 glmS 9 and Varkud satellite (VS) 10 ribozymes and RNase A. 11 The mechanisms of phosphoryl transfer reactions, both in enzymatic and non-enzymatic systems, have been the focus of extensive experimental investigation. The comparison between non-enzymatic and enzymatic reaction mechanisms is essential since it reveals key information on the catalytic modes that enzymes achieve rate enhancement.
One important method used in those studies is linear free energy relationship (LFER) analysis, which quantifies the effect of changing the nucleophile or leaving group reactivity (via chemical modification) on the reaction rate. 12,13 Brønsted coefficients 14 and Leffler indices 15 are valuable parameters that characterize the extent of bond formation/fission in the rate-controlling transition state (TS). Brønsted coefficients compare the effect of changes in nucleophile or leaving group reactivity (pKa) on the reaction rate calibrated against the effect changing pKa on reaction equilibria ( β E Q) in order to estimate charge development in the TS. In many instances LFER can be used to discern between pathways through the reaction free energy landscape. 16–20 However, interpretation is limited by the accuracy of estimated β E Q values, and can be complicated by effects on solvation and indirect effects due to differences in chemical structure. 13
Another widely used method in the mechanistic study is the measurement of kinetic isotope effects (KIEs). KIEs arise because heavier stable isotopes have lower zero point vibrational energies than their lighter counterparts. Differences in bond stiffness between the ground state and TS result in differences in activation energy and consequently differences in rate constant (expressed as klight /kheavy). 21,22 Decreased or increased stiffness in the bonding environment surrounding a certain atom in the TS compared to the reactant state leads to a normal (greater than unity) or inverse (less than unity) KIE, respectively, when this atom is substituted by its heavier isotope. Experiments that have been performed to measure KIEs in RNA transphosphorylation have greatly enhanced our understanding of the reaction mechanisms. 23–25 However, observed KIEs necessarily reflect changes in all vibrational modes involving the substituted atom, including changes in protonation, reaction coordinate bonding and hybridization, which can make them difficult to interpret unambiguously. Thus, theoretical modeling is required in order to provide a detailed molecular-level interpretation of this data.
In the present work, we report results from quantum mechanical calculations of KIEs in a series of reactions that are closely related to RNA transphosphorylation. First, several computational methods for KIE prediction are tested for a set of benchmark phosphate/phosphorothioate ester hydrolysis reactions 26 which have well-established experimental results. Second, the validated method is applied to a series of RNA transphosphorylation model reactions in which LFERs have been calculated 27 in order to form a quantitative connection with KIE data that can be used for prediction. Finally, model reactions that mimic the RNA phosphodiester backbone cleavage in solution and catalyzed by RNase A 25 are studied. Experimental KIE results and coordinated computational simulations correspond well with the mechanistic predictions drawn from simulations of model reactions with different leaving group pKa. Observed KIEs for RNase A catalysis are generally consistent with the mechanistic signature for a late transition state, however, a significantly lower leaving group effect is observed that is attributable to stabilizing catalytic modes not present in the solution.
Computational Methods
Phosphate/phosphorothioate ester hydrolysis
DFT calculations were performed using both B3LYP 28,29 and M06-2X 30 functionals to establish the appropriate level of theory. Reactant state (RS) and transition state (TS) geometries of the 8 phosphate ester hydrolysis reactions listed in Table 3 of Ref. 26 were optimized using those functionals with 6-31++G(d,p) basis set. PCM solvation model 31,32 was used to address the solvent effects together with two sets of solute atomic radii, UFF 33 and UAKS. 34 Harmonic vibrational analysis was performed to verify the nature of all stationary points. KIEs for those experimentally investigated isotopic substitutions in all 8 reactions were then computed using Bigeleisen equation. 21,35 Temperatures in the KIE calculations were chosen to be consistent with experiments, where relevant.
LFER series
The reverse of dianionic in-line alcoholysis of ethylene phosphate was used in this work as a model for RNA phosphate transesterification reaction (see Scheme 3), as was done in previous work. 24,27 A series of 15 reactions with a wide spectrum of different 5’-O leaving groups (see Table 2) have been studied. The RS and TS geometries for all reactions were optimized using B3LYP/6-31++G(d,p) in PCM solvation with UAKS radii set. The B3LYP functional was chosen because the B3LYP results from the phosphate ester hydrolysis benchmark calculations described above show better agreement with experiment than those using M06-2X. Nucleophile oxygen (2’- O) and leaving group oxygen (5’-O) KIEs at 298.15K for all reactions were computed by the same method as described in the previous subsection.
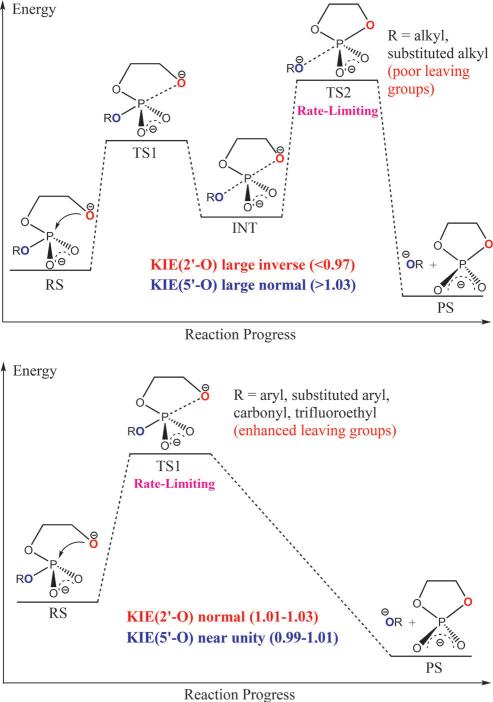
Scheme 3.
Illustration of the two types of mechanisms in the LFER series.
Table 2.
Computed KIE values for LFER reactions and RNase A model reaction. Experimental pKas of the conjugate acids of different leaving groups are taken from IUPAC chemical data series (No. 23),47 except for HOCH2CH2OH and 2,3,5,6-F4-C6HOH, which are obtained from CRC Handbook 48 and Bourne et al.,18 respectively. RNase A experimental KIEs were measured at 310.15K25 instead of 298.15K for all other KIEs. Numbers in parentheses are the standard deviations for experimentally measured KIEs.
| Leaving Group | Expt. pKa | ξ(Å) | KIE(2'-O) | KIE(5'-O) |
|---|---|---|---|---|
| CH3COO– | 4.46 | −0.62 | 1.0256 | 0.9999 |
| 2,3,5,6-F4-C6HO– | 5.53 | −0.57 | 1.0214 | 1.0090 |
| 4-NO2-QH4O– | 7.14 | −0.65 | 1.0250 | 1.0032 |
| 4-CN-QH4O– | 7.95 | −0.60 | 1.0239 | 1.0032 |
| 3-CN-QH4O– | 8.61 | −0.56 | 1.0218 | 1.0036 |
| C6H5O– | 9.95 | −0.52 | 1.0233 | 1.0046 |
| CF3CH2O– | 12.37 | −0.44 | 1.0203 | 1.0057 |
| HCCCH2O– | 13.55 | 0.48 | 0.9672 | 1.0454 |
| FCH2CH2O– | 14.2 | 0.54 | 0.9673 | 1.0481 |
| ClCH2CH2O– | 14.31 | 0.49 | 0.9690 | 1.0451 |
| HOCH2CH2O– | 15.07 | 0.48 | 0.9676 | 1.0441 |
| CH3O– | 15.54 | 0.63 | 0.9666 | 1.0649 |
| CH3CH2O– | 16 | 0.60 | 0.9678 | 1.0489 |
| CH3CH2CH2O– | 16.1 | 0.59 | 0.9676 | 1.0465 |
| CH3CH3CHO– | 17.1 | 0.55 | 0.9683 | 1.0475 |
| RNase A Model | 0.14 | 0.9973 | 1.0272 | |
| RNase A Expt. | N/A | 0.994(2) | 1.014(3) | |
RNase A model reactions
RS and TS geometries of the enzymatic model reaction which were optimized with B3LYP/6-31++G(d,p) in PCM implicit solvent using specialized atomic radii for RNase A catalysis, which we've adopted from previous work. 24,25 An additional imidazole ring resembling His12 in RNase A, which was only used in TS in previous work 25, has been added to the RS as well. KIEs of the 2’-O and 5’-O were calculated at 298.15K using the same protocol as described above. All electronic structure calculations were carried out in Gaussian 09 package. 36
Results and Discussion
Validation and comparison of computed KIEs
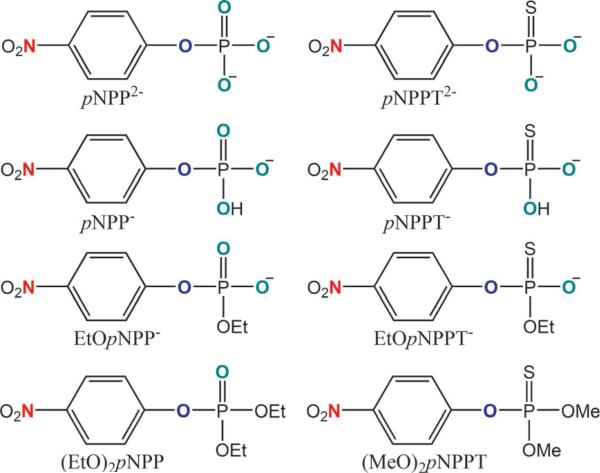
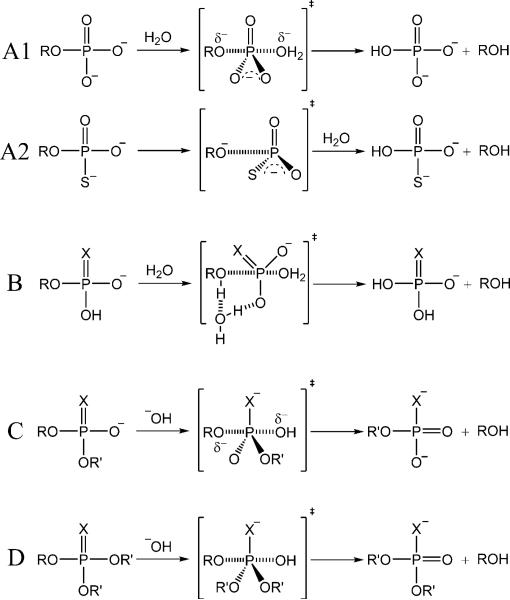
Heavy-atom isotope effects, in most cases, have less than a few percent variation from unity. 22 Therefore, it is important to establish a solid computational model which enables the reproduction and prediction of KIE values with satisfactory accuracy and precision. Here, we test three different methods on a related series of phosphate ester hydrolysis reactions 26 in which experimental KIEs have been well established. Scheme 1 shows the structures of all 8 phosphate ester reactants and Scheme 2 illustrates the different types of mechanisms in the hydrolysis of those reactants. The KIEs calculated using the different computational protocols and their corresponding experimental values are listed in Table 1 and displayed in Figure 1.
Scheme 1.
List of structures and abbreviations of the 8 reactants in the phosphate ester hydrolysis reactions studied in this work. Nitrogen, bridging oxygen and non-bridging oxygen atoms which are colored in dark green, blue and red are used to calculate 15k, 18kbridge and 18knonbridge values, respectively.
Scheme 2.
Illustration of different types of mechanisms in the phosphate ester hydrolysis reactions. A, B, C and D depict the mechanisms with respect to monoester dianionic, monoester monoanionic, diester and triester hydrolysis reactions. R = p-nitrobenzene, R’ = methyl/ethyl, X = O/S.
Table 1.
Comparison of KIE values for phosphate/phosphorothioate ester hydrolysis reactions. Most experimental results are from Ref. 26 while the 18knonbridge value for EtOpNPP– (0.9974) comes from Ref. 13. Structures and abbreviations of all reactants are shown in Scheme 1. Different classes of mechanisms are illustrated in Scheme 2. 18knonbridge values for the hydrolysis of (MeO)2pNPPT are not applicable because there is no non-bridging oxygen in this reactant. Numbers in parentheses are the signed differences multiplied by 104. R is Pearson's correlation coefficient, MSD and MAD stand for mean signed difference and mean absolute difference, respectively.
| Reactant (Mechanism) | Substitution | B3LYP |
M06-2X UAKS | Expt. | |
|---|---|---|---|---|---|
| UFF | UAKS | ||||
| pNPP2–(95°C) (A1) | 15 k | 1.0033 (+5) | 1.0050 (+22) | 1.0049 (+21) | 1.0028 |
| 18 k bridge | 1.0229 (+40) | 1.0122 (−67) | 1.0142 (−47) | 1.0189 | |
| 18 k nonbridge | 0.9986 (−8) | 0.9994 (0) | 0.9906 (−88) | 0.9994 | |
| pNPPT2–(50°C) (A2) | 15k | 1.0047 (+20) | 1.0045 (+18) | 1.0099 (+72) | 1.0027 |
| 18 k bridge | 1.0273 (+36) | 1.0246 (+9) | 1.0352 (+115) | 1.0237 | |
| 18 k nonbridge | 1.0005 (−130) | 1.0048 (−87) | 0.9922 (−213) | 1.0135 | |
| pNPP–(95°C) (B) | 15 k | 0.9998 (−6) | 0.9997 (−7) | 0.9996 (−8) | 1.0004 |
| 18 k bridge | 1.0008 (−79) | 1.0004 (−83) | 1.0016 (−71) | 1.0087 | |
| 18 k nonbridge | 1.0117 (−67) | 1.0138 (−46) | 1.0176 (−8) | 1.0184 | |
| pNPPT– (30°C) (B) | 15 k | 1.0001 (−4) | 1.0002 (−3) | 0.9994 (−11) | 1.0005 |
| 18 k bridge | 1.0034 (−57) | 1.0041 (−50) | 1.0019 (−72) | 1.0091 | |
| 18 k nonbridge | 1.0077 (−144) | 1.0100 (−121) | 1.0153 (−68) | 1.0221 | |
| EtOpNPP–(95°C) (C) | 15 k | 1.0016 (+6) | 1.0025 (+15) | 1.0018 (+8) | 1.0010 |
| 18 k bridge | 1.0058 (+16) | 1.0062 (+20) | 1.0052 (+10) | 1.0042 | |
| 18 k nonbridge | 1.0007 (+33) | 1.0010 (+36) | 1.0018 (+44) | 0.9974 | |
| EtOpNPPT–(95°C) (C) | 15 k | 1.0014 (+4) | 1.0019 (+9) | 1.0015 (+5) | 1.0010 |
| 18 k bridge | 1.0033 (+13) | 1.0031 (+11) | 1.0037 (+17) | 1.0020 | |
| 18 k nonbridge | 1.0013 (−6) | 1.0000 (−19) | 1.0005 (−14) | 1.0019 | |
| (EtO)2pNPP(25°C) (D) | 15 k | 1.0010 (+3) | 1.0014 (+7) | 1.0012 (+5) | 1.0007 |
| 18 k bridge | 1.0037 (−23) | 1.0035 (−25) | 1.0033 (−27) | 1.0060 | |
| 18 k nonbridge | 1.0029 (−34) | 1.0020 (−43) | 0.9996 (−67) | 1.0063 | |
| (MeO)2pNPPT(30°C) (D) | 15 k | 1.0008 (+4) | 1.0010 (+6) | 1.0008 (+4) | 1.0004 |
| 18 k bridge | 1.0018 (−27) | 1.0018 (−27) | 1.0020 (−25) | 1.0045 | |
| R | 0.79 | 0.85 | 0.73 | ||
| MSD | −0.0018 | −0.0018 | −0.0018 | ||
| MAD | 0.0033 | 0.0032 | 0.0044 | ||
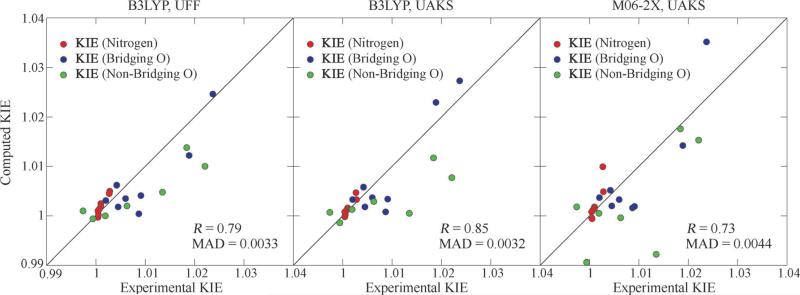
Figure 1.
Correlations between computed KIEs using different methods [B3LYP & UFF (left), B3LYP & UAKS (middle) and M06-2X & UAKS (right)] and experimental KIEs in the 8 phosphate ester hydrolysis reactions. Circles in red, blue and green correspond to 15k, 18kbridge and 18knonbridge, respectively.
In the hydrolysis reactions of monoester dianions (A1 & A2 in Scheme 2), consistent with experiments, we obtain large normal KIEs on the bridging oxygens which suggests extensive cleavage of the phosphorous-bridging oxygen bond in TS. 22,37,38 The KIEs and activation barriers of pNPP2− hydrolysis has previously been investigated using DFT calculations. 39 The authors found excellent agreement with experiment upon inclusion of explicit water molecules in their solvation treatment. 39 We similarly found it necessary to explicitly include a water molecule to locate the transition state, as illustrated in Scheme 2 (A1). The larger 18kbridge value for the pNPPT2− than pNPP2− implies the former reaction has a larger degree of the P-O bond fission. 26,38 The computed KIEs for these two reactions are in good agreement with experimental values in which B3LYP results are more consistent with experiment than M06-2X, while application of UAKS radii improves the correlation to experiment relative to UFF radii (Table 1).
For hydrolysis reactions of monoester monoanions (B in Scheme 2) that occur in acidic conditions, experiments in Ref. 26 suggest an advanced but still incomplete proton transfer from the nonbridging oxygen to the bridging oxygen in the TS, which is supported by the normal 18knonbridge values in our computational results. The 18kbridge values are significantly less normal than in dianionic reactions mainly due to the inverse isotope effect from the formation of the new O-H stretching mode. 26,40 KIE values for these reactions given by the different computational models are all reasonably consistent with experiments (Table 1).
For alkaline hydrolysis of diesters and triesters (C & D in Scheme 2), our calculations reveal an associative mechanism with a tight transition state which agree with various experimental and computational results. 13,19,26,41–44 The less normal 18kbridge values compared to monoester dianionic cases confirm that leaving group bond fission is less advanced. 26 The computed KIEs for all alkaline hydrolysis reactions show, in general, impressive correlation with experimental values.
Overall, both B3LYP and M06-2X functional give reasonable predictions of KIE values, but the B3LYP results are more consistent with experimental data (Figure 1, correlation coefficient 0.85 vs. 0.73, MAD 0.0032 vs. 0.0044). The KIE results using UAKS radii generally outperform those using UFF radii (correlation coefficient 0.85 vs. 0.79). Therefore, we choose to use B3LYP density functional with 6-31++G(d,p) basis set and UAKS atomic radii set for the computational model, which will be applied here after to the studies on RNA transphosphorylation model reactions.
KIEs and LFER in RNA transphosphorylation model reaction series
All of the model reactions studied here are initiated by attack of the 2’-O nucleophile on the phosphoryl group resulting in a pentavalent phosphorane species. There are two associative mechanisms as shown in Scheme 3: a concerted mechanism that passes through a single transition state, and a stepwise mechanism that proceeds via two transition states separated by an intermediate. A concerted mechanism can be classified as synchronous (having similar degrees of bonding to the nucleophile and leaving group in the transition state) or asynchronus (having differing degrees of bonding to the nucleophile and leaving group in the transition state). For either stepwise mechanisms or concerted asynchronus mechanisms, the transition states can be further designated as either “early” or “late”, depending on the location of the transition state along a reaction coordinate ξ that involves the difference in the leaving group (R2) and nucleophile (R1) distances with the reactive phosphorus:
| (1) |
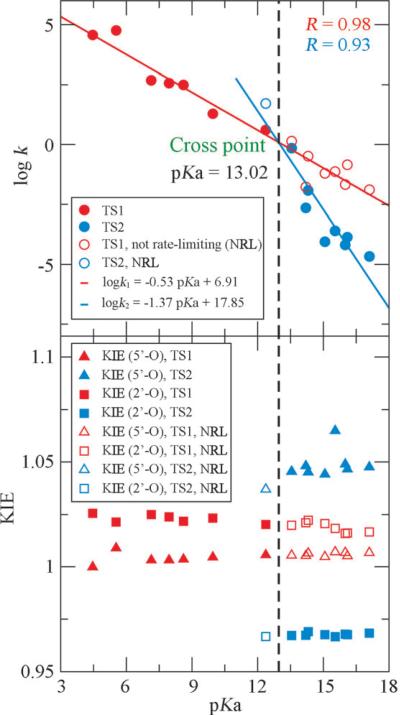
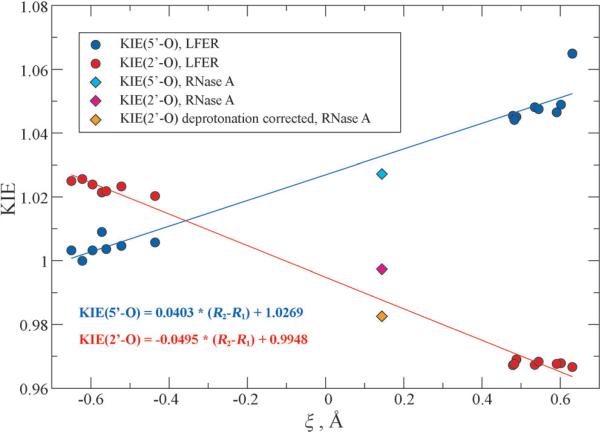
Specifically, we denote a transition state as being “early” ( ξ < 0) if it is characterized by a small degree of bond formation with the nucleophile (large R2 value) and cleavage with the leaving group (small R1 value). Conversely, we denote a transition state as being “late” ( ξ > 0) if it involves a nearly fully formed bond with the nucleophile (small R2 value) and a nearly cleaved bond with the leaving group (large R1 value). Fitting parameters for Pauling's model, 45,46 which relates bond orders and bond lengths by an exponential model, have been established specifically for this reaction series in Ref. 27. Table 2 lists the computed 2’-O and 5’-O KIE values for those reactions as well as the key geometrical information in the rate-limiting TSs and the experimental pKas of the conjugate acid of those 15 different leaving groups. Figure 2 demonstrates the connection between LFER and KIEs in the characterization of the two classes of mechanisms. Figure 3 shows the correlation between the approximate reaction coordinate ξ = R2 − R1 (where in RNA numbering R1 and R2 stand for the P-O2’ and P-O5’ bond lengths, respectively) and the KIE values, which will be addressed again in the later discussion on RNase A enzymatic models.
Figure 2.
(Top) Linear free energy relationships for early (TS1) and late (TS2) transition states in reverse alcoholysis of ethylene phosphate with different leaving groups. log k values are converted from the calculated reaction barrier and pKa is the conjugate acid pKa of the leaving group (data adopted from Ref. 27). The pKa of the cross point can be used to determine whether the rate-limiting TS is early or late. (Bottom) Computed 2’-O and 5’-O KIE values for this set of reactions. Filled and unfilled symbols represent the values obtained from rate-limiting and non-rate-limiting transition states, respectively.
Figure 3.
Relationship between computed 2’-O and 5’-O KIEs and reaction coordinate ξ in the rate-limiting TSs in LFER model reactions and RNase A enzymatic model. The points for RNase A (in diamonds) are excluded in the linear fitting.
As shown in Figure 2, Figure 3 and Table 2, two distinct groups of KIE values for both 2’-O and 5’-O clearly exist, which correspond to the two types of reaction mechanisms in Scheme 3. For the reactants with poor leaving groups (conjugate acids have relatively high pKa values, greater than ≈ 13), significantly large normal 5’-O KIEs (> 1.03) are observed together with the large inverse 2’-O KIEs (< 0.97). These numbers suggest that the P-O2’ bonds are almost fully cleaved in the rate-limiting TSs while the P-O5’ bonds are nearly fully formed. This is also demonstrated by the positive values around 0.55 Å in the rate-limiting TSs (TS2). Early TSs (TS1) can also be located for these reactions but should not be used in the KIE predictions since they are not rate-controlling. 27 Phosphoryl transfer reactions for this type of reactants therefore occur via stepwise mechanisms with late rate-limiting TSs, which agrees with previous experimental and computational studies on closely related systems. 23,24,49 As for those reactants with enhanced leaving groups (conjugate acids have lower pKa values, less than ≈ 13), the 2’-O KIEs are always large normal while the 5’-O KIEs are mostly normal but much closer to unity. This indicates an early rate-limiting TS in which the P-O2’ bond is still forming while the P-O5’ bond remains almost uncleaved, which is again supported by the negative ξ value. The transphosphorylation process is now shifted to a concerted fashion where the late TSs cannot be located for most reactions in this group as a result of the enhanced leaving groups.
In terms of LFER analysis, as seen in Figure 2, two distinct Brønsted coefficients (βlgs) -1.37 and -0.53 were observed for the two groups of reactants with poor and enhanced and leaving groups, respectively. These two coefficients agrees excellently with experimental values reported by Lönnberg, 50 which are -1.34 and -0.52. The βlg value with a much greater magnitude -1.37 for those reactants with poor leaving groups suggests a later rate-limiting TS that involves more P-O5’ bond cleavage motion, which makes the reaction rate more sensitive to the change of the leaving group; 27 the βlg with a small magnitude -0.53 for the reactants with sufficiently enhanced leaving groups indicates a concerted mechanism through a single early TS involving mainly P-O2’ bond formation motion, which reflects a diminished sensitivity of reaction rate to variation of the leaving group. The break point of pKa between the two mechanisms is determined to be 13.02 (see Figure 2). From KIE results, we can observe from Table 2 that the pKa of the break point should fall between 12.37 and 13.55, which coincides very well with the LFER results here and previous reported value 12.58 from Lönnberg. 50 Hence, both the experimental and computational data are consistent with a change in overall mechanism as leaving group reactivity decreases. A direct connection between observed Brønsted coefficients, KIE values and the underlying mechanisms of RNA transphosphorylation reactions is observed, whereby both experimentally observable parameters provide consistent signatures for the stepwise versus concerted reaction channels.
Application to RNase A enzymatic model
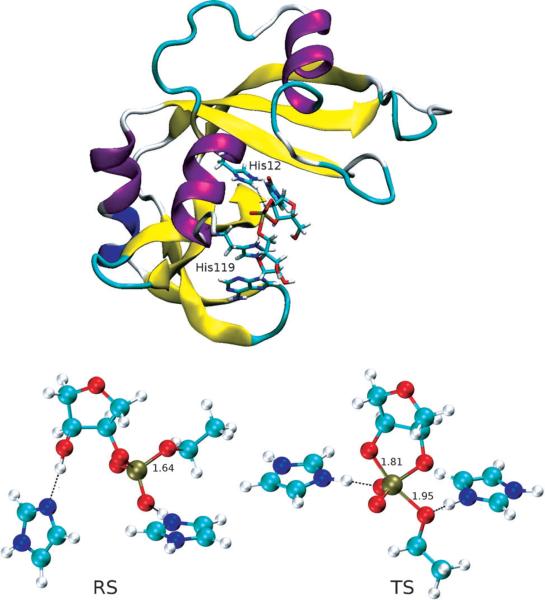
Recently, a combined experimental and theoretical investigation was carried out on the elucidation of RNase A catalytic mechanism. 25 A simplified reaction model was devised in that work to mimic the RNA 2’-O-transphosphorylation in the enzymatic environment, and the 2’-O and 5’-O KIEs were computed and shown to be consistent with the experimentally measured enzymatic KIEs. Here, the above relationship between ξ and KIE values are applied to this model. Optimized RS and TS structures in this model reaction are shown in Figure 4. Although the TS here is still a late one, the 5’-O KIE is less normal than those in the late TSs of LFER series while the 2’-O KIE becomes less inverse, which is well reflected in the more compact TS geometry and less advanced reaction coordinate ξ . Interestingly, computed 2’-O and 5’-O KIEs and ξ values in the rate-limiting TS fall near the fitted lines from the LFER series as shown in Figure 3. We can see that the LFER model can be used at least qualitatively to predict the geometrical details for TSs of more complex reactions.
Figure 4.
(Top) Structure of RNase A transition state mimic, in which His12 stablizes the negative charges on the non-bridging oxygens and His119 acts as a general acid to facilitate P-O5’ bond cleavage. (Bottom) Reactant state (left) and transition state (right) structures in the model reaction. The two imidazole rings in the RS and TS structures are used to mimic His12 (left) and His119 (right). Key bond lengths (in Å) are labeled.
The RNase A data points deviate from the model derived from the specific base-catalyzed nonenzymatic reactions in LFER series for several reasons that provide insight into enzyme mechanism. First, the RSs and TSs in the LFER series are all dianionic, under basic conditions in which the 2’-OH is deprotonated, while the RNase A reaction model was built to mimic ideal enzymatic condition at pH 7 so the 2’-OH remains protonated in the RS. Due to the large normal equilibrium isotope effect (EIE) on alcohol deprotonation (1.015) which offsets the inverse contribution from O-P bond formation, the observed 2’-O KIE value for the RNase A reaction is less inverse compared to reactions in LFER series with oxyanion reactant states 22,26,51 (see Figure 3). Correcting for this difference in reactant states between the RNase A and model reactions yields a value of 0.9826, which more closely corresponds to the predicted relationship between the observed nucleophile KIE and reaction coordinate progress (Figure 3). The presence of ribose sugar ring vibrational modes in the enzymatic model may also result in deviations from the trend interpreted from analyses of simpler intermolecular phosphoryl transfer model reactions. The 5’-O KIE for the enzyme reaction also corresponds in general to the relationship observed for the model reactions, however, the magnitude of this effect is influenced by general acid catalysis that is absent from the specific base catalyzed model reactions. Proton transfer from His119 creates a stiffer bonding environment 25,52–54 for the 5’-O in the TS that leads to a decrease in the 5’-O KIE value, resulting in an overestimation of the observed value by the model. Thus, the KIE signature for RNase A matches expectations for the stepwise mechanism with a late TS draw from comparison to model reactions. Importantly, deviation from predicted values for both the nucleophile and leaving group for the enzyme reaction are attributable primarily to proton transfer, either at equilibrium or in the transition state.
The success of the computational framework described here is best evaluated by the ability to identify and predict KIEs that provide insight into mechanism and, importantly, are amenable to subsequent experimental measurement. Previous studies showed that ionization of alcohols enhances the electron density of the alcohol oxygen, which effectively decreases the Cα-H bond strength due to hyperconjugation resulting in normal secondary deuterium isotope effects. 55–58 Indeed, the secondary deuterium KIE on the 5’ carbon for the model reactions are 1.15-1.2 which is near the EIE for ionization of an aliphatic alcohol (1.15) reflecting advanced leaving group bond cleavage (Table S2). The secondary deuterium effects on the 2’ carbon of the nucleophilic alcohol are observed to be inverse (0.85) reflecting the loss of ionization upon going from an oxyanion to a phosphoester due to advanced O-P bond formation. Interestingly, the secondary deuterium KIEs at the C2’-H and C5’-H are predicted to be 1.0119 and 1.0291, respectively, for the RNase A catalyzed reaction. The significantly smaller leaving group effect provides another KIE signature for the general acid role in RNase A in which the proton transfer from His119 to the 5’-O leaving group largely offsets the accumulation of charge. Although these are secondary KIEs their magnitudes are large relative to primary 18O effects which have been analyzed extensively.
Thus, in addition to the framework for interpretation of primary KIEs and LFER results developed here, we identify secondary deuterium KIEs as an important indicator of transition state charge and provide predicted values useful for future experimental validation.
Conclusion
In this work, we present the results of quantum chemical studies on the KIEs in the phosphate ester hydrolysis reactions, non-enzymatic RNA transphosphorylation model reaction series and enzymatic model that represents RNA backbone cleavage catalyzed by RNase A. Benchmark KIE calculations have been performed on the experimentally well-studied phosphate ester hydrolysis systems to validate the computational methods for prediction of KIEs relevant to phosphoryl transfer in RNA. The method that yielded the most consistent agreement with experiments (B3LYP/6-31++G(d,p) with PCM/UAKS solvation) was identified and then applied to the prediction of KIEs in a model reaction series to establish a relationship between approximate reaction coordinate and 2’-O and 5’-O KIEs. Finally, KIEs in the RNase A catalysis model were computed and shown to be consistent with the trend observed in the LFER series between KIEs and reaction coordinate values. The present work demonstrates how LFER and KIE analysis provide complementary information from different measurements that, together with calculations, provide deep insight into molecular mechanism. The data presented in this work further serves as a useful benchmark and guide to the design and development of next-generation multiscale models for RNA catalysis mechanisms which are of great biological importance.
Supplementary Material
Acknowledgments
The authors are grateful for financial support to D.M.Y. provided by the National Institutes of Health (GM062248), to M.E.H. provided by the National Institute of Health (GM096000) and to K.-Y.W. provided by HK RGC (ECS-209813), NSF of China (NSFC-21303151), HKBU FRG (FRG2/12-13/037) and startup funds (38-40-088 and 40-49-495). Computational resources from the Minnesota Supercomputing Institute for Advanced Computational Research (MSI) and from the High Performance Cluster Computing Centre (HPCCC) and Office of Information Technology (ITO) at HKBU (sciblade and jiraiya) were utilized in this work. This work used the Extreme Science and Engineering Discovery Environment (XSEDE), which is supported by National Science Foundation grant number OCI-1053575.
Footnotes
Supporting Information
The key bond lengths in the transition states of phosphate ester hydrolysis reactions and the computed secondary deuterium isotope effects for LFER reaction series and RNase A model reactions are provided.
References
- 1.Knowles JR. Ann. Rev. Biochem. 1980;49:877–919. doi: 10.1146/annurev.bi.49.070180.004305. [DOI] [PubMed] [Google Scholar]
- 2.Westheimer FH. Science. 1987;235:1173–1178. doi: 10.1126/science.2434996. [DOI] [PubMed] [Google Scholar]
- 3.Cleland WW, Hengge AC. Chem. Rev. 2006;106:3252–3278. doi: 10.1021/cr050287o. [DOI] [PubMed] [Google Scholar]
- 4.Cochrane JC, Strobel SA. Acc. Chem. Res. 2008;41:1027–1035. doi: 10.1021/ar800050c. [DOI] [PubMed] [Google Scholar]
- 5.Kamerlin SCL, Sharma PK, Prasad RB, Warshel AQ. Rev. Biophys. 2013;46:1–132. doi: 10.1017/S0033583512000157. [DOI] [PMC free article] [PubMed] [Google Scholar]
- 6.Scott WG, Murray JB, Arnold JRP, Stoddard BL, Klug A. Science. 1996;274:2065–2069. doi: 10.1126/science.274.5295.2065. [DOI] [PubMed] [Google Scholar]
- 7.Buzayan JM, Gerlach WL, Bruening G. Proc. Natl. Acad. Sci. USA. 1986;83:8859–8862. doi: 10.1073/pnas.83.23.8859. [DOI] [PMC free article] [PubMed] [Google Scholar]
- 8.Sharmeen L, Kuo MY, Dinter-Gottlieb G, Taylor JJ. Virol. 1988;62:2674–2679. doi: 10.1128/jvi.62.8.2674-2679.1988. [DOI] [PMC free article] [PubMed] [Google Scholar]
- 9.Winkler WC, Nahvi A, Roth A, Collins JA, Breaker RR. Nature. 2004;428:281–286. doi: 10.1038/nature02362. [DOI] [PubMed] [Google Scholar]
- 10.Saville BJ, Collins RA. Cell. 1990;61:685–696. doi: 10.1016/0092-8674(90)90480-3. [DOI] [PubMed] [Google Scholar]
- 11.Raines RT. Chem. Rev. 1998;98:1045–1065. doi: 10.1021/cr960427h. [DOI] [PubMed] [Google Scholar]
- 12.Oivanen M, Kuusela S, Lönnberg H. Chem. Rev. 1998;98:961–990. doi: 10.1021/cr960425x. [DOI] [PubMed] [Google Scholar]
- 13.Lassila JK, Zalatan JG, Herschlag D. Annu. Rev. Biochem. 2011;80:669–702. doi: 10.1146/annurev-biochem-060409-092741. [DOI] [PMC free article] [PubMed] [Google Scholar]
- 14.Bronsted JN. Chem. Rev. 1928;5:231–338. [Google Scholar]
- 15.Leffler JE. Science. 1953;117:340–341. doi: 10.1126/science.117.3039.340. [DOI] [PubMed] [Google Scholar]
- 16.Jencks DA, Jencks WP. J. Am. Chem. Soc. 1977;99:7948–7960. [Google Scholar]
- 17.Williams A. Acc. Chem. Res. 1984;17:425–430. [Google Scholar]
- 18.Bourne N, Chrystiuk E, Davis AM, Williams AJ. Am. Chem. Soc. 1988;110:1890–1895. [Google Scholar]
- 19.Onyido I, Swierczek K, Purcell J, Hengge AC. J. Am. Chem. Soc. 2005;127:7703–7711. doi: 10.1021/ja0501565. [DOI] [PubMed] [Google Scholar]
- 20.Hengge AC, Onyido I. Curr. Org. Chem. 2005;9:61–74. [Google Scholar]
- 21.Bigeleisen J, Wolfsberg M. Adv. Chem. Phys. 1958;1:15–76. [Google Scholar]
- 22.Hengge AC. Acc. Chem. Res. 2002;35:105–112. doi: 10.1021/ar000143q. [DOI] [PubMed] [Google Scholar]
- 23.Harris ME, Dai Q, Gu H, Kellerman DL, Piccirilli JA, Anderson VE. J. Am. Chem. Soc. 2010;132:11613–11621. doi: 10.1021/ja103550e. [DOI] [PMC free article] [PubMed] [Google Scholar]
- 24.Wong K-Y, Gu H, Zhang S, Piccirilli JA, Harris ME, York DM. Angew. Chem.Int. Ed. 2012;51:647–651. doi: 10.1002/anie.201104147. [DOI] [PMC free article] [PubMed] [Google Scholar]
- 25.Gu H, Zhang S, Wong K-Y, Radak BK, Dissanayake T, Kellerman DL, Dai Q, Miyagi M, Anderson VE, York DM, Piccirilli JA, Harris ME. Proc. Natl. Acad. Sci. USA. 2013;110:13002–13007. doi: 10.1073/pnas.1215086110. [DOI] [PMC free article] [PubMed] [Google Scholar]
- 26.Catrina IE, Hengge AC. J. Am. Chem. Soc. 2003;125:7546–7552. doi: 10.1021/ja0340026. [DOI] [PubMed] [Google Scholar]
- 27.Huang M, York DM. Phys. Chem. Chem. Phys. 2014;16:15846–15855. doi: 10.1039/c4cp01050g. [DOI] [PMC free article] [PubMed] [Google Scholar]
- 28.Becke AD. J. Chem. Phys. 1993;98:5648–5652. [Google Scholar]
- 29.Lee C, Yang W, Parr RG. Phys. Rev. B. 1988;37:785–789. doi: 10.1103/physrevb.37.785. [DOI] [PubMed] [Google Scholar]
- 30.Zhao Y, Truhlar DG. Theor. Chem. Acc. 2008;120:215–241. [Google Scholar]
- 31.Tomasi J, Mennucci B, Cammi R. Chem. Rev. 2005;105:2999–3093. doi: 10.1021/cr9904009. [DOI] [PubMed] [Google Scholar]
- 32.Scalmani G, Frisch MJ. J. Chem. Phys. 2010;132:114110–114124. doi: 10.1063/1.3359469. [DOI] [PubMed] [Google Scholar]
- 33.Rappé AK, Casewit CJ, Colwell KS, Goddard WA, III, Skiff WM. J. Am. Chem. Soc. 1992;114:10024–10035. [Google Scholar]
- 34.Barone V, Cossi M, Tomasi J. J. Chem. Phys. 1997;107:3210–3221. [Google Scholar]
- 35.Bigeleisen J, Mayer MG. J. Chem. Phys. 1947;15:261–267. [Google Scholar]
- 36.Frisch MJ, Trucks GW, Schlegel HB, Scuseria GE, Robb MA, Cheeseman JR, Scalmani G, Barone V, Mennucci B, Petersson GA, Nakatsuji H, Caricato M, Li X, Hratchian HP, Izmaylov AF, Bloino J, Zheng G, Sonnenberg JL, Hada M, Ehara M, Toyota K, Fukuda R, Hasegawa J, Ishida M, Nakajima T, Honda Y, Ki- tao O, Nakai H, T. V, Montgomery JA, Jr., Peralta JE, Ogliaro F, Bearpark M, Heyd JJ, Brothers E, Kudin KN, Staroverov VN, Kobayashi R, Normand J, Raghavachari K, Rendell A, Burant JC, Iyengar SS, Tomasi J, Cossi M, Rega N, Millam JM, Klene M, Knox JE, Cross JB, Bakken V, Adamo C, Jaramillo J, Gomperts R, Stratmann RE, Yazyev O, Austin AJ, Cammi R, Pomelli C, Ochter- ski JW, Martin RL, Morokuma K, Zakrzewski VG, Voth GA, Salvador P, Dannenberg JJ, Dapprich S, Daniels AD, Farkas O, Foresman JB, Ortiz JV, Cioslowski J, Fox DJ. Gaussian 09, Revision A.02. Gaussian, Inc.; Wallingford, CT: 2009. [Google Scholar]
- 37.Klähn M, Rosta E, Warshel A. J. Am. Chem. Soc. 2006;128:15310–15323. doi: 10.1021/ja065470t. [DOI] [PubMed] [Google Scholar]
- 38.Sorensen-Stowell K, Hengge AC. J. Org. Chem. 2006;71:7180–7184. doi: 10.1021/jo060896b. [DOI] [PMC free article] [PubMed] [Google Scholar]
- 39.Zhang L, Xie D, Xu D, Guo H. Chem. Commun. 2007;16:1638–1640. doi: 10.1039/b617946k. [DOI] [PubMed] [Google Scholar]
- 40.Hengge AC, Hess RA. J. Am. Chem. Soc. 1994;116:11256–11263. [Google Scholar]
- 41.Cassano AG, Anderson VE, Harris ME. J. Am. Chem. Soc. 2002;124:10964–10965. doi: 10.1021/ja020823j. [DOI] [PubMed] [Google Scholar]
- 42.Lopez X, York DM, Dejaegere A, Karplus M. Int. J. Quantum Chem. 2002;86:10–26. [Google Scholar]
- 43.López-Canut V, Ruiz-Pernía J, Tuñón I, Ferrer S, Moliner V. J. Chem. Theory Comput. 2009;5:439–442. doi: 10.1021/ct800470f. [DOI] [PubMed] [Google Scholar]
- 44.Hou G, Cui Q. J. Am. Chem. Soc. 2012;134:229–246. doi: 10.1021/ja205226d. [DOI] [PMC free article] [PubMed] [Google Scholar]
- 45.Pauling L. J. Am. Chem. Soc. 1947;69:542–553. [Google Scholar]
- 46.Houk KN, Gustafson SM, Black KA. J. Am. Chem. Soc. 1992;114:8565–8572. [Google Scholar]
- 47.Serjeant EP, Dempsey B. Ionisation Constants of Organic Acids in Aqueous Solution. Pergamon Press; New York: 1979. [Google Scholar]
- 48.Lide DR, editor. CRC handbook of chemistry and physics. 90th ed. CRC Press LLC; Boca Raton, FL: 2010. [Google Scholar]
- 49.Wong K-Y, Xu Y, York DM. J. Comput. Chem. 2014;35:1302–1316. doi: 10.1002/jcc.23628. [DOI] [PMC free article] [PubMed] [Google Scholar]
- 50.Lönnberg H, Strömberg R, Williams A. Org. Biomol. Chem. 2004;2:2165–2167. doi: 10.1039/b406926a. [DOI] [PubMed] [Google Scholar]
- 51.Liu Y, Gregersen BA, Hengge A, York DM. Biochemistry. 2006;45:10043–10053. doi: 10.1021/bi060869f. [DOI] [PubMed] [Google Scholar]
- 52.Herschlag D. J. Am. Chem. Soc. 1994;116:11631–11635. [Google Scholar]
- 53.Leclerc F. Molecules. 2010;15:5389–5407. doi: 10.3390/molecules15085389. [DOI] [PMC free article] [PubMed] [Google Scholar]
- 54.Formoso E, Matxain JM, Lopez X, York DM. J. Phys. Chem. B. 2010;114:7371–7382. doi: 10.1021/jp909004y. [DOI] [PMC free article] [PubMed] [Google Scholar]
- 55.Gawlita E, Lantz M, Paneth P, Bell AF, Tonge PJ, Anderson VE. J. Am. Chem. Soc. 2000;122:11660–11669. [Google Scholar]
- 56.Jarmelo S, Maiti N, Anderson V, Carey PR, Fausto R. J. Phys. Chem. A. 2005;109:2069–2077. doi: 10.1021/jp046683c. [DOI] [PubMed] [Google Scholar]
- 57.Maiti NC, Zhu Y, Carmichael I, Serianni AS, Anderson VE. J. Org. Chem. 2006;71:2878–2880. doi: 10.1021/jo052389k. [DOI] [PubMed] [Google Scholar]
- 58.Pal U, Sen S, Maiti NC. J. Phys. Chem. A. 2014;118:1024–1030. doi: 10.1021/jp411488a. [DOI] [PubMed] [Google Scholar]
Associated Data
This section collects any data citations, data availability statements, or supplementary materials included in this article.


