

Abstract
The Gram-negative intracellular bacterium Salmonella enterica serovar Typhimurium causes persistent systemic inflammatory disease in immunocompetent mice. Following oral inoculation with S. Typhimurium, mice develop a hematopathological syndrome akin to typhoid fever with splenomegaly, microcytic anemia, extramedullary erythropoiesis, and increased hemophagocytic macrophages in the bone marrow, liver, and spleen. Additionally, there is marked loss of iron from the spleen, an unanticipated result, given the iron sequestration reported in anemia of inflammatory disease. To establish why tissue iron does not accumulate, we evaluated multiple measures of pathology for 4 weeks following oral infection in mice. We demonstrate a quantitative decrease in splenic iron following infection despite increased numbers of splenic phagocytes. Infected mice have increased duodenal expression of the iron exporter ferroportin-1, consistent with increased uptake of dietary iron. Liver and splenic macrophages also express high levels of ferroportin-1. These observations indicate that splenic and hepatic macrophages export iron during S. Typhimurium infection, in contrast to macrophage iron sequestration observed in anemia of inflammatory disease. Tissue macrophage export of iron occurs concurrent with high serum concentrations of interferon gamma (IFN-γ) and interleukin 12 (IL-12). In individual mice, high concentrations of both proinflammatory (tumor necrosis factor alpha [TNF-α]) and anti-inflammatory (IL-10) cytokines in serum correlate with increased tissue bacterial loads throughout 4 weeks of infection. These in vivo observations are consistent with previous cell culture studies and suggest that the relocation of iron from tissue macrophages during infection may contribute to anemia and also to host survival of acute S. Typhimurium infection.
INTRODUCTION
Typhoid fever is acquired upon oral ingestion of food or water contaminated with Salmonella enterica serovar Typhi or Paratyphi and remains a serious threat to public health, especially in developing countries (1). Human typhoid fever causes a broad range of clinical signs, including splenomegaly, neuropathy, and hematopathology, such as cytopenias (2), that have been modeled in laboratory mice infected with Salmonella enterica serovar Typhimurium (3). Inbred mouse strains with differing genetic backgrounds are characterized as either sensitive or resistant to S. Typhimurium. Sensitivity to the intracellular bacterial infection is caused by genetic deficiencies in the innate or adaptive immune system (4, 5). For instance, mice lacking the cation transporter Nramp1 (Slc11a1), a regulator of cellular iron metabolism, are extremely sensitive to infection. Nramp1+ mice are considered resistant to S. Typhimurium, because infection is generally nonfatal (6–8). Resistant mice infected by natural oral inoculation develop systemic infection with an acute hematopathological syndrome similar to that of humans with typhoid fever, including fever, anemia, inflammatory disease characterized by peripheral blood neutrophilia and monocytosis, bone marrow myeloid hyperplasia and hemophagocytosis, and splenomegaly secondary to extramedullary hematopoiesis (EMH) and phagocyte infiltration (7, 8). The bacteria reside within tissue macrophages (6, 9) and hemophagocytic macrophages (10, 56), which have phagocytosed intact erythrocytes and leukocytes. Recently, it has been observed that S. Typhimurium acquires iron from hemophagocytes (11).
During inflammation, macrophages typically sequester iron, a process that reduces iron availability in serum (12). Macrophage sequestration of iron is a form of “nutritional immunity,” because most bacteria require iron to replicate (13–15). However, infections with intracellular pathogens, such as S. Typhimurium and Mycobacterium tuberculosis, appear to represent a special case. For instance, cell culture macrophages infected with S. Typhimurium restrict pathogen iron access by increasing expression of the iron transporter ferroportin-1 (Fpn1) (16, 17). Fpn1 is the only known eukaryotic cellular iron exporter (18) and, as such, is a major contributor to host iron regulation. Fpn1 expression is induced by nitric oxide, which in turn is induced by the proinflammatory cytokines interferon gamma (IFN-γ) (19) and tumor necrosis factor alpha (TNF-α) (20). In cell culture, IFN-γ treatment of S. Typhimurium-infected macrophage-like cells increases Fpn1 expression while reducing the cellular iron content and inhibiting bacterial replication (16). Further experiments have shown Fpn1-mediated control of intracellular S. Typhimurium growth in cultured murine macrophages and HeLa cells (21). However, the relationship of these cellular observations to in vivo pathology is not known.
We previously demonstrated that during the acute-phase response to inflammation, resistant (Nramp1+) mice infected with S. Typhimurium by the natural oral route develop decreased serum iron, increased serum ferritin, and increased hemophagocytosis in bone marrow, liver, and spleen. Infected mice develop microcytic anemia that is most severe 1 to 3 weeks postinfection and persistent for 9 weeks, along with erythrocyte fragmentation and severely diminished tissue iron staining from 1 to 6 weeks postinfection (7, 8). These hematopathological findings are characteristic features of systemic iron deficiency (22). The observation of decreased tissue iron in infected, anemic mice in the face of marked inflammatory disease was unexpected based on the well-described macrophage iron sequestration that occurs with anemia of inflammatory (or chronic) disease (AID) (23). Our aim was to quantitate and establish mechanisms by which tissue iron declines in mice infected with the intracellular pathogen S. Typhimurium by monitoring measures of iron metabolism, cellular infiltrates, and cytokine responses over an infection course that is acute to subacute (between acute and chronic in character).
MATERIALS AND METHODS
Bacterial cultures.
Freshly struck colonies of virulent S. Typhimurium strain SL1344 (Strr) (24), inoculated into Luria-Bertani broth with streptomycin (200 mg/ml), were grown at 37°C with aeration overnight. The bacteria were pelleted and resuspended in sterile phosphate-buffered saline (PBS).
Animals.
The research protocols were in accordance with the NIH Guide for the Care and Use of Laboratory Animals and approved by the University of Colorado Institutional Biosafety and Animal Care and Use Committees. Seven- to 8-week-old Sv129S6/SvEvTac (Sv129) female and male mice (Taconic Farms, Inc., Hudson, NY) were bred in-house. The mice received 2918 Teklad Global 18% Protein Rodent Diet (Harlan Laboratories). This chow contains iron at 200 ppm, well above the minimum daily requirement (35 ppm [25]) but below what is considered a high-iron diet (300 ppm [26]). The mice were fasted for 2 to 4 h prior to infection via oral gavage with 1 × 10⁹ CFU S. Typhimurium in 100 μl PBS, as determined by plating. Control mice were mock infected with 100 μl PBS and housed separately. Mice were euthanized and evaluated at 1, 2, 3, and 4 weeks postinfection (repeated experiments). The numbers of animals are indicated in the figure legends.
Blood and tissue collection and processing.
Blood was collected by cardiocentesis immediately following carbon dioxide asphyxiation. Following euthanasia, the whole spleen and liver were weighed, and a section of each was weighed, homogenized, and plated for bacterial CFU per gram of tissue. No CFU were found in any mock-infected animals. The remaining liver and spleen tissue and one femur were collected into 10% neutral buffered formalin. Bone marrow brush preparations, made immediately postmortem from the second femur, were Wright stained for cytological evaluation. The tissues were processed by routine histological methods; paraffin sections were stained with hematoxylin and eosin (H&E) and Perl's Prussian blue for ferric iron (hemosiderin). The intensity of iron tissue staining was subjectively scored in a blinded fashion by a board-certified veterinary pathologist (D.E.B.), using a scale of 0 to 4+, by light microscopy. All photomicrographs were taken with an Olympus BX50 (Olympus Corporation, Center Valley, PA) using QImagingMicroPublisher RTV 5.0 (JH Technologies, Fremont, CA).
Immunohistochemistry.
All tissue sections for immunohistochemistry were formalin fixed, paraffin embedded, sectioned at 3 μm, baked at 60°C for 1 h, deparaffinized and rehydrated, pretreated with proteinase K for antigenic retrieval, and then treated specifically as described below for each antibody. All sections were reviewed in a blinded fashion by a board-certified veterinary pathologist (D.E.B.).
Fpn1/Prussian blue.
To quench endogenous peroxidase activity, sections were treated with 3.0% hydrogen peroxide solution for 5 min at room temperature (RT). Enzymatic pretreatment with proteinase K (Dako; S3020) for 5 min at RT was used for antigenic retrieval. Serum Free Protein Block (Dako; X0909) was used at 5 min at RT to neutralize any charged molecules on the tissue sections that might cause nonspecific staining. Rabbit anti-mouse Fpn1 antibody (Life Span Biosciences; LS-C16620) was prepared at a working dilution of 0.02 mg/ml by diluting the stock solution in antibody diluent (Dako; S0809). Fpn1 antibody was incubated on tissue sections for 30 min at RT. A negative control was incubated with rabbit IgG isotype solution (Calbiochem; NI01) at a concentration of 0.02 mg/ml for the same duration and at the same temperature as the primary antibody. The Fpn1 antibody was then conjugated with an Envision plus horseradish peroxidase rabbit polymer (Dako; K4003) for 30 min at RT. Staining was developed with a DAB+ chromogen system (Dako; K3468) for 5 min at RT. The detection of ferric iron was accomplished by following a routine Prussian blue histological staining method. The Prussian blue working solution was prepared by mixing equal parts 2.0% hydrochloric acid and 2.0% potassium ferrocyanide and then preheated to 60°C. The slides were incubated in the Prussian blue working solution for 30 min at 60°C. The slides were finally counterstained in nuclear fast red for 5 min at RT.
F4/80 antibody.
To quench endogenous alkaline phosphatase activity, the tissue sections were treated with a Dual Endogenous Enzyme Block solution (Dako; S2003) for 10 min at RT. Enzymatic pretreatment with proteinase K (Dako; S3020) for 5 min at RT was used for antigenic retrieval. Serum Free Protein Block (Dako; X0909) was used at 5 min at RT to neutralize any charged molecules on the tissue sections that might cause nonspecific staining. Rat anti-mouse F4/80 antibody (Serotec; MCA497) was prepared at a working dilution of 1:300 by diluting the stock solution in antibody diluent (Dako; S0809). The F4/80 antibody was incubated on tissue sections for 30 min at RT. The negative-control section was incubated with rat IgG2b isotype solution (Serotec; MCA1125) for the same duration and at the same concentration and temperature as the primary antibody (approximately 0.166 μg/ml). The F4/80 antibody was then conjugated with biotinylated rabbit anti-rat immunoglobulin (Dako; E0468) for 30 min at RT. The secondary antibody was then enhanced with an anti-rabbit-alkaline phosphatase-labeled polymer (BioCare Medical; RALP525L) for 30 min at RT. Staining was developed with a red chromogen system (BioCare Medical; FR805S) for 10 min at RT. Counterstaining was performed with hematoxylin for 10 min at RT. The positive-control tissue used was a mouse tissue xenograft injected with a human HT-29 tumor cell line (data not shown).
NOS2/iNOS.
Anti-nitric oxide synthase 2/inducible nitric oxide synthase (anti-NOS2/iNOS) (1:100; Abcam, Cambridge, MA) and controls were run in parallel and included secondary-only serum and isotype serum (rabbit IgG; Santa Cruz Biotechnology, Santa Cruz, CA). Slides were blocked in donkey serum in PBS-Triton X for 45 min, incubated with primary antibodies diluted in PBS overnight at 4°C, washed with PBS, incubated with donkey anti-rabbit Alexa Fluor 594 (Invitrogen, Grand Island, NY) for 30 min at 37°C in the dark, and then coverslipped with Vectashield mounting medium with DAPI (4′,6-diamidino-2-phenylindole) (Vector Laboratories, Inc., Burlingame, CA). All sections were photographed at ×400 magnification (40× objective) using identical exposure times.
Real-time reverse transcription-PCR.
Spleens and livers were harvested from mock- or S. Typhimurium-infected mice at 1 and 3 weeks postinfection. A portion of each was weighed, placed into ≥10 μl of RNAlater (Qiagen) per 1 mg of tissue, and stored at −80°C until subsequent isolation of total RNA using the RNeasy Midi kit (Qiagen), including on-column DNase treatment, according to the manufacturer's instructions. First-strand cDNA was synthesized from 250 ng of total RNA using the iScript cDNA synthesis kit [Bio-Rad; 170-8891; a blend of oligo(dT) and random hexamers] according to the manufacturer's protocol. The cDNA was subsequently diluted 4-fold (Nos2) or 20-fold (hepcidin and Fpn1) with nuclease-free water. TaqMan quantitative reverse transcription (qRT)-PCR assays were carried out using the following predesigned primer-probe sets: Hprt (VIC-MGB probe; primer limited; Invitrogen 4448484; assay identifier [ID], Mm00446968_m1), hepcidin (Hamp1; Invitrogen 4331182; assay ID, Mm04231240_s1; detects Hamp1 only), Fpn1 (6-carboxyfluorescein [FAM]-MGB probe; Invitrogen 4331182; assay ID, Mm01254822_m1), and Nos2 (FAM-MGB probe; Invitrogen 4331182; assay ID, Mm00440502_m1). The selection of Hprt for normalization was based on validation experiments, which determined that splenic and hepatic Hprt expression levels were not significantly different for mock versus infected mice. The qRT-PCR mixtures (20 μl) contained 8 μl of 4- or 20-fold-diluted cDNA, 10 μl of TaqMan Universal PCR master mix II with uracil N-glycosylase (UNG) (Invitrogen; 4440038), 1 μl of Hprt primer-probe, and 1 μl target gene primer-probe or water. Hamp1 and Fpn1 expression assays were multiplexed with Hprt, while Nos2 expression assays were singleplexed due to interference between the Nos2 and Hprt primer-probe sets, as determined by validation and optimization experiments. Reactions were run on a CFX384 real-time PCR detection system (Bio-Rad) under the following cycling conditions: 2 min at 50°C, 10 min at 95°C, and then 45 cycles at 95°C for 15 s and 60°C for 60 s. No-RNA and no-reverse transcriptase controls were included for each gene assayed. Amplification results were baseline and drift corrected using CFX Manager software (Bio-Rad), followed by manual adjustment of the quantification cycle (Cq) threshold for each fluorophore. The data were then exported to Microsoft Excel for further analysis. The relative gene expression was determined according to the Livak and Schmittgen method (27) as follows: (i) Fpn1, Nos2, and Hamp1 expression for each sample were normalized to that of Hprt (ΔCT); (ii) on a tissue- and time point-specific basis, the mean of the target gene ΔCTs of the control mouse group was set as the calibrator for calculation of the ΔΔCT values for each sample; (iii) the fold difference in target gene expression for each sample was then calculated using the 2−ΔΔCT equation. Reaction efficiencies for each primer-probe set were assessed by performing real-time PCR on serial 10-fold dilutions of cDNA, plotting the threshold cycle (CT) values for each dilution against the log of the input concentration, and determining the efficiency using the following equation: efficiency = −1 + 10(−1/slope). Statistical analysis of the mean fold changes between groups of mock-infected and infected mice was carried out using one-way analysis of variance (ANOVA), followed by Tukey's multiple-comparison test (GraphPad Prism version 5.00).
Flow cytometry.
Portions of spleens were mechanically homogenized and passed through a 70-μm cell strainer. Nonnucleated erythrocytes in aliquots of each suspension were lysed in hypotonic buffer containing 0.16 M NH4Cl, 10 mM KHCO3, and 0.1 mM EDTA, and the remaining cells were then counted on a hemocytometer to estimate the number of nucleated cells per spleen. Additional aliquots were lysed in PBS with 0.2% NP-40 and plated for bacterial CFU. The unlysed cells were washed in RPMI, passed through a 40-μm cell strainer, and resuspended in staining buffer (PBS plus 1% fetal bovine serum and 0.02% sodium azide) containing anti-mouse CD16/32 (eBioscience, San Diego, CA) to block Fc receptors. The cells were then stained with phycoerythrin-conjugated anti-mouse CD68 (AbDSerotec, Raleigh, NC), allophycocyanin-conjugated anti-mouse CD11c (eBioscience, San Diego, CA), and phycoerythrin-Cy7-conjugated anti-mouse Gr-1 (Ly-6G; eBioscience, San Diego, CA); fixed in 1% paraformaldehyde-1% sucrose; permeabilized in 0.1% saponin; and stained for DNA in 10 μg/ml DAPI in buffer containing 0.1% saponin. Fluorescently labeled cells were quantified using a CyAn ADP flow cytometer (Beckman Coulter, Indianapolis, IN) and analyzed using FlowJo software (Tree Star, Ashland, OR). Macrophages were identified as CD68+, CD11clow/− (αX integrin, a dendritic cell marker), and Gr-1int/− (a monocyte and granulocyte/neutrophil marker). Dendritic cells were identified as CD11chigh, neutrophils as Gr-1high, and monocytes as Gr-1int, CD11clow/−, and CD68− (28). The numbers of granulocytes, monocytes, macrophages, and dendritic cells per spleen were calculated as follows: (number of flow-identified cells) × [(number of nucleated cells per spleen)/(total number of nucleated cells per flow sample)]. The number of total nucleated cells per flow sample was established based on cell size (forward scatter) and DAPI content.
Serum cytokines.
Serum cytokine concentrations were analyzed using kits from MesoScale Discovery (Gaithersburg, MD), including Mouse TH1/TH2 9-Plex and Mouse MCP-1 Ultra-Sensitive. The serum cytokine concentrations assayed included IFN-γ, interleukin 1β (IL-1β), IL-2, IL-4, IL-5, KC/GRO, IL-10, IL-12, and TNF-α. Analyses were performed as recommended by the manufacturer, and standard curves, run in parallel, were used to interpolate the concentration (picograms per milliliter) of each analyte. Standards for the cytokine and MCP-1 kits were run in duplicate. The plates for all the kits were incubated, washed, and then scanned on a Sector Imager 2400 (MesoScale Discovery, Gaithersburg, MD), and the data were analyzed using Discovery Workbench (3.0) software (MesoScale Discovery). The lower level of detection was calculated as 2.5 standard deviations above the signal for the zero calibrator; the upper level was set to the highest calibrator (10,000 pg/ml). An extended standard curve on a subsequent run was used to detect levels of cytokines above the original high calibrator (up to 40,000 pg/ml).
Splenic-iron analysis.
At weeks 1 to 4 postinfection, spleens were collected from infected and control mice and homogenized. The total nonheme iron was quantified using a spectrophotometric iron assay kit (BioVision, Mountain View, CA) according to the manufacturer's directions. To quantify iron, samples were treated with a reducing agent prior to incubation with Ferene S (Sigma-Aldrich, St. Louis, MO). The optical density at 593 nm (OD593) was measured after 1 h with a Synergy 2 microplate reader (Biotek, Winooski, VT). A standard curve was routinely established (0 to 10 nmol of iron).
Statistics.
One-way ANOVA with Tukey's post hoc test and Student's t test were performed (GraphPad Software, Inc., La Jolla, CA), and the results were considered significant at a P value of <0.05. Spearman's rank correlation coefficient was used for cytokine-CFU comparisons; correlations range from 1.0 to −1.0, where zero is no correlation.
RESULTS
Quantification of reduced splenic iron in infected mice.
The spleen is the predominant site for iron storage in mice (29, 30), and splenic iron is stored in tissue macrophages (30). We previously reported reduced tissue iron histochemical staining in resistant (Sv129S6 and C57/BL6 Nramp1G169) mice infected with S. Typhimurium that became acutely anemic; Prussian blue staining of ferric iron in the spleen was scored at 3 to 4+ (on a scale of 0 to 4) in red pulp reticuloendothelial cells of control mice compared to 0 to 1+ in infected mice (7, 8). While infection with S. Typhimurium causes mice to become anemic, the apparent decrease in tissue iron differs from classic AID (23). To confirm and quantify this observation, total splenic nonheme iron was measured at 1 and 3 weeks postinfection in resistant mice. Total splenic nonheme iron decreased in infected animals by greater than 60% on average compared with control spleens (Fig. 1). Thus, the histochemical findings and biochemical measurements of splenic iron are consistent and indicate markedly reduced splenic iron from 1 to 3 weeks following oral infection of Sv129S6 mice with S. Typhimurium.
FIG 1.
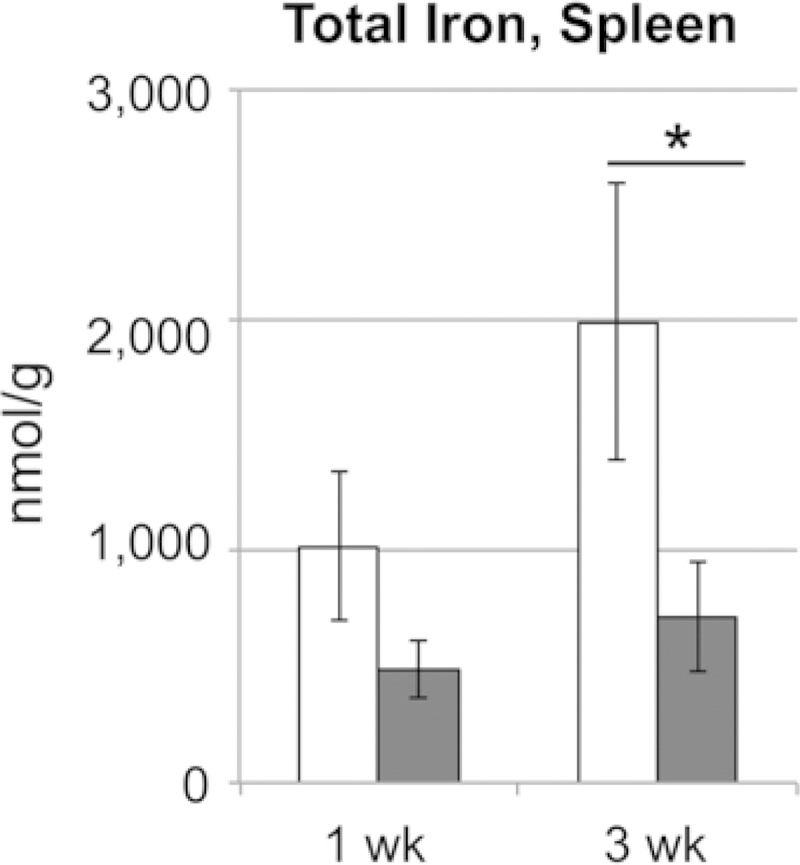
Total splenic nonheme iron is markedly decreased 1 and 3 weeks after oral infection with S. enterica serovar Typhimurium in Sv129S6 mice. Shown are control (white) and infected (gray) mice at 1 and 3 weeks postinfection; n = 13 at each time point for each condition. Means and standard errors of the mean (SEM) are shown. *, P < 0.05; one-way ANOVA with Tukey's post hoc test.
Reduced splenic iron despite increased numbers of splenic macrophages.
Splenic macrophages are the major iron storage site in mice (30). To establish whether the finding of decreased splenic iron in infected mice reflected decreased numbers of splenic macrophages, we quantified phagocytes in the spleen by flow cytometry with cell-type-specific markers. Splenic phagocyte infiltration during the first 4 weeks postinfection was demonstrated by accumulation of macrophages (CD68+ CD11clow/− Gr-1int/−), dendritic cells (CD11chigh), neutrophils (Gr1high), and inflammatory monocytes (Gr-1int CD11clow/− CD68−) concurrent with splenic bacterial colonization (Fig. 2) and splenomegaly. S. Typhimurium-infected mice had at least 2-fold more macrophages than control mice at each of the 4 weeks examined. Also, S. Typhimurium-infected mice had approximately twice as many macrophages as dendritic cells at all time points. Immunohistochemical analyses further demonstrated increased numbers of F4/80+ cells (macrophages) (31) in the splenic red pulp and enlarged F4/80+ Kupffer cells, including hemophagocytic macrophages, in hepatic sinusoids (Fig. 3) and within inflammatory lesions (data not shown). Taken together, the flow cytometric and immunohistochemical analyses demonstrate marked increases in splenic phagocytes of 2- to 3-fold relative to controls for 1 to 4 weeks postinfection. These data are consistent with previous observations (32, 33) and indicate that decreased splenic iron upon infection is not caused by decreased numbers of tissue macrophages.
FIG 2.

Increased phagocytes in the spleens of Sv129S6 mice 1 to 4 weeks after oral infection with S. enterica serovar Typhimurium. Shown are the numbers of neutrophils (Gr-1high), monocytes (Gr-1int CD11clow/− CD68−), macrophages (CD68+ CD11clow/− Gr-1int/−), and dendritic cells (CD11chigh) at the indicated weeks postinfection. *, P < 0.001; +, P < 0.05; Student's t test. Means and SEM are shown; n = 11 or 12 infected mice (gray bars), except for monocytes (n = 5 or 6); n = 4 control mice (white bars), except for monocytes (n = 2 for weeks 1, 2, and 4 and n = 1 for week 3). The numbers of CFU per gram of spleen (medians and ranges) show splenic bacterial loads over time. All control mice had no detectable CFU.
FIG 3.

Infiltration of F4/80-positive (red) macrophages in livers and spleens of Sv129S6 mice after oral infection with S. enterica serovar Typhimurium. (A) Control mouse liver. (B) Increased F4/80-positive (red) liver sinusoidal macrophages (Kupffer cells) at 3 weeks postinfection (original magnification, ×50). Note the F4/80-positive sinusoidal hemophagocytic macrophage (arrow) in the infected liver. (C) Control mouse spleen. (D) Expansion of macrophage-rich splenic red pulp (RP) and loss of lymphoid follicular architecture postinfection; original magnification, ×20.
Increased Fpn1 expression in splenic and hepatic macrophages.
Macrophages of the reticuloendothelial system express the iron exporter Fpn1 to regulate cellular iron levels (18, 30). To establish whether increased Fpn1 expression by tissue macrophages could suggest a mechanism by which tissue iron is decreased following infection, we performed Fpn1 immunohistochemistry on the spleens and livers of infected and control mice. Splenic and hepatic (Kupffer cell) macrophages of infected mice showed greater expression of Fpn1 than macrophages of control mice, and costaining with Prussian blue for ferric iron demonstrated concurrent loss of cellular iron staining in hepatic and splenic macrophages in infected mice (Fig. 4). Analysis by qRT-PCR at 1 and 3 weeks postinfection revealed no significant differences for infected versus control Fpn1 mRNA in the liver or spleen (Fig. 5), possibly because qRT-PCR reflects bulk tissue levels. Liver hepcidin (Hamp1) mRNA levels did not differ between control and infected mice but decreased between 1 and 3 weeks postinfection. Hepcidin is a negative regulator of Fpn1 protein (34). NOS2/iNOS expression increased at the protein and RNA levels and was demonstrated in liver sinusoidal (Kupffer) cells and splenic inflammatory foci of infected mice (Fig. 4 and 5). Nitric oxide, a product of NOS2 activity, is an activator of Fpn1 expression in macrophages (35) and inhibits S. Typhimurium replication (36). Thus, increased Fpn1 expression and iron export from splenic and hepatic macrophages may cause or contribute to the decreased iron observed in these tissues upon infection with S. Typhimurium.
FIG 4.

Increased Fpn1 (brown) expression concurrent with decreased hepatic and splenic iron staining (blue) in anemic Sv129S6 mice after oral infection with S. enterica serovar Typhimurium. (A) Control mouse liver showing iron (blue) within an Fpn1-expressing sinusoidal Kupffer cell. (B) Increased Fpn1 expression in liver Kupffer cells (sinusoidal macrophages) from a mouse at 3 weeks postinfection. (C) Isotype control. (D) Control mouse spleen demonstrating splenic red pulp iron staining (blue) with virtually no Fpn1 (brown) expression. (E) Increased Fpn1 expression in splenic red pulp macrophages and concurrent loss of splenic red pulp macrophage iron staining 3 weeks postinfection. (F) Isotype control with Fpn1 (brown) and Prussian blue (for ferric iron) costaining; original magnification, ×50. Shown is increased intralesional NOS2 expression in spleens and livers of Sv129S6 mice following oral infection with S. enterica serovar Typhimurium. (G) Control mouse liver. (H) NOS2 expression in liver sinusoidal macrophages (Kupffer cells) 3 weeks postinfection. (I) Isotype control. (J) Control mouse spleen. (K) NOS2 expression within splenic red pulp inflammatory lesion postinfection. (L) Isotype control. NOS2 expression was visualized by Alexa-Fluor 594 (red) staining compared with no detectable expression in controls (G and J) and isotype controls (I and L). Exposure times were identical; original magnification, ×40. Arrows identify NOS2+ cells.
FIG 5.

Effects of S. enterica serovar Typhimurium infection on ferroportin-1 (Fpn1), Nos2, and hepcidin (Hamp1) mRNA expression in the livers and spleens of mice. Total RNA was isolated from the livers and spleens of control (white bars) and infected (gray bars) Sv129S6 mice at 1 and 3 weeks after oral infection, and the levels of Fpn1, Nos2, and Hamp1 mRNA were assayed using real-time reverse transcription-PCR (TaqMan). The Fpn1, Nos2, and Hamp1 expression results for each sample were normalized to those of the internal control, Hprt. The fold change in target gene expression for each mouse was then calculated relative to the mean of the normalized expression level for the respective control mouse group (2−ΔΔCT method). Means and SEM are shown; n = 3 or 4 control mice for each time point; n = 5 infected mice for each time point. +, P < 0.05; *, P < 0.001; one-way ANOVA with Tukey's post hoc test.
Reduced splenic iron is not indicative of decreased iron absorption in the intestine.
Decreased iron in tissues during infection with S. Typhimurium could also result from decreased uptake of dietary iron in the intestine combined with the normal daily loss of iron through enterocyte sloughing. One measure of dietary iron uptake is Fpn1 expression by enterocytes. Dietary ferric iron is converted to ferrous iron at the apical surfaces of enterocytes, and ferrous iron is transcytosed and exported into the blood by Fpn1. Decreased enterocyte expression of Fpn1 increases enterocyte iron accumulation by reducing iron export into the blood when body stores are adequate, for example (37). Fpn1 expression was investigated by immunohistochemistry in duodenal tissues of S. Typhimurium-infected mice. Duodenal villi were edematous and blunted postinfection (Fig. 6), consistent with prior reported intestinal pathology in infected mice (38). Fpn1 expression was increased in duodenal villi of infected mice relative to control animals (Fig. 6), an expression pattern expected in response to iron deficiency, not overload (37, 39). Consistent with reported intestinal expression of Fpn1 in mice with inflammatory disease (30), Fpn1 expression was observed to be redistributed to the basolateral membranes of villous enterocytes (Fig. 6B). In addition, costaining of the duodenum with Prussian blue demonstrated a concurrent loss of duodenal enterocyte staining for ferric iron (Fig. 6). Thus, increased duodenal enterocyte expression of Fpn1 is consistent with enterocyte transport of iron into the lamina propria and thus increased, not decreased, host absorption of iron. Moreover, reduced iron in the spleens of S. Typhimurium-infected mice is not explained by reduced host intestinal iron absorption.
FIG 6.

Increased Fpn1 (brown) expression concurrent with decreased duodenal enterocyte iron (blue) staining in Sv129S6 mice after oral infection with S. enterica serovar Typhimurium. (A) Control mouse duodenum demonstrating the presence of enterocyte iron (blue). (B) Increased and basolateral (arrows) Fpn1 expression in blunted duodenal villus and concurrent loss of duodenal enterocyte iron staining 3 weeks postinfection. (C) Isotype control (without Prussian blue counterstain) showing Fpn1 (brown) and Prussian blue (ferric iron; blue) costaining; original magnification, ×50.
Proinflammatory serum cytokines spike during the first week of infection and remain increased for the next 3 weeks.
We examined serum cytokine profiles of infected and control mice over 4 weeks postinfection (Fig. 7) to establish whether proinflammatory cytokines may contribute to the observed decrease in tissue iron and increase in Fpn1 expression in Sv129S6 mice. During the first week postinfection, the mice had increased concentrations of the proinflammatory cytokines IFN-γ, IL-12, IL-2, and IL-1β in serum. IFN-γ remained 100- to 1,000-fold higher on average in infected than in control mice for 4 weeks. Serum IL-12 was high during the first week postinfection and climbed even higher for the next 3 weeks, consistent with sustained serum IFN-γ concentrations (40). Extremely high concentrations of the chemokines CXCL-1 and MCP-1, which, respectively, recruit tissue neutrophils and monocytes (Fig. 7), were observed in serum and were highest during the acute stage of infection. IL-4 was high early in infection and further increased by 3 weeks postinfection, consistent with a subacute, alternative activation state in select macrophage populations (41, 42), including hemophagocytes (28). Thus, Salmonella-infected mice have a particularly strong proinflammatory response at 1 week postinfection that declines but remains significantly higher than that of control mice over the subsequent 3 weeks. The high and sustained levels of IFN-γ, in particular, are consistent with the increased tissue macrophage expression of Fpn1 (16, 35), resulting in iron export and loss of iron storage in the spleen and liver.
FIG 7.

Serum cytokine concentrations from 1 to 4 weeks after oral infection with S. enterica serovar Typhimurium in Sv129S6 mice. Shown are serum cytokine concentrations in infected and control mice over 4 weeks postinfection. Control mice (gray lines) at weeks 1 to 4, n = 4, 3, 3, and 4; infected mice (black lines) at weeks 1 to 4, n = 9, 10, 11, and 14. Means and SEM are shown. *, P < 0.005; +, P < 0.05; one-way ANOVA with Tukey's post hoc test.
Bacterial tissue load correlation with cytokines and chemokines in individual mice.
Mice infected with S. Typhimurium develop a range of clinical signs and differing levels of tissue colonization and bacterial shedding in the feces (7, 43). We have previously shown that hematopathology resolves in infected mice as bacterial loads clear, as well as a correlation between lower bacterial loads and less severe anemia (7). Consistent with such variability, at 1 week postinfection, we observed 3-fold or greater differences between individual mice in serum cytokine and chemokine responses, specifically in TNF-α, IL-10, and CXCL-1 concentrations (Fig. 7). To establish whether individual mice respond to infection according to distinct serum cytokine or chemokine patterns, we calculated pairwise correlation coefficients between splenic bacterial loads (CFU) and each measured cytokine and chemokine (Fig. 8). At 1 week postinfection, serum MCP-1 negatively correlated with CFU, but by the second week postinfection, the correlation became positive, consistent with the timeline demonstrated for increases in circulating (7) and tissue monocytes and macrophages (Fig. 2). High serum concentrations of TNF-α, IL-1β, and IL-10, two pro- and one anti-inflammatory cytokine, respectively, correlated positively with splenic CFU in individual mice through several weeks of infection, including the first week, when differences in bacterial tissue loads are largest. In contrast, IFN-γ correlated with CFU only in the fourth week postinfection, and IL-12 and IL-2 not at all. Thus, in this mouse model of infection, mice that have high bacterial tissue loads early during infection respond by expressing high levels of key pro- and anti-inflammatory cytokines.
FIG 8.
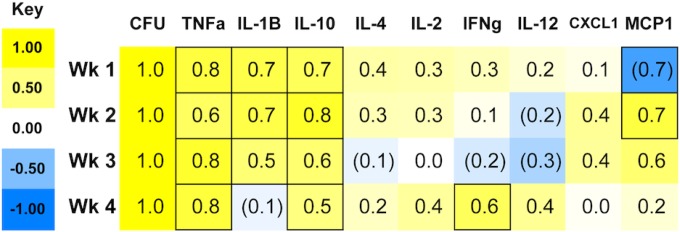
Bacterial load (CFU per gram of spleen) and serum cytokine correlations after oral infection of Sv129S6 mice with S. enterica serovar Typhimurium. The values and shading intensities represent Spearman's correlation coefficients between two traits. The values in the outlined boxes are significant (P < 0.05).
DISCUSSION
The data here demonstrate that increased Fpn1 expression in tissue macrophages is concurrent with the loss of tissue iron postinfection in S. Typhimurium-infected Sv129S6 mice. These observations indicate active export of iron from tissue macrophages during infection. Increased Fpn1 expression in vivo is consistent with cell culture studies demonstrating Fpn1-dependent inhibition of intracellular Salmonella growth as a potential host defense mechanism (44–46). Export of iron by cultured macrophages reduces the supply of iron for intracellular pathogens (in this case S. Typhimurium) and thereby benefits the host (21, 35, 47). Consistent with high Fpn1 expression at 3 weeks postinfection, liver hepcidin mRNA levels declined between 1 and 3 weeks. Hepcidin is a negative regulator of Fpn1 at the cell surface (34). We also found that duodenal expression of Fpn1 is increased postinfection, suggesting increased absorption of dietary iron. Increased duodenal Fpn1 expression is a hallmark of systemic iron deficiency (39, 48) and is contrary to the decreased duodenal Fpn1 expression that is characteristic of AID (23, 48). Thus, these in vivo observations provide a physiological context for macrophage iron export during infection. For this model, our data indicate that iron is exported from tissue macrophages postinfection by Fpn1 and is utilized, in response to anemia, for hemoglobin synthesis, as indicated by the marked erythropoietic response (EMH). EMH was previously shown by both splenic histopathology and increased TER119 staining of erythroblasts in the spleens of infected mice (7, 8). In other words, increased tissue Fpn1 expression and decreased tissue iron, in concert with the previously demonstrated microcytic anemia in these mice (7), are consistent with systemic iron utilization and depletion.
Inflammation is the pathological hallmark of this mouse model of typhoid fever, concurrent with the spectrum of acute and persistent hematopathological findings that include microcytic anemia, inflammatory leukogram, and increased hemophagocytosis (6–8). The first 3 weeks postinfection correlate with the most severe hematopathology, which resolves over time as bacterial loads clear (7). Here, we found this period to be characterized by high and sustained levels of proinflammatory cytokines, including IFN-γ and TNF-α, as well as the chemokines CXCL-1 and MCP-1, which recruit tissue phagocytes. Expression of IFN-γ, IL-12, and TNF-α is consistent with the increased tissue macrophage expression of Fpn1 (Fig. 4 and 5) and concurrent loss of iron storage (Fig. 1 and 4) in the spleen and liver (19, 20, 35). The observed proinflammatory serum cytokine responses and intralesional Nos2 expression are further consistent with bacterial killing and the gradual decline in the bacterial tissue load (Fig. 2) during acute to subacute stages of infection.
In our studies, we correlate higher host bacterial loads with more severe anemia (7). We found that high serum TNF-α concentrations correlate with increased bacterial burden in individual mice (Fig. 8). A correlation of high TNF-α with higher bacterial loads and more severe anemia is consistent with published studies linking TNF-α to impaired erythropoiesis and erythrocyte membrane injury (23, 49). Increased duodenal expression of Fpn1 supports a systemic need for iron and increased dietary absorption in response to reactive erythropoiesis. This erythropoietic demand for iron can override an inflammation-mediated anemia (50) in which dietary iron absorption is reduced and reticuloendothelial cells become loaded with iron (48, 50). Together, our findings support the hypothesis that iron-trafficking processes contribute not only to host control of infection, but also to persistent anemia (Fig. 9).
FIG 9.

Infection with S. enterica serovar Typhimurium results in tissue iron loss and exacerbates anemia. (1) Intracellular bacteria trigger inflammation, including production of the cytokines TNF-α and IFN-γ. These contribute to anemia via erythrocyte membrane damage and erythrophagocytosis, as well as inhibition of erythropoiesis (not shown). (2) IFN-γ also increases macrophage expression of the iron exporter Fpn1 via production of nitric oxide, helping to control Salmonella growth by reducing its access to intracellular iron. (3 and 4) Exported iron is then available for increased erythropoiesis in response to anemia (3), but systemic iron becomes depleted, and erythropoiesis is therefore insufficient to overcome the inflammation-induced microcytic anemia (4). (5) Due to the negative regulatory effect of iron on innate immune effector pathways, low macrophage iron results in increased IFN-γ-mediated antimicrobial activity, including Fpn1 expression. In an attempt to compensate for anemia, the body responds by increasing absorption of iron via duodenal Fpn1. (6) As bacterial numbers decline, so does the level of TNF-α production, and recovery from anemia begins. With the eventual decrease in IFN-γ, macrophages can reestablish their iron stores.
Increased hemophagocytosis in bone marrow and liver macrophages in S. Typhimurium-infected mice has been demonstrated here (Fig. 3) and in our prior studies (7, 8, 10, 28). Sustained exogenous delivery of cytokines (IFN-γ or IL-4) or a TLR9 agonist (CpG) promotes tissue hemophagocytosis and the development of anemia (42, 51, 52). Additionally, sustained increases in serum TNF-α contribute to erythrocyte damage (53) and subsequent erythrophagocytosis (54). Sustained increases in serum IL-4 postinfection and our correlation of tissue CFU with the anti-inflammatory cytokine IL-10 are consistent with the presence of a subpopulation of M2, alternatively activated macrophages in which Salmonella may survive (9, 10, 28). Hemophagocytes that accumulate upon S. Typhimurium infection as part of the expanding macrophage population have been shown to express an M2 phenotype; specifically, these cells express high levels of the M2 markers MRC1/CD206 and SRB1/CD36 and low levels of the M1 markers NOS2 and major histocompatibility complex class II (MHC-II) compared to other macrophages (28). Since M2 macrophages characteristically release iron by way of Fpn1 (41, 55), this erythrophagocytic component of the postinfection hematopathology could be further contributing to the development and persistence of anemia (51).
In summary, proliferation of tissue phagocyte populations postinfection in conjunction with a proinflammatory cytokine response and increased tissue Fpn1 expression in response to marked hematopoiesis result in systemic iron depletion and anemia. The massive loss of iron from the spleen, the major site of iron storage in the mouse, occurs concurrently with the marked inflammatory cytokine response and increased expression of the iron transporter Fpn1 in the reticuloendothelial cells of the spleen and liver and in the duodenal enterocytes. We propose that the combination of the host's intense erythropoietic response to anemia concurrent with increased hemophagocytosis presents a supply and demand problem, i.e., intestinal iron absorption cannot meet the erythropoietic demand for iron, and therefore, the body is systemically depleted of iron, resulting in erythrocyte microcytosis and fragmentation and persistent anemia (7, 8). These in vivo observations are consistent with prior cell culture studies and suggest that the relocation of iron from tissue macrophages during infection may further host survival of acute S. Typhimurium infection but also contribute to anemia.
ACKNOWLEDGMENTS
This work was supported by NIH grants AI095395 and AI072492 (C.S.D.) and the Massachusetts General Hospital Center for Comparative Medicine (D.E.B.).
The content is solely the responsibility of the authors and does not necessarily represent the official views of the National Institutes of Health.
We thank Kyle W. Brown and Naomi A. Kirby for technical assistance with images.
REFERENCES
- 1.Andrews-Polymenis HL, Bäumler AJ, McCormick BA, Fang FC. 2010. Taming the elephant: Salmonella biology, pathogenesis, and prevention. Infect Immun 78:2356–2369. doi: 10.1128/IAI.00096-10. [DOI] [PMC free article] [PubMed] [Google Scholar]
- 2.Parry CM, Hien TT, Dougan G, White NJ, Farrar JJ. 2002. Typhoid fever. N Engl J Med 347:1770–1782. doi: 10.1056/NEJMra020201. [DOI] [PubMed] [Google Scholar]
- 3.Tsolis RM, Xavier MN, Santos RL, Bäumler AJ. 2011. How to become a top model: impact of animal experimentation on human Salmonella disease research. Infect Immun 79:1806–1814. doi: 10.1128/IAI.01369-10. [DOI] [PMC free article] [PubMed] [Google Scholar]
- 4.Vidal S, Tremblay ML, Govoni G, Gauthier S, Sebastiani G, Malo D, Skamene E, Olivier M, Jothy S, Gros P. 1995. The Ity/Lsh/Bcg locus: natural resistance to infection with intracellular parasites is abrogated by disruption of the Nramp1 gene. J Exp Med 182:655–666. doi: 10.1084/jem.182.3.655. [DOI] [PMC free article] [PubMed] [Google Scholar]
- 5.Zaharik ML, Cullen VL, Fung AM, Libby SJ, Kujat Choy SL, Coburn B, Kehres DG, Maguire ME, Fang FC, Finlay BB. 2004. The Salmonella enterica serovar Typhimurium divalent cation transport systems MntH and SitABCD are essential for virulence in an Nramp1G169 murine typhoid model. Infect Immun 72:5522–5525. doi: 10.1128/IAI.72.9.5522-5525.2004. [DOI] [PMC free article] [PubMed] [Google Scholar]
- 6.Monack DM, Mueller A, Falkow S. 2004. Persistent bacterial infections: the interface of the pathogen and the host immune system. Nat Rev Microbiol 2:747–765. doi: 10.1038/nrmicro955. [DOI] [PubMed] [Google Scholar]
- 7.Brown DE, McCoy MW, Pilonieta MC, Nix RN, Detweiler CS. 2010. Chronic murine typhoid fever is a natural model of secondary hemophagocytic lymphohistiocytosis. PLoS One 5:e9441. doi: 10.1371/journal.pone.0009441. [DOI] [PMC free article] [PubMed] [Google Scholar]
- 8.Brown DE, Libby SJ, Moreland SM, McCoy MW, Brabb T, Stepanek A, Fang FC, Detweiler CS. 2013. Salmonella enterica causes more severe inflammatory disease in C57/BL6 Nramp1G169 mice than Sv129S6 mice. Vet Pathol 50:867–876. doi: 10.1177/0300985813478213. [DOI] [PMC free article] [PubMed] [Google Scholar]
- 9.Eisele NA, Ruby T, Jacobson A, Manzanillo PS, Cox JS, Lam L, Mukundan L, Chawla A, Monack DM. 2013. Salmonella require the fatty acid regulator PPARδ for the establishment of a metabolic environment essential for long-term persistence. Cell Host Microbe 14:171–182. doi: 10.1016/j.chom.2013.07.010. [DOI] [PMC free article] [PubMed] [Google Scholar]
- 10.Nix RN, Altschuler SE, Henson PM, Detweiler CS. 2007. Hemophagocytic macrophages harbor Salmonella enterica during persistent infection. PLoS Pathog 3:e193. doi: 10.1371/journal.ppat.0030193. [DOI] [PMC free article] [PubMed] [Google Scholar]
- 11.Nagy TA, Moreland SM, Detweiler CS. 2014. Salmonella acquires ferrous iron from haemophagocytic macrophages. Mol Microbiol 93:1314–1326. doi: 10.1111/mmi.12739. [DOI] [PMC free article] [PubMed] [Google Scholar]
- 12.Yang WK, Fu LS, Lan JL, Shen GH, Chou G, Tseng CF, Chi CS. 2003. Mycobacterium avium complex-associated hemophagocytic syndrome in systemic lupus erythematosus patient: report of one case. Lupus 12:312–316. doi: 10.1191/0961203303lu326cr. [DOI] [PubMed] [Google Scholar]
- 13.Posey JE, Gherardini FC. 2000. Lack of a role for iron in the Lyme disease pathogen. Science 288:1651–1653. doi: 10.1126/science.288.5471.1651. [DOI] [PubMed] [Google Scholar]
- 14.Skaar EP. 2010. The battle for iron between bacterial pathogens and their vertebrate hosts. PLoS Pathog 6:e1000949. doi: 10.1371/journal.ppat.1000949. [DOI] [PMC free article] [PubMed] [Google Scholar]
- 15.Tsolis RM, Bäumler AJ, Heffron F, Stojiljkovic I. 1996. Contribution of TonB- and Feo-mediated iron uptake to growth of Salmonella typhimurium in the mouse. Infect Immun 64:4549–4556. [DOI] [PMC free article] [PubMed] [Google Scholar]
- 16.Nairz M, Fritsche G, Brunner P, Talasz H, Hantke K, Weiss G. 2008. Interferon-gamma limits the availability of iron for intramacrophage Salmonella typhimurium. Eur J Immunol 38:1923–1936. doi: 10.1002/eji.200738056. [DOI] [PubMed] [Google Scholar]
- 17.Fritsche G, Nairz M, Libby SJ, Fang FC, Weiss G. 2012. Slc11a1 (Nramp1) impairs growth of Salmonella enterica serovar typhimurium in macrophages via stimulation of lipocalin-2 expression. J Leukoc Biol 92:353–359. doi: 10.1189/jlb.1111554. [DOI] [PMC free article] [PubMed] [Google Scholar]
- 18.Donovan A, Andrews NC. 2004. The molecular regulation of iron metabolism. Hematol J 5:373–380. doi: 10.1038/sj.thj.6200540. [DOI] [PubMed] [Google Scholar]
- 19.Ding AH, Nathan CF, Stuehr DJ. 1988. Release of reactive nitrogen intermediates and reactive oxygen intermediates from mouse peritoneal macrophages. Comparison of activating cytokines and evidence for independent production. J Immunol 141:2407–2412. [PubMed] [Google Scholar]
- 20.Portillo J-AC, Feliciano LM, Okenka G, Heinzel F, Subauste MC, Subauste CS. 2012. CD40 and tumour necrosis factor-α co-operate to up-regulate inducible nitric oxide synthase expression in macrophages. Immunology 135:140–150. doi: 10.1111/j.1365-2567.2011.03519.x. [DOI] [PMC free article] [PubMed] [Google Scholar]
- 21.Chlosta S, Fishman DS, Harrington L, Johnson EE, Knutson MD, Wessling-Resnick M, Cherayil BJ. 2006. The iron efflux protein ferroportin regulates the intracellular growth of Salmonella enterica. Infect Immun 74:3065–3067. doi: 10.1128/IAI.74.5.3065-3067.2006. [DOI] [PMC free article] [PubMed] [Google Scholar]
- 22.Burkhard MJ, Brown DE, McGrath JP, Meador VP, Mayle DA, Keaton MJ, Hoffman WP, Zimmermann JL, Abbott DL, Sun SC. 2001. Evaluation of the erythroid regenerative response in two different models of experimentally induced iron deficiency anemia. Vet Clin Pathol 30:76–85. doi: 10.1111/j.1939-165X.2001.tb00262.x. [DOI] [PubMed] [Google Scholar]
- 23.Weiss G. 2009. Iron metabolism in the anemia of chronic disease. Biochim Biophys Acta 1790:682–693. doi: 10.1016/j.bbagen.2008.08.006. [DOI] [PubMed] [Google Scholar]
- 24.Smith BP, Reina-Guerra M, Hoiseth SK, Stocker BA, Habasha F, Johnson E, Merritt F. 1984. Aromatic-dependent Salmonella typhimurium as modified live vaccines for calves. Am J Vet Res 45:59–66. [PubMed] [Google Scholar]
- 25.U.S. National Research Council. 1995. Nutrient requirements of laboratory animals, 4th ed National Academy of Sciences, Washington, DC. [Google Scholar]
- 26.Rodriguez R, Jung C-L, Gabayan V, Deng JC, Ganz T, Nemeth E, Bulut Y. 2014. Hepcidin induction by pathogens and pathogen-derived molecules is strongly dependent on interleukin-6. Infect Immun 82:745–752. doi: 10.1128/IAI.00983-13. [DOI] [PMC free article] [PubMed] [Google Scholar]
- 27.Livak KJ, Schmittgen TD. 2001. Analysis of relative gene expression data using real-time quantitative PCR and the 2(-Delta Delta C(T)) method. Methods 25:402–408. doi: 10.1006/meth.2001.1262. [DOI] [PubMed] [Google Scholar]
- 28.McCoy MW, Moreland SM, Detweiler CS. 2012. Hemophagocytic macrophages in murine typhoid fever have an anti-inflammatory phenotype. Infect Immun 80:3642–3649. doi: 10.1128/IAI.00656-12. [DOI] [PMC free article] [PubMed] [Google Scholar]
- 29.Suttie AW. 2006. Histopathology of the spleen. Toxicol Pathol 34:466–503. doi: 10.1080/01926230600867750. [DOI] [PubMed] [Google Scholar]
- 30.D'Anna MC, Veuthey TV, Roque ME. 2009. Immunolocalization of ferroportin in healthy and anemic mice. J Histochem Cytochem 57:9–16. doi: 10.1369/jhc.2008.951616. [DOI] [PMC free article] [PubMed] [Google Scholar]
- 31.Rehg JE, Bush D, Ward JM. 2012. The utility of immunohistochemistry for the identification of hematopoietic and lymphoid cells in normal tissues and interpretation of proliferative and inflammatory lesions of mice and rats. Toxicol Pathol 40:345–374. doi: 10.1177/0192623311430695. [DOI] [PubMed] [Google Scholar]
- 32.Johansson C, Ingman M, Wick JM. 2006. Elevated neutrophil, macrophage and dendritic cell numbers characterize immune cell populations in mice chronically infected with Salmonella. Microb Pathog 41:49–58. doi: 10.1016/j.micpath.2006.03.004. [DOI] [PubMed] [Google Scholar]
- 33.Jackson A, Nanton MR, O'Donnell H, Akue AD, McSorley SJ. 2010. Innate immune activation during Salmonella infection initiates extramedullary erythropoiesis and splenomegaly. J Immunol 185:6198–6204. doi: 10.4049/jimmunol.1001198. [DOI] [PMC free article] [PubMed] [Google Scholar]
- 34.Nemeth E, Tuttle MS, Powelson J, Vaughn MB, Donovan A, Ward DM, Ganz T, Kaplan J. 2004. Hepcidin regulates cellular iron efflux by binding to ferroportin and inducing its internalization. Science 306:2090–2093. doi: 10.1126/science.1104742. [DOI] [PubMed] [Google Scholar]
- 35.Nairz M, Schleicher U, Schroll A, Sonnweber T, Theurl I, Ludwiczek S, Talasz H, Brandacher G, Moser PL, Muckenthaler MU, Fang FC, Bogdan C, Weiss G. 2013. Nitric oxide-mediated regulation of ferroportin-1 controls macrophage iron homeostasis and immune function in Salmonella infection. J Exp Med 210:855–873. doi: 10.1084/jem.20121946. [DOI] [PMC free article] [PubMed] [Google Scholar]
- 36.Vazquez-Torres A, Jones-Carson J, Mastroeni P, Ischiropoulos H, Fang FC. 2000. Antimicrobial actions of the NADPH phagocyte oxidase and inducible nitric oxide synthase in experimental salmonellosis. I. Effects on microbial killing by activated peritoneal macrophages in vitro. J Exp Med 192:227–236. doi: 10.1084/jem.192.2.227. [DOI] [PMC free article] [PubMed] [Google Scholar]
- 37.Donovan A, Lima CA, Pinkus JL, Pinkus GS, Zon LI, Robine S, Andrews NC. 2005. The iron exporter ferroportin/Slc40a1 is essential for iron homeostasis. Cell Metab 1:191–200. doi: 10.1016/j.cmet.2005.01.003. [DOI] [PubMed] [Google Scholar]
- 38.Santos RL, Zhang S, Tsolis RM, Kingsley RA, Adams LG, Bäumler AJ. 2001. Animal models of Salmonella infections: enteritis versus typhoid fever. Microbes Infect 3:1335–1344. doi: 10.1016/S1286-4579(01)01495-2. [DOI] [PubMed] [Google Scholar]
- 39.Zhang X, Edwards JP, Mosser DM. 2009. The expression of exogenous genes in macrophages: obstacles and opportunities. Methods Mol Biol 531:123–143. doi: 10.1007/978-1-59745-396-7_9. [DOI] [PMC free article] [PubMed] [Google Scholar]
- 40.Sieling PA, Modlin RL. 1994. Cytokine patterns at the site of mycobacterial infection. Immunobiology 191:378–387. doi: 10.1016/S0171-2985(11)80443-2. [DOI] [PubMed] [Google Scholar]
- 41.Corna G, Campana L, Pignatti E, Castiglioni A, Tagliafico E, Bosurgi L, Campanella A, Brunelli S, Manfredi AA, Apostoli P, Silvestri L, Camaschella C, Rovere-Querini P. 2010. Polarization dictates iron handling by inflammatory and alternatively activated macrophages. Haematologica 95:1814–1822. doi: 10.3324/haematol.2010.023879. [DOI] [PMC free article] [PubMed] [Google Scholar]
- 42.Milner JD, Orekov T, Ward JM, Cheng L, Torres-Velez F, Junttila I, Sun G, Buller M, Morris SC, Finkelman FD, Paul WE. 2010. Sustained IL-4 exposure leads to a novel pathway for hemophagocytosis, inflammation, and tissue macrophage accumulation. Blood 116:2476–2483. doi: 10.1182/blood-2009-11-255174. [DOI] [PMC free article] [PubMed] [Google Scholar]
- 43.Gopinath S, Hotson A, Johns J, Nolan G, Monack D. 2013. The systemic immune state of super-shedder mice is characterized by a unique neutrophil-dependent blunting of TH1 responses. PLoS Pathog 9:e1003408. doi: 10.1371/journal.ppat.1003408. [DOI] [PMC free article] [PubMed] [Google Scholar]
- 44.Johnson EE, Sandgren A, Cherayil BJ, Murray M, Wessling-Resnick M. 2010. Role of ferroportin in macrophage-mediated immunity. Infect Immun 78:5099–5106. doi: 10.1128/IAI.00498-10. [DOI] [PMC free article] [PubMed] [Google Scholar]
- 45.Nairz M, Theurl I, Ludwiczek S, Theurl M, Mair SM, Fritsche G, Weiss G. 2007. The co-ordinated regulation of iron homeostasis in murine macrophages limits the availability of iron for intracellular Salmonella typhimurium. Cell Microbiol 9:2126–2140. doi: 10.1111/j.1462-5822.2007.00942.x. [DOI] [PubMed] [Google Scholar]
- 46.Paradkar PN, De Domenico I, Durchfort N, Zohn I, Kaplan J, Ward DM. 2008. Iron depletion limits intracellular bacterial growth in macrophages. Blood 112:866–874. doi: 10.1182/blood-2007-12-126854. [DOI] [PMC free article] [PubMed] [Google Scholar]
- 47.Nairz M, Fritsche G, Crouch M-LV, Barton HC, Fang FC, Weiss G. 2009. Slc11a1 limits intracellular growth of Salmonella enterica sv. Typhimurium by promoting macrophage immune effector functions and impairing bacterial iron acquisition. Cell Microbiol 11:1365–1381. doi: 10.1111/j.1462-5822.2009.01337.x. [DOI] [PMC free article] [PubMed] [Google Scholar]
- 48.Theurl I, Aigner E, Theurl M, Nairz M, Seifert M, Schroll A, Sonnweber T, Eberwein L, Witcher DR, Murphy AT, Wroblewski VJ, Wurz E, Datz C, Weiss G. 2009. Regulation of iron homeostasis in anemia of chronic disease and iron deficiency anemia: diagnostic and therapeutic implications. Blood 113:5277–5286. doi: 10.1182/blood-2008-12-195651. [DOI] [PubMed] [Google Scholar]
- 49.Morceau F, Dicato M, Diederich M. 2009. Pro-inflammatory cytokine-mediated anemia: regarding molecular mechanisms of erythropoiesis. Mediators Inflamm 2009:405016. doi: 10.1155/2009/405016. [DOI] [PMC free article] [PubMed] [Google Scholar]
- 50.Pak M, Lopez MA, Gabayan V, Ganz T, Rivera S. 2006. Suppression of hepcidin during anemia requires erythropoietic activity. Blood 108:3730–3735. doi: 10.1182/blood-2006-06-028787. [DOI] [PMC free article] [PubMed] [Google Scholar]
- 51.Zoller EE, Lykens JE, Terrell CE, Aliberti J, Filipovich AH, Henson PM, Jordan MB. 2011. Hemophagocytosis causes a consumptive anemia of inflammation. J Exp Med 208:1203–1214. doi: 10.1084/jem.20102538. [DOI] [PMC free article] [PubMed] [Google Scholar]
- 52.Behrens EM, Canna SW, Slade K, Rao S, Kreiger PA, Paessler M, Kambayashi T, Koretzky GA. 2011. Repeated TLR9 stimulation results in macrophage activation syndrome-like disease in mice. J Clin Invest 121:2264–2277. doi: 10.1172/JCI43157. [DOI] [PMC free article] [PubMed] [Google Scholar]
- 53.Moldawer LL, Marano MA, Wei H, Fong Y, Silen ML, Kuo G, Manogue KR, Vlassara H, Cohen H, Cerami A. 1989. Cachectin/tumor necrosis factor-alpha alters red blood cell kinetics and induces anemia in vivo. FASEB J 3:1637–1643. [DOI] [PubMed] [Google Scholar]
- 54.Weiss G, Goodnough LT. 2005. Anemia of chronic disease. N Engl J Med 352:1011–1023. doi: 10.1056/NEJMra041809. [DOI] [PubMed] [Google Scholar]
- 55.Recalcati S, Locati M, Marini A, Santambrogio P, Zaninotto F, De Pizzol M, Zammataro L, Girelli D, Cairo G. 2010. Differential regulation of iron homeostasis during human macrophage polarized activation. Eur J Immunol 40:824–835. doi: 10.1002/eji.200939889. [DOI] [PubMed] [Google Scholar]
- 56.Pilonieta MC, Moreland SM, English CN, Detweiler CS. 2014. Salmonella enterica infection stimulates macrophages to hemophagocytose. mBio 5:e02211-14. doi: 10.1128/mBio.02211-14. [DOI] [PMC free article] [PubMed] [Google Scholar]