Membrane lipids are one of the most important and ubiquitous regulatory molecules that control the localization, activity, and mutual interactions of a wide variety of cellular proteins.[1] Because local lipid concentrations are highly variable and may serve as activation thresholds for myriad biological processes mediated by these proteins, spatiotemporally resolved lipid quantification is essential for elucidating the diverse and complex mechanisms of biological regulation.[2] We recently developed a chemical strategy for in situ quantification of a single lipid species in live mammalian cells using a hybrid sensor constructed with an engineered lipid binding protein and an environmentally sensitive (or solvatochromatic) fluorophore (ESF).[2] Quantification of cellular phosphatidylinositol-4,5-bisphosphate (PIP2) by ratiometric imaging analysis demonstrated the spatiotemporal dynamics of this important signaling lipid in unprecedented details and provided new insight into how it regulates such diverse biological processes.[2]
Under physiological conditions, multiple regulatory lipids are metabolically and functionally linked to one another.[3] Also, a single lipid species can exist disproportionally in opposite faces of lipid bilayers, performing distinct functions.[4] Most notably, tightly controlled transbilayer asymmetry of lipids in the plasma membrane (PM) of mammalian cells is crucial for cell survival, function, and regulation.[4] Thus, a new technology is needed for simultaneous in situ quantification of multiple lipids in the same membrane leaflet or a lipid species in two opposite leaflets of cell membranes. As a first step toward simultaneous quantification of multiple lipids, we developed a new strategy for dual in situ lipid quantification in live cells.
Simultaneous dual lipid quantification would require orthogonal lipid sensors that allow robust dual ratiometric analysis. Unfortunately, limited availability of amphiphilic ESFs greatly hampers orthogonal lipid sensor development. We therefore searched for an ESF that can be orthogonally used with the most commonly employed thiol-reactive amphiphilic ESF, acrylodan (6-acryloyl-2-dimethylaminonaphthalene).[5] When coupled to a cysteine residue of a protein, the 2-dimethylaminonaphthaloyl (DAN) group undergoes a green-to-blue spectral shift with a large increase in fluorescence emission intensity as the protein binds its cognate lipid in the membrane, allowing robust ratiometric quantification of cellular lipids through in vitro calibration.[2] An ideal orthogonal ESF partner for DAN would be an amphiphilic fluorescence dye that shows a spectral shift from red to orange fluorescence upon lipid binding. Among reported red fluorophores, Nile Red possesses such properties and its maleimide derivatives have been prepared for cysteine labeling.[6] These Nile Red derivatives are, however, highly lipophilic and have extremely low water solubility. This not only lowers the yield of protein labeling reactions in aqueous solution but also adversely affects the structure, stability, and membrane binding properties of the labeled proteins. To overcome these major limitations, we designed and synthesized several cysteine-specific acrylate derivatives of Nile Red with a varying degree of lipophilicity.
The 2-hydroxy-Nile Red benzophenoxazinone core 2-HONR was synthesized starting from 5-diethylamino-2-nitrosophenol hydrochloride and 1,6-dihydroxynapthalene (Scheme 1).[7] The first-generation fluorophore NR1 was prepared by treatment of 2-HONR with acryloyl chloride and triethylamine. Although NR1 displayed favorable spectral properties, its solubility in water was still extremely low and thus its protein labeling efficiency was low. We thus introduced more oxygen atoms and an additional hydroxyl group into the linker to increase the water solubility. NR2 (bis-acrylate) and NR3 (monoacrylate) were synthesized from a common precursor 2-HONR via a three-step sequence involving allylation, dihydroxylation and acrylation.
Scheme 1.
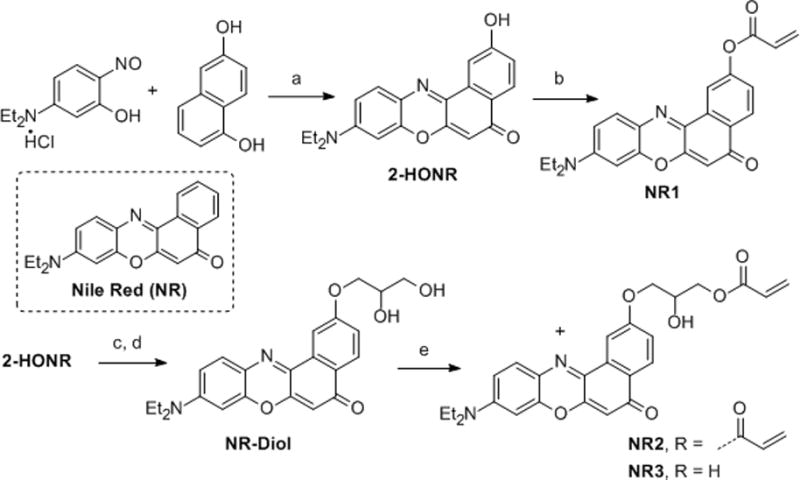
Synthesis of Nile Red-derivatives with acrylate linker: a) DMF, reflux, 69%; b) acryloyl chloride (1.2 equiv), Et3N (1.5 equiv), 0 °C, CH2Cl2, 30 min, 85%; c) NaH (1.25 equiv), DMF, 0 °C, 30 min; allyl bromide (2.5 equiv), 0 °C to rt, 3 h, 72%; d) OsO4 (cat.), NMO (2 equiv), acetone/H2O/MeOH (4:1:0.5), 65%; e) acryloyl chloride (0.33 equiv), Et3N (1.5 equiv), −30 °C, CH2Cl2, 10 min, 25%. DMF=N,N-dimethylformamide, NMO=N-methylmorpholine N-oxide.
Among these derivatives, NR3 afforded the highest coupling yield to the engineered ENTH domain (eENTH) that was previously used for the PIP2 sensor.[2] Also, the eENTH labeled with NR3 (NR3-eENTH) had the most favorable properties, including the lowest tendency to self-associate in solution and to non-specifically adsorb to lipid membranes and glass surfaces. Furthermore, NR3-eENTH showed a large PIP2 concentration-dependent spectral shift from red to orange-red when it bound to PIP2-containing vesicles (Figure S1a in the Supporting Information). A minimal spectral overlap between NR3-eENTH and DAN-eENTH (Figure S1b in the Supporting Information) suggests that DAN and NR3 may be used for preparing orthogonal lipid sensors.
To test this notion, we prepared DAN- and NR3-labeled PS sensors and simultaneously measured the concentrations of PS in the inner (cytofacial) and the outer (exofacial) leaflets of the PM of mammalian cells. PS is a major lipid component of PM and is predominantly found in the inner leaflet under normal conditions.[8] It is, however, translocated to the outer leaflet by the action of a Ca2+-dependent scramblase during apoptosis and blood vessel damage and triggers phagocytosis and blood coagulation cascade, respectively.[8] Currently, little is known about the spatiotemporal dynamics of PS across the PM under physiological conditions mainly because current optical imaging technologies do not allow simultaneous in situ quantification of PS in the two leaflets of the PM.
To prepare orthogonal PS sensors, we first engineered the lactadherin C2 domain (eLactC2), the fluorescence protein-tagged forms of which have been widely used as a specific cellular PS probe,[9] to introduce a single cysteine in its membrane binding surface. We then labeled it with acrylodan and NR3, respectively, to obtain DAN-eLactC2 and NR3-eLactC2. Both DAN-eLactC2 and NR3-eLactC2 showed characteristic spectral changes upon binding to vesicles in a PS concentration-dependent manner (Figure 1a and 1b). After performing in vitro ratiometric calibration of these PS sensors using giant unilamellar vesicles containing varying concentrations of PS (Figure 1c and 1d; see Supporting Information for details), we microinjected DAN-eLactC2 into NIH 3T3 cells and added NR3-eLactC2 to the medium (or vice versa). We then triggered the cell apoptosis with 1 μM doxorubicin, and simultaneously monitored DAN-eLactC2 and NR3-eLactC2 bound to the PM by a four-channel two-photon microscope equipped with two femtosecond-pulsed laser sources.
Figure 1.
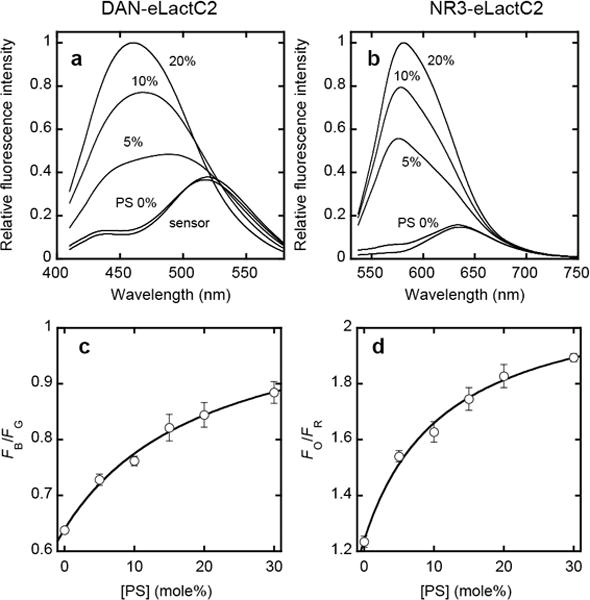
a–d. Spectral properties of and ratiometric calibration for orthogonal PS sensors. a–b) Fluorescence emission spectra of DAN-eLactC2 (a) and NR3-eLactC2 (b) (both 500 nM) in the presence of phosphatidylcholine (PC)/PS (100-x:x) large vesicles measured spectrofluorometrically. Numbers (x) indicate mole% of PS. The excitation wavelength was 392 nm for DAN-eLactC2 and 520 nm for NR3-eLactC2. Both exhibited a dramatic blue shift upon PS binding. c–d) Ratiometric calibration curves of DAN-eLactC2 (c) and NR3-eLactC2 (d) for PS quantification. The PS sensors were monitored by a two-photon microscope in the presence of PC/PS (100-x:x) giant vesicles. Non-linear least-squares analysis of the plot using the equation (for DAN-eLactC2); FB/FG = (FB/FG)max/(1 + Kd/[PS]) + C yields Kd, (FB/FG)max and C values and the calibration curves are constructed using these parameters. FB, FG, Fo, and FR indicate blue, green, orange, and red channel fluorescence intensity, respectively. Kd, (FB/FG)max and C are the equilibrium dissociation constant (in mole%), the maximal FB/FG value and the arbitrary instrumental parameter. Blue and orange channels depict membrane-bound sensors whereas green and red channels show membrane-bound plus free sensors. Error bars indicate standard deviations calculated from >3 independent sets of measurements. 20 mM Tris buffer, pH 7.4, containing 0.16 M KCl was used for all measurements.
No current light microscopy, including super-resolution microscopy, allows spatial resolution of the two lipid layers of cell membranes (≈5-nm thick).[10] Because our PS sensors cannot cross the PM,[2] however, we were able to unambiguously distinguish the signals from the outer and the inner PM by analyzing fluorescence signals from four discrete optical channels in a time-dependent manner (Figure 2a). The slow pace of apoptosis and major changes in cell size and shape during the process (Figure 2a) made continuous imaging analysis impractical. We therefore performed time-lapse imaging and data analysis. Figure 2b depicts PS quantification in the outer PM of apoptotic NIH 3T3 cells after 14 and 24 h of doxorubicin treatment. The analysis reveals for the first time pronounced local heterogeneity of PS in the outer leaflet of the PM. This implies that PS locally enriched beyond a threshold level in the outer PM may constitute hot spots for recognition of apoptotic cells by phagocytes. as seen with PIP2.[2] This notion is also consistent with the finding that although PS started to appear in the outer PM after 8 h (Figure 2c), the cells showed apoptotic phenotypes (e.g., shape changes) only after 20 h. Furthermore, an excellent correlation was seen between the increase in PS in the outer PM and its decrease in the inner PM (both spatially averaged) at a given time (Figure 2c), showing that the PS concentration increase in the outer PM is due to direct transbilayer translocation of PS from the inner PM. Collectively, these results not only demonstrate the feasibility of our orthogonal lipid sensor technology but also shed new light on the transbilayer movement of PS and its local distribution. The same experimental approach can be applied to the real-time quantification of other lipid species (e.g., cholesterol, sphingomyelin, etc.) across the PM, which should provide important new insight into the transbilayer dynamics and the location-specific functions of many vital cellular lipids.
Figure 2.
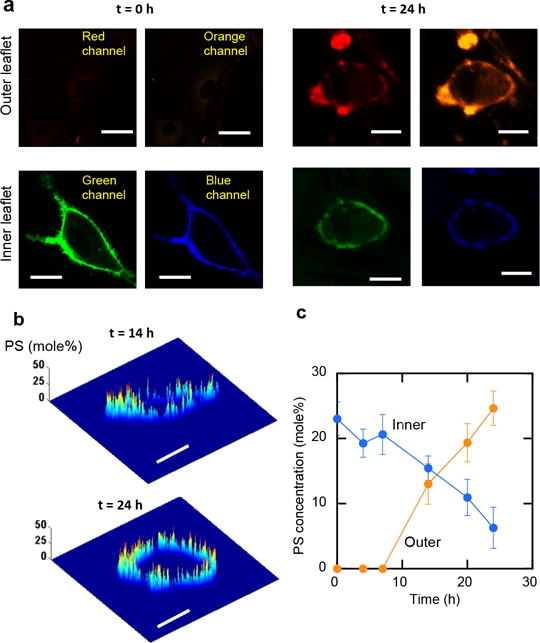
a–c. Simultaneous in situ quantification of PS in the inner and outer PM of NIH 3T3 cells. a) Four-channel images of representative apoptotic cells at two time points. PS in the inner and outer PM was monitored using microinjected DAN-eLactC2 (green and blue channels) and media-added NR3-eLactC2 (red and orange channels) sensors, respectively. Blue and orange channels depict membrane-bound sensors whereas green and red channels show membrane-bound plus free sensors. b) Time-lapse PS quantification in the outer PM at 14 h and 24 h. After apoptosis was induced by 1 μM doxorubicin, PS in the outer and the inner PM was quantified from the blue/green and orange/red ratios, respectively, using the ratiometric calibration curves (Figure 1c–1d). c) Time-dependent changes of spatially averaged PS concentrations in the outer and inner PM. Scale bars indicate 5 μm.
Having established the feasibility of our orthogonal lipid sensor methodology, we then performed simultaneous quantification of two metabolically linked signaling lipids, PIP2 and phosphatidylinositol-3,4,5-trisphosphate (PIP3). PIP3 is produced from PIP2 in the cytofacial leaflet of the PM by phosphoinositide 3-kinase (PI3K) in response to stimuli, such as growth factors,[11] and is converted back to PIP2 by a tumor suppressor lipid phosphatase, PTEN.[12] PIP2 mediates a wide range of cellular processes, including cell signaling[3a, 13] while PIP3 activates myriad of other cellular activities, including cell growth.[11] Under normal conditions, PIP3 is thought to exist in much lower concentration than PIP2 and only transiently because PI3K activation is tightly regulated.[14] Interestingly, it has been recently reported that some mammalian cells may have significant basal levels of PIP3 in the PM.[15] This in turn suggests that the PIP3-to-PIP2 ratio may significantly vary among different mammalian cells, greatly affecting their basal cell activities and responses to various stimuli. The PIP3-to-PIP2 ratio, however, has not been accurately measured in live cells.
We thus simultaneously quantified PIP2 and PIP3 in different mammalian cells using orthogonal sensors for PIP2 and PIP3. As a PIP3 sensor, we engineered the PIP3-selective tandem pleckstrin homology (PH) domains of myosin X (eMyoXPH)[16] for single site cysteine labeling (see the Supporting Information for details), labeled the engineered protein with NR3 (NR3-eMyoXPH), and measured its spectral properties upon binding to PIP3-containing vesicles (Figure S2 in the Supporting Information). This protein was selected over other PIP3-selective PH domains, including BTK and Grp1 PH domains, [15b] because none of them exhibited desired spectral properties when labeled with acrylodan or NR3. NR3-labeled eMyoXPH and DAN-eENTH were then co-microinjected into NIH 3T3 cells and PIP2 and PIP3 were simultaneously quantified by dual ratiometric analysis of images (Figure 3a) before and after stimulation by insulin that activates PI3K.[17]
Figure 3.
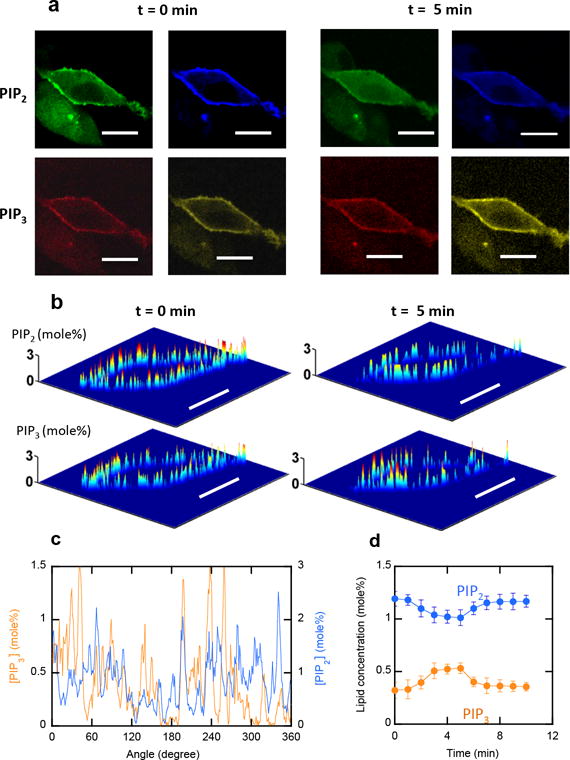
a–d. Simultaneous in situ quantification of PIP2 and PIP3 in the inner PM of NIH 3T3 cells, a) Four-channel images of representative NIH3T3 cells before and 5 min after insulin treatment. PIP2 and PIP3 were monitored using microinjected DAN-eENTH and NR3-eMyoXPH, respectively. Blue and orange channels depict membrane-bound sensors whereas green and red channels show membrane-bound plus free sensors. b) PIP2 and PIP3 were quantified through ratiometric calibration (see Figure S2). c) Angular profiles of PIP2 and PIP3 in the PM at 3 min after insulin treatment. PIP2 and PIP3 show pronounced spatial heterogeneity but a good reciprocal spatial correlation was observed between them. d) Time-dependent changes of spatially averaged PIP2 and PIP3 concentrations in the PM. Scale bars indicate 5 μm.
At a given time, both PIP2 and PIP3 exhibited a high degree of local heterogeneity (Figure 3b). Interestingly, a good spatial correlation was detected between the decrease in PIP2 concentration and the increase in PIP3 concentration (Figure 3c), indicating localized conversion of PIP2 to PIP3 and segregation of the two lipids. When spatially averaged at a given time, the PIP3-to-PIP2 ratio was 0.25 ± 0.05 (average ± S.D. in 15 cells) in the resting NIH 3T3 cells, demonstrating the significant basal PI3K activity in these cells. The ratio reached ≈0.5 within 5 min of insulin stimulation and rapidly returned to the basal level (Figure 3d).
To examine to which degree the PIP3-to-PIP2 ratio varies among mammalian cells, we measured the ratio in PTEN-deficient human prostate cancer cell lines, PC3 cells. The spatially averaged ratio in resting PC3 cells (i.e., 0.30 ± 0.05 in 20 cells) was only slightly higher than that in NIH 3T3 cells (Figure 4a), indicating that the basal PI3K activity is similar in NIH 3T3 and PC3 cells. A main difference was, however, that after insulin stimulation the ratio continued to increase (> 3.0) for up to 10 min (Figure 4a) and caused local enrichment of PIP3 over PIP2 (Figure S3). This result demonstrates how PTEN deletion causes irreversible activation of PIP3 signaling, leading to cancer. When PTEN was reintroduced to PC3 cells by transient transfection, the PIP3-to-PIP2 ratio regained the bell-shaped time dependence after insulin treatment (Figure 4b), verifying that PTEN is directly responsible for the PIP3-to-PIP2 transition under these conditions. Taken together, these results show that PIP2 and PIP3 are locally metabolized by PI3K and PTEN at the PM and that the same stimulus can induce different changes in the PIP3-to-PIP2 ratio, depending on the cell type. This information should be essential for understanding the basis of differential regulatory mechanisms for PIP3 signaling in mammalian cells.
Figure 4.
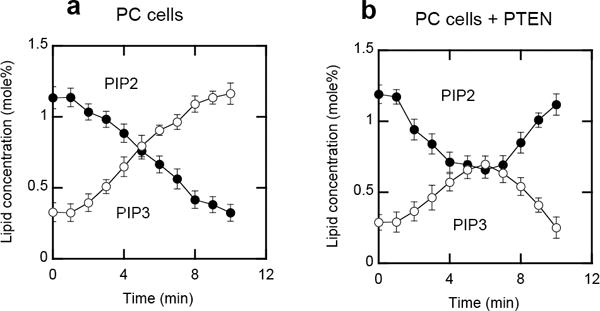
a and b. The PIP3-to-PIP2 ratio in PC cell lines. a) Time-dependent changes of spatially averaged PIP2 and PIP3 concentrations in the PM of PC3 cells lacking PTEN. b) Time-dependent changes of spatially averaged PIP2 and PIP3 concentrations in the PM of PC3 cells with transiently expressing PTEN
In this study, we demonstrate the feasibility of our new orthogonal lipid sensor technology. Our method allows robust and simultaneous in situ quantification of two lipid pools in living mammalian cells in a spatiotemporally resolved manner. The study also shows that simultaneous quantification of two lipid pools provides physiologically important data and new insight unattainable by conventional methodologies. Collectively, it represents an important technical advance toward the systems-level analysis and understanding of complex lipid-mediated cell regulation.
Supplementary Material
Footnotes
We thank Dr. Mingjie Zhang for a kind gift of myosin X PH domain. The work was supported by NIH grants, GM68849 and GM110128. Supporting information for this article is given via a link at the end of the document.
References
- 1.a) Hannun YA, Obeid LM. Nat Rev Mol Cell Biol. 2008;9:139–150. doi: 10.1038/nrm2329. [DOI] [PubMed] [Google Scholar]; b) Cho W. Sci STKE. 2006;2006:pe7. doi: 10.1126/stke.3212006pe7. [DOI] [PubMed] [Google Scholar]; c) Chen Y, Sheng R, Kallberg M, Silkov A, Tun MP, Bhardwaj N, Kurilova S, Hall RA, Honig B, Lu H, Cho W. Mol Cell. 2012;46:226–237. doi: 10.1016/j.molcel.2012.02.012. [DOI] [PMC free article] [PubMed] [Google Scholar]
- 2.Yoon Y, Lee PJ, Kurilova S, Cho W. Nat Chem. 2011;3:868–874. doi: 10.1038/nchem.1163. [DOI] [PMC free article] [PubMed] [Google Scholar]
- 3.a) Di Paolo G, De Camilli P. Nature. 2006;443:651–657. doi: 10.1038/nature05185. [DOI] [PubMed] [Google Scholar]; b) De Matteis MA, Godi A. Nat Cell Biol. 2004;6:487–492. doi: 10.1038/ncb0604-487. [DOI] [PubMed] [Google Scholar]; c) Roth MG. Physiol Rev. 2004;84:699–730. doi: 10.1152/physrev.00033.2003. [DOI] [PubMed] [Google Scholar]
- 4.van Meer G. Cold Spring Harb Perspect Biol. 2011;3 doi: 10.1101/cshperspect.a004671. [DOI] [PMC free article] [PubMed] [Google Scholar]
- 5.Weber G, Farris FJ. Biochemistry. 1979;18:3075–3078. doi: 10.1021/bi00581a025. [DOI] [PubMed] [Google Scholar]
- 6.a) Black SL, Stanley WA, Filipp FV, Bhairo M, Verma A, Wichmann O, Sattler M, Wilmanns M, Schultz C. Bioorg Med Chem. 2008;16:1162–1173. doi: 10.1016/j.bmc.2007.10.080. [DOI] [PMC free article] [PubMed] [Google Scholar]; b) Briggs MSJ, Bruce I, Miller JN, Moody CJ, Simmonds AC, Swann E. J Chem Soc-Perkin Trans. 1997;1:1051–1058. [Google Scholar]; c) Kim SY, Semyonov AN, Twieg RJ, Horwich AL, Frydman J, Moerner WE. J Phys Chem B. 2005;109:24517–24525. doi: 10.1021/jp0534232. [DOI] [PMC free article] [PubMed] [Google Scholar]; d) Kucherak OA, Oncul S, Darwich Z, Yushchenko DA, Arntz Y, Didier P, Mely Y, Klymchenko AS. J Am Chem Soc. 2010;132:4907–4916. doi: 10.1021/ja100351w. [DOI] [PubMed] [Google Scholar]; e) Okamoto A, Tainaka K, Fujiwara Y. J Org Chem. 2006;71:3592–3598. doi: 10.1021/jo060168o. [DOI] [PubMed] [Google Scholar]; f) Wichmann O, Schultz C. Chem Commun (Camb) 2001:2500–2501. doi: 10.1039/b107670c. [DOI] [PubMed] [Google Scholar]; g) Cohen BE, Pralle A, Yao X, Swaminath G, Gandhi CS, Jan YN, Kobilka BK, Isacoff EY, Jan LY. Proc Natl Acad Sci U S A. 2005;102:965–970. doi: 10.1073/pnas.0409469102. [DOI] [PMC free article] [PubMed] [Google Scholar]
- 7.Briggs MSJ, Bruce I, Miller JN, Moody CJ, Simmonds AC, Swann E. Journal of the Chemical Society-Perkin Transactions. 1997;1:1051–1058. [Google Scholar]
- 8.Leventis PA, Grinstein S. Annu Rev Biophys. 2010;39:407–427. doi: 10.1146/annurev.biophys.093008.131234. [DOI] [PubMed] [Google Scholar]
- 9.Yeung T, Gilbert GE, Shi J, Silvius J, Kapus A, Grinstein S. Science. 2008;319:210–213. doi: 10.1126/science.1152066. [DOI] [PubMed] [Google Scholar]
- 10.Huang B, Bates M, Zhuang X. Annu Rev Biochem. 2009;78:993–1016. doi: 10.1146/annurev.biochem.77.061906.092014. [DOI] [PMC free article] [PubMed] [Google Scholar]
- 11.a) Vanhaesebroeck B, Guillermet-Guibert J, Graupera M, Bilanges B. Nat Rev Mol Cell Biol. 2010;11:329–341. doi: 10.1038/nrm2882. [DOI] [PubMed] [Google Scholar]; b) Vanhaesebroeck B, Stephens L, Hawkins P. Nat Rev Mol Cell Biol. 2012;13:195–203. doi: 10.1038/nrm3290. [DOI] [PubMed] [Google Scholar]
- 12.Worby CA, Dixon JE. Annu Rev Biochem. 2014;83:641–669. doi: 10.1146/annurev-biochem-082411-113907. [DOI] [PubMed] [Google Scholar]
- 13.a) McLaughlin S, Murray D. Nature. 2005;438:605–611. doi: 10.1038/nature04398. [DOI] [PubMed] [Google Scholar]; b) McLaughlin S, Wang J, Gambhir A, Murray D. Annu Rev Biophys Biomol Struct. 2002;31:151–175. doi: 10.1146/annurev.biophys.31.082901.134259. [DOI] [PubMed] [Google Scholar]
- 14.Cantley LC. Science. 2002;296:1655–1657. doi: 10.1126/science.296.5573.1655. [DOI] [PubMed] [Google Scholar]
- 15.a) Heo WD, Inoue T, Park WS, Kim ML, Park BO, Wandless TJ, Meyer T. Science. 2006;314:1458–1461. doi: 10.1126/science.1134389. [DOI] [PMC free article] [PubMed] [Google Scholar]; b) Manna D, Bhardwaj N, Vora MS, Stahelin RV, Lu H, Cho W. J Biol Chem. 2008;283:26047–26058. doi: 10.1074/jbc.M802617200. [DOI] [PMC free article] [PubMed] [Google Scholar]
- 16.Lu Q, Yu J, Yan J, Wei Z, Zhang M. Mol Biol Cell. 2011;22:4268–4278. doi: 10.1091/mbc.E11-04-0354. [DOI] [PMC free article] [PubMed] [Google Scholar]
- 17.Ruderman NB, Kapeller R, White MF, Cantley LC. Proc Natl Acad Sci U S A. 1990;87:1411–1415. doi: 10.1073/pnas.87.4.1411. [DOI] [PMC free article] [PubMed] [Google Scholar]
Associated Data
This section collects any data citations, data availability statements, or supplementary materials included in this article.


