Abstract
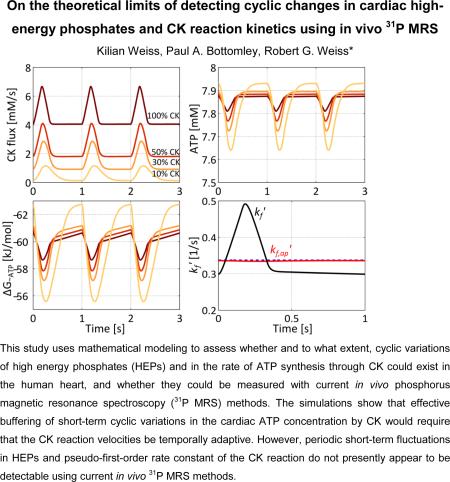
Adenosine triphosphate (ATP) is absolutely required to fuel normal cyclic contractions of the heart. The creatine kinase (CK) reaction is a major energy reserve that rapidly converts creatine phosphate (PCr) to ATP during the cardiac cycle and times of stress and ischemia, but is significantly impaired in conditions such as hypertrophy and heart failure. Because the magnitude of possible in vivo cyclic changes in cardiac high-energy phosphates (HEPs) during the cardiac cycle are not well known from prior work, this study uses mathematical modeling to assess whether and to what extent, cyclic variations of HEPs and in the rate of ATP synthesis through CK (CK flux) could exist in the human heart, and whether they could be measured with current in vivo phosphorus magnetic resonance spectroscopy (31P MRS) methods. Multi-site exchange models incorporating enzymatic rate equations were used to study cyclic dynamics of the CK reaction, and Bloch equations were used to simulate 31P MRS saturation transfer measurements of the CK reaction. The simulations show that short-term buffering of ATP by CK requires temporal variations over the cardiac cycle in the CK reaction velocities modeled by enzymatic rate equations. The maximum variation in HEPs in the normal human heart beating at 60min−1 was approximately 0.4mM and proportional to the velocity of ATP hydrolysis. Such HEP variations are at or below the current limits of detection by in vivo 31P MRS methods. Bloch equation simulations show that 31P MRS saturation transfer estimates the time-averaged pseudo-first-order forward rate constant, kf,ap’, of the CK reaction and that periodic short-term fluctuations in kf’ and CK flux are not likely to be detectable in human studies employing current in vivo 31P MRS methods.
Keywords: Creatine kinase reaction, ATP, creatine phosphate, high-energy phosphates, cyclic variations, mathematical modelling, 31P MRS
Graphical Abstract
Introduction
The cyclic process of myocardial contraction and relaxation is fueled by the hydrolysis of adenosine triphosphate (ATP) to adenine diphosphate (ADP) and inorganic phosphate (Pi). The main sources of ATP production are mitochondrial oxidative phosphorylation and, to a lesser extent, glycolysis. The creatine kinase (CK) reaction reversibly converts creatine phosphate (PCr) and ADP to creatine (Cr) and ATP (1):
| [1] |
where kf and kr are the reaction rate constants of the CK reaction. The CK reaction is considered to be the primary energy reserve for the heart, maintaining relatively constant ATP and ADP levels over the cardiac cycle and during periods of increased cardiac work (2,3).
Phosphorus (31P) magnetic resonance spectroscopy (MRS) and 31P MRS saturation transfer techniques are the only non-invasive means of quantifying high-energy phosphates (HEPs), the reactants and products of the CK reaction, as well as the reaction velocity of ATP synthesis through CK (CK flux). MRS approaches have been used in vitro in isolated cells, ex vivo in perfused hearts and in vivo to study cardiac HEPs and the CK reaction (4-6). Unlike skeletal muscle where HEPs decline during continuous muscle contraction, myocardial levels of both ATP and PCr are unchanged during increased workloads, or show only minor changes with severe cardiac stress (6-10). Such observations suggest a tight coupling between ATP production and hydrolysis in the heart, in concert with energy buffers like the CK reaction. Additionally no changes in time-averaged myocardial CK flux were observed during increased workloads in healthy human subjects (6), suggesting that the CK reaction in the heart buffers short-term changes in ATP hydrolysis differently than skeletal muscle.
Reaction velocities of myocardial ATP hydrolysis are not constant over the cardiac cycle as suggested by older calorimetric studies indicating that about 75% of ATP consumption occurs during the systolic heart phase (11,12). Small changes in myocardial HEPs have been reported during the cardiac cycle in some perfused rat heart studies (13-17) and in one in vivo rat study (18) but the latter to our knowledge has not been reproduced (19). Cyclic changes of HEPs have not been observed in large animals or humans in vivo (20-22). In order to stabilize ATP concentrations during the cardiac cycle in humans and large mammals, the major myocardial ATP buffers such as the CK reaction would need to cyclically augment ATP production during times of high ATP consumption. Besides preserving myocardial ATP concentrations, the CK reaction could help maintain low cytosolic concentrations of ADP, which would stabilize the concentration gradient between ATP and ADP and ensure that a large Gibb's free energy is available at the sites of ATP hydrolysis over the cardiac cycle (23).
However, CK activity and the time-averaged in vivo CK flux (the reaction velocity or rate of the CK reaction) are reduced by 50%-75% in common cardiovascular diseases including left ventricular hypertrophy, dilated cardiomyopathy and heart failure (6,24-26). Reduced CK buffering capacity in these conditions, along with depressed myocardial energetics, could predispose or accentuate fluctuations in HEPs during the cardiac cycle. If such variations did occur, then the reductions seen in the time-averaged myocardial HEP and ATP kinetics may underestimate the instantaneous energetic abnormalities occurring during the cardiac cycle.
Mathematical modeling can provide useful insights on the effects of increased work on ATP production, and how the intracellular concentrations of ATP, ADP, Pi, and creatine as well as CK activity regulate myocardial energy metabolism (27-32). However, to our knowledge, such simulations have not addressed possible temporal variations in CK reaction velocities, nor whether such variations could affect the stability of HEP levels, and the feasibility of detecting temporal variations in the CK flux by 31P MRS methods in the healthy or diseased human heart.
In the current work two-site and multi-site exchange models incorporating enzymatic rate equations are used to investigate possible cyclic fluctuations of HEPs and the effects of cyclic variations of CK flux in the human heart. Bloch equation simulations are then performed to explore whether theoretically plausible changes in HEPs and CK flux from the enzymatic modeling could potentially be detected by state-of-the-art non-invasive 31P MRS techniques in vivo.
Methods
Limits on HEP and CK flux variation based on two-site exchange
We first assumed a two-site exchange model restricted to ATP and PCr sites, which forms the theoretical basis of 31P MRS saturation transfer methods (33,34), to explore the potential limits of HEP and CK flux variations (Figure 1a, b). The two-site exchange model from Figure 1(b) is described by a differential equation system
| [2] |
| [3] |
| [4] |
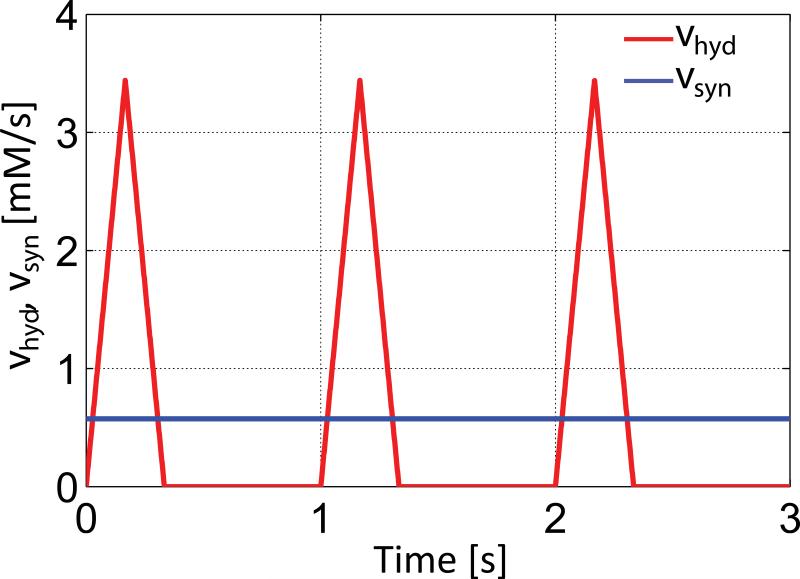
Here CPCr and CATP are the cytosolic concentrations of PCr and ATP, vCK,f and vCK,r are the reaction velocities of the CK reaction in forward and reverse directions, and vsyn and vhyd are the synthesis and hydrolysis velocities of ATP, respectively. Within this limited picture of a two-site exchange model (Figure 1b) kf’ and kr’ denote the forward and reverse rate constants of the CK reaction which are directly accessible by 31P MRS magnetization transfer methods and are often referred to as pseudo-first-order rate constants in the literature (5,6,24-26,33-35). However, kf’ and kr’ are only constant if all substances involved in the CK reaction and not included in Equations [2]-[4] are constant. Note that kf’ and kr’ and are not identical to the reaction rate constants kf and kr of the CK reaction from Equation [1]. The steady-state values of C and k’ used for the simulations were taken from the literature as summarized in Table 1. To convert concentration values from [μmol/g wet wt] in the literature to [mmol/L], a cytosolic volume 0.725 ml/g was assumed (36). The value of kr’ for transfer from ATP to PCr was calculated by the equilibrium equation kr’ = kf’*CPCr/CATP. Variations in ATP hydrolysis during the cardiac cycle were modeled according to a temporal repetitive variation of vhyd(t) at a 1 sec time interval corresponding to a heart-rate of 60 min−1 (Figure 2). The velocity of ATP synthesis from ADP and Pi, vsyn was assumed constant over the cardiac cycle, and equal to the temporal mean ATP hydrolysis velocity, vhyd (Figure 2).
Figure 1.
Schematics of the investigated models. a) Schematic of the creatine kinase reaction b) Two-site exchange model between ATP and PCr pools. c) Model based on enzymatic rate equations to study temporal variation of forward (green) and reverse (orange) CK flux including ATP synthesis from ADP and Pi (blue) and hydrolysis (red). The letters k’ and v stand for the pseudo-first-order rate constants and reaction velocities, respectively.
Table 1.
Parameters used in the study.
| Parameter | Value | Source |
|---|---|---|
| CK equilibrium constant [(mmol/L)−1] | ||
| Keq | 1.66*109 | (54) |
| Concentrations [mmol/L] | ||
| CATP | 7.9 | (6) |
| CPCr | 13.9 | (6) |
| CCr | 24.1 | (6) |
| CPi | 1.38 | assumed |
| CADP | 0.09 | CADP=CATP*CCr/(Keq*CPCr*[H+]) |
| CK rate constants [1/s] | ||
| kf' | 0.33 | (6) |
| kr' | kf*CPCr/CATP | |
| ATP reaction rates [mmol/L/s] | ||
| vhyd temp. mean | 0.573 | (6,55) |
| vsyn | 0.573 | equilibrium with vhyd |
A pH of 7.05 was assumed for the calculations.
Figure 2.
Temporal variation of the ATP hydrolysis (vhyd) and synthesis (vsyn) reaction velocity shown for three cardiac cycles with a heart-rate of 60min−1. While a heterogeneous ATP hydrolysis was modeled, ATP synthesis from ADP and Pi was assumed constant for the two-site exchange model. ATP hydrolysis was assumed to only take place during systole in the first third of the cardiac cycle.
Variations in HEPs were studied for three cases with: (1) kf’(t) and kr’(t) held constant over the cardiac cycle; (2) kf’ and kr’ equal to zero, to simulate the extreme case of no CK reaction; and (3) holding kr’(t) constant while allowing kf’(t) to vary freely to maintain a constant ATP level throughout the cardiac cycle.
CK flux variations based on enzymatic rate equations
While the two-site exchange model can be used to study how CK flux can produce cyclic variations in HEP, it does not provide a theoretical basis for possible transient changes in the CK reaction velocities and HEPs, and moreover neglects many metabolites that are involved in the CK reaction but are not necessarily detectable by 31P MRS. Therefore, the two-site exchange model shown in Figure 1(b) was extended to include ADP, Cr and Pi, as shown in Figure 1(c). This leads to an extended set of differential equations:
| [5] |
| [6] |
| [7] |
| [8] |
| [9] |
where vCK,f, vCK,r, vsyn and vhyd are the reaction velocities of the forward and reverse CK reaction, ATP synthesis from ADP and Pi, and ATP hydrolysis, respectively. Like in the two-site exchange model, variations in ATP hydrolysis during the cardiac cycle were modeled according to a temporal repetitive variation of vhyd(t) at a 1 sec time interval corresponding to a heart-rate of 60min−1 (Figure 2). The reaction velocities of the CK reaction are given by equations derived in (37,38) that describe a sequential, rapid equilibrium, random, enzymatic reaction mechanism. These equations were previously shown to yield results consistent with experimental data from 31P MRS saturation transfer studies, and were used to calculate the maximum reaction velocity for the CK reaction–or CK activity Vmax–from measured transfer velocities vCK and vice versa (35,39,40):
| [10] |
| [11] |
with
| [12] |
and
| [13] |
Here kf and kr are the true unidirectional rate constants of the CK reaction (Equation [1]) and et is the total enzyme concentration (37), all assumed constant over the cardiac cycle. Steady-state concentrations of ATP, PCr and Cr were the same as for the two-site model (Table 1) and the ADP concentration, CADP, calculated from the equilibrium equation for the CK reaction (Table 1).
Kia(ATP), Kib(Cr), Kic(ADP) and Kid(PCr) are the binary dissociation constants for ATP and CK, Cr and CK, ADP and CK, and PCr and CK complexes, respectively. Kb(Cr) is the ternary dissociation constants of Cr in a complex of CK, ATP and Cr, Kc(ADP) is the ternary dissociation constants of ADP in a complex of CK, ADP and PCr and Kd(PCr) is the ternary dissociation constants of PCr in a complex of CK, ADP and PCr. Please refer to references (37,38) for a detailed description of the binary and ternary dissociation constants in Equation [10] to [12].
The effect of ADP and Pi concentrations on the oxidative synthesis of ATP was modeled by a Michealis-Menten equation for two substrates (30):
| [14] |
| [15] |
KADP and KPi are the Michaelis-Menten constants for ADP and Pi, respectively. The values for the Michaelis-Menten constants, and the binary and ternary dissociation constants were taken from the literature and are listed in Table 2. The steady-state concentration of Pi, CPi, was assumed to be 1μmol/g wet wt (Table 1). The maximum forward reaction velocity for the CK reaction, Vmax,f, was calculated from Equation [10] and the ancillary equations, assuming a steady-state CK flux equal to the product of kf’ and CPCr from Table 1 for 100% CK activity. CK activities of 50%, 30% and 10% were then simulated by reducing Vmax,f accordingly. The maximal reverse CK reaction velocity (for PCr production) was calculated using the Haldane relation (Table 2). The maximal reaction velocity of ATP synthesis from ADP and Pi, Vmax,syn, was adjusted to match the temporal mean of ATP hydrolysis using the temporal mean values of ADP and Pi and Equation [14]. One hundred cardiac cycles were used to allow the equation system to equilibrate for every simulation.
Table 2.
Dissociation constants and maximal reaction velocities of the CK reaction used in the study.
| Parameter | Value | Source |
|---|---|---|
| Dissociation constants [mmol/L] | ||
| Kia(ATP) | 0.9 | (27,30) |
| Kib(Cr) | 34.9 | (27,30) |
| Kb(Cr) | 15.5 | (27,30) |
| Kid(PCr) | 4.73 | (27,30) |
| Kd(PCr) | 1.67 | (27,30) |
| Kic(ADP) | 0.2224 | (27,30) |
| Kc(ADP) | Kic(ADP)*Kd(PCr)/Kid(PCr) | (30) |
| KADP | 0.025 | (30) |
| KPi | 0.8 | (30) |
| Max. reaction velocity [mmol/L/s] | ||
| Vmax,f | 41.711 | kf and equ. [9] |
| Vmax,r | Vmax,f*(Kia*Kb*[H+])/(Keq*Kic*Kd) | (38) |
A pH of 7.05 was assumed for the calculations.
The CK reaction was studied with CK activities of 100%, 50%, 30% and 10% of previously reported normal values, corresponding to what might be observed in mild (50%) and moderate (30%) heart failure or under extreme conditions (10%) (6,24-26). To investigate the influence of different CK activity on mean and temporal HEP variations during the cardiac cycle, the model was studied with the maximal reaction velocities (CK activity), Vmax,f and Vmax,r, adjusted for cardiac work loads corresponding to heart-rates of 60min−1 to 120min−1. ATP hydrolysis and synthesis were increased proportionate to the heart rate to maintain a constant amount of ATP hydrolyzed per cardiac cycle to reflect HEP homeostasis, as observed experimentally. An increase in heart rate and cardiac workload can be expected with physical activity. To investigate the effect of an increased cardiac workload at a constant heart rate (as may occur for example with high blood pressure), two- and three-fold increases in ATP hydrolysis were also investigated. While the ATP hydrolysis velocity, vhyd, was changed directly, ATP synthesis from ADP and Pi was varied by adjusting the maximal velocity Vmax,syn in Equation [14].
The free energy change of ATP hydrolysis, or Gibbs free energy, ΔG~ATP, was determined via (41):
| [16] |
where ΔG0 is the standard free energy change, R is the universal gas constant and T is the absolute temperature.
Detecting cyclic fluctuations in HEPs and CK flux with 31P MRS
To investigate whether current in vivo 31P MRS saturation transfer methods could detect possible cyclic changes in CK flux, numerical simulations of the Bloch equations modified for two-site chemical exchange between PCr and ATP were performed (33). Empirical-based longitudinal (T1) and transverse (T2) relaxation times of T1,PCr = 7s, T1,ATP = 5.4s and T2,PCr = 0.1s, T2,ATP = 0.05s (34,42) were assumed for the intrinsic T1 and T2 relaxation times at 3 Tesla for the PCr and the γ-ATP resonance, respectively. As a best-case scenario that avoids any spillover saturation of PCr, a (unrealistic) chemical shift of 7 kHz between PCr and γ-ATP was assumed. To eliminate any relaxation effects, the sequence repetition time (TR) was set at 60s. Saturation of the γ-ATP resonance was maintained during the entire TR period. The magnetization M0’ and M0 of PCr, respectively with and without γ-ATP saturated, were simulated. The apparent value of kf’, kf,ap’, delivered by the simulated saturation transfer experiment was calculated from:
| [17] |
Cyclic changes of the CK reaction were modeled using the results from the rate-mediated model based on the enzymatic equations (Figure 1c) for a 100% CK activity, kf’ was estimated from kf'(t) = vCK,f/CPCr after equilibrium was established. To test detectability of cyclic variations in kf’(t), simulations were performed at ten different trigger time points throughout the cardiac cycle separated by 100 ms, assuming a heart rate of 60 min−1.
Results
Limits on HEP and CK flux variation based on two-site exchange
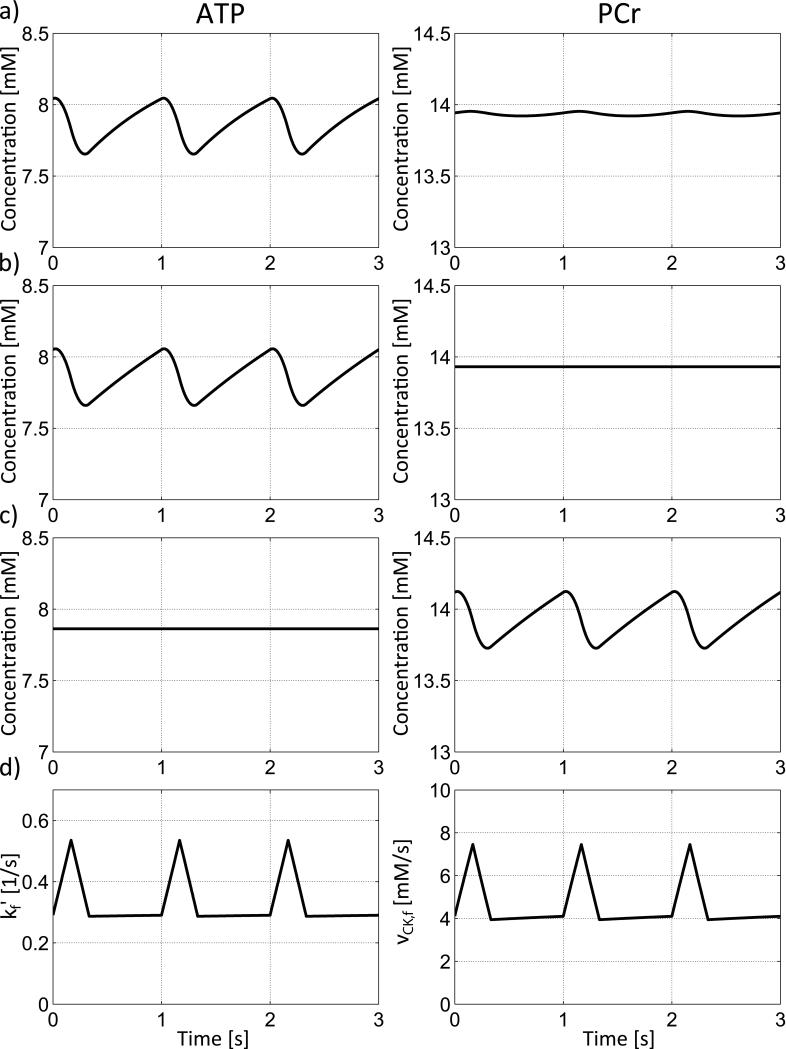
The effects of varying ATP utilization on HEP for the three cases considered are shown in Figure 3. In Case (1), kf’(t) and kr’(t) in equilibrium, constant throughout the cardiac cycle, and equal in value to previously reported time-averaged values, the variations in ATP hydrolysis are only weakly transferred to the PCr pool. This results in a strong variation in CATP that is barely buffered by the CK reaction (Figure 3a). The changes in CPCr are very small indicating that the net flux from PCr to ATP is tiny. The change in ATP is approximately 0.4mM for the healthy human heart at rest, as assumed.
Figure 3.
Variations of HEPs, kf’ and CK flux based on the two-site exchange model in Figure 1b. a) Case (1): if kf’ and kr’ are static over time, buffering of the variations in ATP by the PCr pool is very small. b) Case (2): if both, kf’ and kr’ are equal to zero, no exchange between ATP and PCr occurs and ATP is not buffered by the PCr pool. c) Case (3): if kf’ (PCr to ATP conversion) is variable over time, changes in ATP can be completely mediated to the PCr pool. d) Variation in kf’ (PCr to ATP conversion) and CK flux (product of kf’ and CPCr) when variations in ATP are fully buffered (Case(3)). Three cardiac cycles are show at a heart rate of 60min−1.
In Case (2) wherein both kf’ and kr’ are set to zero as if the CK reaction does not exist, the effect is very similar. The temporal heterogeneous ATP hydrolysis results in strong variations of the ATP concentration with variations of ≈0.4mM (Figure 3b). Because of the missing flux between PCr and ATP, CPCr does not vary over time. The difference between Case (1) with kf’ and kr’ held constant over time (Figure 3a) and Case (2) with kf’ = kr’ =0, (Figure 3b) is small.
However, in Case (3) wherein kf’(t) is allowed to change over time, variations in the ATP pool can be fully transferred to the PCr pool. In this way, changes in ATP are buffered by the CK reaction (Figure 3c). Figure 3(d) shows both the variation in kf’(t) and the forward CK flux, equal to the product of kf’(t) and CPCr. The magnitude of variations in the PCr pool for Case (3) is proportional to ATP hydrolysis, and similar to the variations in CATP for Cases (1) and (2): about 0.4mM. The magnitude of the buffering efficiency depends on the temporal change in kf’(t) and/or kr’(t).
CK flux variations based on enzymatic rate equations
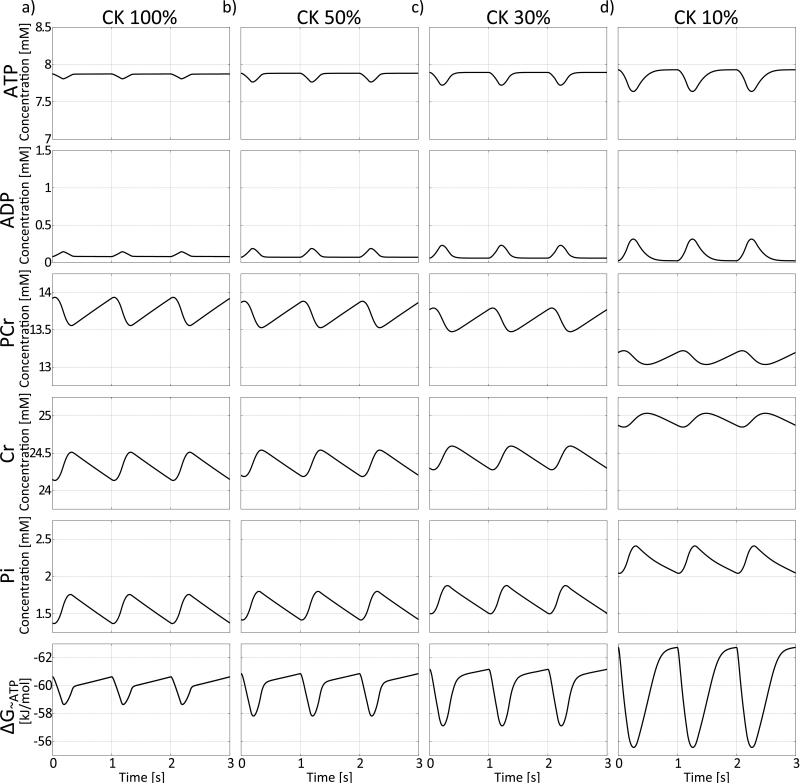
The effect of incorporating the enzymatic rate equations into the exchange model (Figure 1c, Equations 5-15) at a baseline heart rate of 60min−1 and a CK activity of 100% is shown in Figure 4(a). The temporal variation in ATP hydrolysis during the cardiac cycle produces the largest variations in the PCr and Cr pools, with much smaller absolute variations in ATP and ADP concentrations. Thus, the enzymatic rate equations are very effective in buffering temporal variations in the ATP pool during the cardiac cycle in the model healthy heart. Decreasing CK activity to 50% (Figure 4b), increases the temporal variations in ATP and ADP. Consequently, the ATP buffering capacity provided by the CK reaction, and the temporal variation in PCr and Cr, are all decreased. The temporal variations in ATP and ADP are further increased as CK activity is further decreased to 30% (Figure 4c) and 10% (Figure 4d).
Figure 4.
Temporal variations of ATP, ADP, PCr, Cr and Pi on basis of the enzymatic rate equation model from Figure 1c. (a) If CK activity is 100% variations in ATP and ADP are widely buffered by the PCr and Cr pool. When CK activity is reduced to 50% (b), 30% (c) or only 10% (d), variations in ATP and ADP become more prominent based on decreased buffering by the PCr and Cr pools. Variations in Pi concentration are slightly decreased with decreasing CK activity. Temporal mean concentrations of Cr, Pi and ADP are increased and temporal mean concentrations of PCr and ATP are slightly decreased with decreasing CK activity. At times of decreased ATP and increased ADP the energy available from the Gibbs free energy of ATP hydrolysis, ΔG~ATP, is reduced because of a decreased gradient between ATP and ADP. Variations in ΔG~ATP are increased with decreasing CK activity limiting available energy from ATP hydrolysis especially at time of high ATP usage during the cardiac cycle. Three cardiac cycles are show at a heart rate of 60min−1.
The free energy change of ATP hydrolysis, ΔG~ATP, is also plotted in Figure 4 for 100%, 50%, 30% and 10% CK activity. As the cyclic variations in ADP and ATP increase with decreasing CK activity, the variation in ΔG~ATP increases. In addition, an increase in the temporal mean concentration of Pi and ADP leads to a further increase (less negative) in ΔG~ATP, which means that a smaller free energy of ATP hydrolysis is available at times of high ATP consumption.
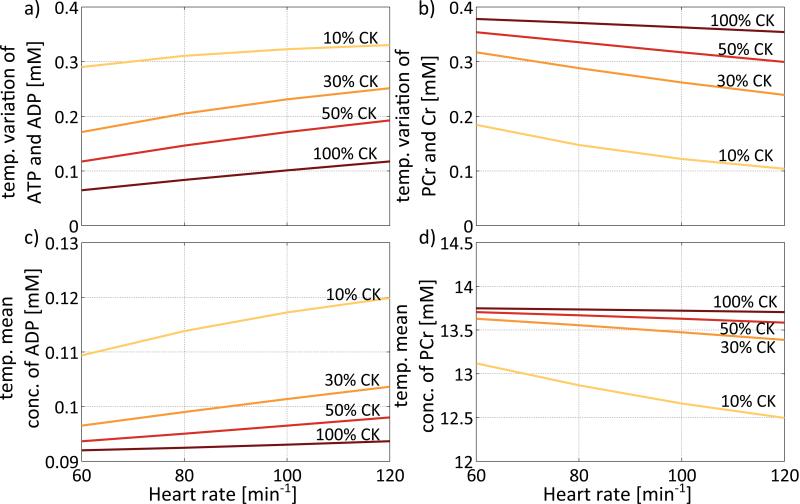
Temporal variations of HEPs not only depend on CK activity, but also on cardiac work load. Maximal temporal variations during the cardiac cycle of 0.33mM are predicted for ATP and ADP at 10% CK activity, and a heart rate of 120min−1 (Figure 5a). Although small in absolute terms, this amounts to ~366% of the mean concentration of ADP at 100% CK activity. Buffering of the CK reaction in this model is most efficient at high CK activity and low heart rates. For PCr and Cr maximal cyclic variations of 0.38mM are observed at 100% CK activity and the lowest cardiac workload of 60min−1 (Figure 5b). Again, the cyclic variations in ATP and ADP increase while those in PCr and Cr attenuate as CK activity decreases, reflecting the reduced efficacy of the CK reaction as a short-term ATP buffer.
Figure 5.
Variations during the cardiac cycle and temporal mean values of HEPs dependent on CK activity and heart rate. While variations in the ATP and ADP pools are increased with decreasing CK activity and increasing heart rate (a), variations in the PCr and Cr pools are decreased with decreasing CK activity and increasing heart rate (b). Similarly, while mean ADP concentration increases with decreasing CK activity and increasing heart rate (c), mean PCr concentration decreases with decreasing CK activity and heart rate (d). In the model changes in heart rate are accompanied by proportional changes in ATP hydrolysis velocity vhyd and maximum ATP synthesis velocity Vmax,syn to simulate increased cardiac work load.
Even so, changes in the temporal-mean concentrations of ATP and ADP (Figure 5c) remain small in absolute terms as workload is doubled. At 100% CK activity the temporal mean concentrations of ATP and ADP were 7.86mM and 0.09mM, respectively, varying by <0.002mM with work load. The temporal mean concentration of ATP decreased to 7.83mM and ADP increased to 0.12mM as CK activity was reduced to 10% at the highest (120min−1) work load. Although again small in absolute terms, for ADP this amounted to a ~33% relative increase in mean concentration.
Figure 5(d) shows how the temporal mean concentration of PCr depends on CK activity and heart rate. At 100% CK activity the mean PCr and Cr levels are 13.7mM and 24.3mM, respectively, varying by <0.05mM with heart rate. However, the mean concentration of PCr decreases and that of Cr increases as CK activity decreases, and also as cardiac work load increases. At 10% CK activity, the mean PCr level falls to 12.5mM at a heart rate of 120 min−1 while Cr rises to a temporal mean of 25.5mM.
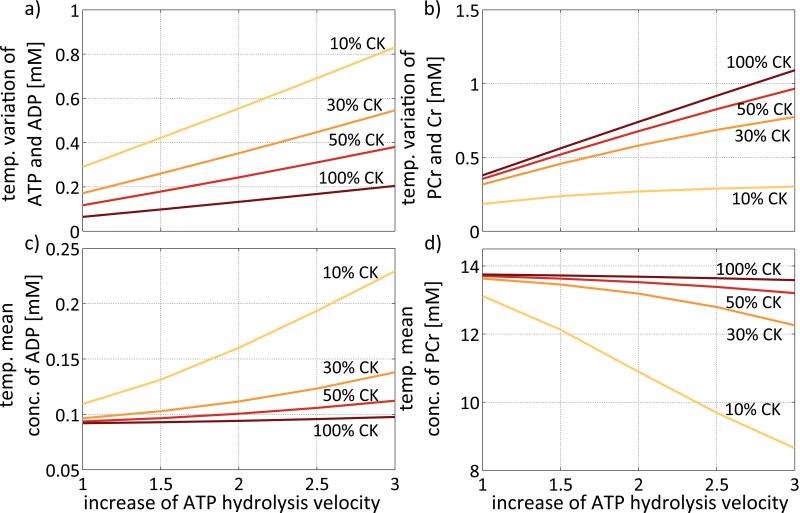
The effects of increasing ATP hydrolysis at a constant heart rate of 60min−1 are shown in Figure 6. In the extreme case of 10% CK activity and a threefold increase in ATP hydrolysis, the variation of ATP and ADP concentration over the cardiac cycle amounts to 0.83mM (Figure 6a). Maximal temporal variations of 1.1mM in PCr and Cr occur with 100% CK activity and a threefold increase in ATP hydrolysis (Figure 6b).
Figure 6.
Variations during the cardiac cycle and temporal mean values of HEPs dependent on CK activity and ATP hydrolysis velocity at a constant heart rate of 60min−1. While variations in the ATP and ADP pools are increased with decreasing CK activity and increasing ATP hydrolysis (a), variations in the PCr and Cr pools are increased with increasing CK activity and increasing ATP hydrolysis velocity (b). Similarly, while ADP concentration increases with decreasing CK activity and increasing ATP hydrolysis velocity (c), PCr concentration increases with decreasing CK activity and increasing ATP hydrolysis velocity (d). In this model changes in ATP hydrolysis velocity are accompanied by proportional changes in maximum ATP synthesis velocity from ADP and Pi to provide equilibrium between ATP production and consumption.
Figure 6(c) shows the dependence of the temporal mean cytosolic ADP level on CK activity and ATP hydrolysis velocity. For 100% CK activity and a normal ATP hydrolysis velocity, the temporal mean concentrations of ATP and ADP are 7.86mM and 0.09mM, varying little (< 0.006mM) as ATP hydrolysis is increased up to threefold. Mean ATP levels decrease and ADP increase with decreasing CK activity. At 10% CK activity, mean ATP decreases to 7.72mM and ADP increases to 0.23mM when the ATP hydrolysis velocity is increased threefold. Again, while in absolute terms the changes in mean ADP concentrations were small (0.14mM in Figure 6c), this corresponds to an increase to 155% in the mean cytosolic free ADP level.
Figure 6(d) shows the dependence of the temporal mean concentration of PCr on CK activity and the ATP hydrolysis velocity. For 100% CK activity and a normal ATP hydrolysis velocity, the temporal mean concentrations of PCr and Cr are 13.7mM and 24.3mM, respectively. These change only slightly to 13.6mM and 24.5mM, respectively, with a threefold increase in the ATP hydrolysis velocity. On the other hand, when CK activity is decreased to 10%, PCr decreases to 8.6mM and Cr increases to 29.4mM following the three-fold increase in ATP hydrolysis. This represents a 5mM variation in both pools in opposite directions, as required by conservation of mass.
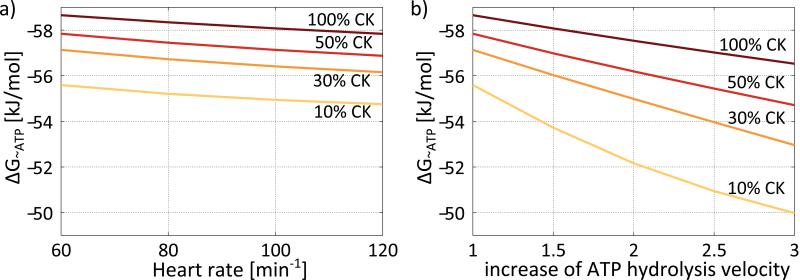
Figure 7 shows the dependence of the free energy of ATP hydrolysis, ΔG~ATP, at systole on heart rate and ATP hydrolysis velocity. The released energy per mole of ATP hydrolyzed is always highest for 100% CK activity, gradually decreasing with CK activity. At baseline and 10% CK activity the energy released during ATP hydrolysis is ~3kJ/mol lower compared to 100% CK activity (ΔG~ATP ~56kJ/mol vs ~59kJ/mol). While the decrease in ΔG~ATP with increasing heart rate is small and comparable for all CK activities tested (Figure 7a), the decrease in ΔG~ATP with increasing ATP hydrolysis is more pronounced at reduced CK activity (Figure 7b) leading to a maximum difference in ΔG~ATP of ~7kJ/mol between 10% and 100% CK activity at the threefold higher ATP hydrolysis velocity (ΔG~ATP ~50kJ/mol vs ~57kJ/mol).
Figure 7.
Free energy of ATP hydrolysis, ΔG~ATP, at systole for 100%, 50%, 30% and 10% CK activity dependent on heart rate (a) and increase of ATP hydrolysis (b). The energy available from ΔG~ATP is highest for 100% CK activity and decreases slightly with increasing heart rate (a). The decrease of the energy available from ΔG~ATP with increased of ATP hydrolysis is more pronounced compared to that with heart rate and stronger with decreasing CK activity (b).
As expected, lower CK activity reduces the temporal mean values of CK reaction velocities, vCK,f and vCK,r (Figure 8a,b). It also reduces the magnitude of the cyclic variation in vCK,f, especially when CK activity falls to 10% (Figure 8a). While cyclic variations of ATP synthesis velocity vsyn from ADP and Pi show only small increases at 50% and 30% compared to 100% CK activity (Figure 8c), the variations of ATP synthesis from ADP and Pi are much greater at 10% CK activity (Figure 8c).
Figure 8.
Variations of the forward (CK flux) and reverse reaction velocities vCK,f (a) and vCK,r (b) of the CK reaction and vsyn (c) of ATP synthesis from ADP and Pi. The four considered cases of 100%, 50%, 30% and 10% CK activity and three cardiac cycles at a heart rate of 60min−1 are shown. Both vCK,f and vCK,r are reduced with decreasing CK activity. Beside the temporal mean values, also the magnitude of cyclic variations of vCK,f are reduced (a). While cyclic changes in vsyn are small for 100% CK activity and only slightly increased for 50% and 30% CK activity, cyclic variations in vsyn are dramatically increased for 10% CK activity indicating a stronger challenge of the ATP synthesis system at very low CK activities.
Detectability of cyclic fluctuations in HEPs and CK rates by 31P MRS
The maximum variation in PCr at a heart rate of 60min−1 in the normal heart predicted by the models is 0.38mM. The limit of these variations is proportional to the total ATP hydrolysis velocity of 0.57mM/s. The maximum variation in PCr increases to 1.1 mM with a threefold increase in ATP hydrolysis velocity.
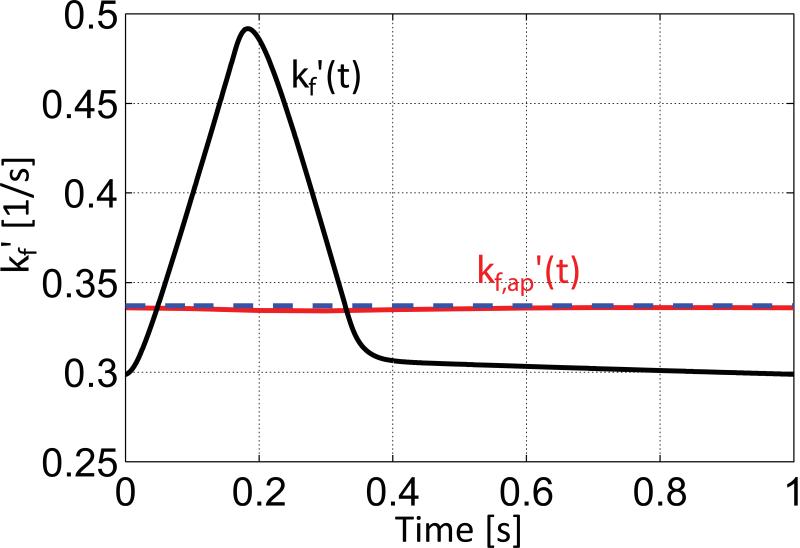
The values of kf’(t) estimated from the multi-site exchange model incorporating the enzymatic rate equations (Figure 1c) are plotted in Figure 9. The enzymatic rate equations predict a 1.7-fold increase in kf’ at peak systole (black curve). However, when this transient response is input to the Bloch equation simulation of the saturation transfer experiment, the pulsatile behavior is virtually entirely smoothed to an apparent curve with kf,ap’(t) values ranging from 0.334s−1 to 0.336s−1 (red curve). The predicted result of the MRS experiment is indistinguishable from the temporal mean value of of kf’(t) =0.34s−1 for the pulsatile response (blue dashed line). This means that the conventional saturation transfer experiment would be unable to detect the cyclic changes in kf’ predicted by the multi-site enzymatic rate equation model.
Figure 9.
kf’(t)=vCK,f(t)/CPCr(t) of the CK reaction as found with the multi-site exchange model with enzymatic rate equations (black) and the apparent kf,ap’(t) as estimated by Bloch equation simulation of the 31P MRS saturation transfer method (red). The estimated values kf,ap’(t) do not follow the cyclic variations of kf’(t) and cannot be distinguished from the temporal average of kf’(t) indicated by the blue dashed line.
Discussion
The importance and role of the CK reaction as a temporal ATP energy buffer and spatial shuttle of HEP to support myocyte contraction in the heart are still a subject of discussion (23,43). Previous studies have found that CK activity is reduced in heart failure and other cardiovascular diseases (6,24-26), suggesting that the failing heart may be limited by energy availability (44). There has been much discussion about whether there are variations in HEPs during the cardiac cycle and if so, whether they can be measured. Contradictory results have been published and hitherto no clear answer has arisen (13-19). The main focus of the current work was to investigate the flexibility of the CK reaction and the in vivo magnitude and accessibility of potential variations in HEPs and CK flux to detection by 31P MRS methods.
The results of the two-site exchange model (in Figure 1b) indicate that the CK reaction is barely able to buffer the variations in ATP concentration imposed by temporally heterogeneous ATP hydrolysis if kf’ and kr’ are assumed to be static (Figure 3a). It can therefore be concluded that variations in ATP imposed by temporally heterogeneous ATP hydrolysis can be effectively buffered by the CK reaction only if kf’ and kr’ are allowed to vary during the cardiac cycle. Although kf’ and kr’ are equal at steady-state, transient variations to allow additional generation of ATP by the CK reaction and are confirmed by analysis of the enzymatic rate equations, and provide a theoretical basis for the temporal adaptation of fluxes between PCr and ATP that is consistent with prior work (27,31) and 31P MRS measurements in rats (39).
In considering whether kf’(t), often termed the pseudo-first-order rate constant (5,6,24-26,33-35) could change with time, it is important to recognize that kf’ is determined from vCK,f/CPCr, and can be constant only if all other reactants in Figure 1(b) are constant. When this is not true, as here, kf’ is time-dependent and it is not equal to the true rate constant kf of the CK reaction in Equation [13], even though its temporal mean is equal to the apparent kf,ap’ observed by 31P MRS (Table 1) which we set as a boundary condition. As CK activity is reduced, the buffering of variations in ATP is reduced as well, resulting in increased variations in ATP and ADP and decreased variations in PCr and Cr (Figure 4). Thus, in cardiovascular diseases such as heart failure with reduced CK activity, an increased variation in ATP and ADP, and a decreased variation in PCr and Cr, is expected. During conditions of increased ATP hydrolysis, such as during exercise or stress, variations in ATP and ADP would be exaggerated. Because the temporal mean concentration of ADP is low (0.09mM assumed here), the relative variations in ADP during the cardiac cycle at low CK activity would be greatly exacerbated, increasing by up to 366%. The CK reaction with high CK activity would reduce these variations (Figure 5a). When CK activity is reduced, the higher ATP and ADP fluctuations would also reduce the energy available from ATP hydrolysis (-ΔG~ATP) in periods of high ATP consumption. This would limit the maximum available energy during peak demand (Figure 4d, Figure 7). The maximum cyclic variation in ATP and PCr levels are dictated by time-varying ATP-hydrolysis and are tempered by ATP buffers like the CK reaction.
We focused on the CK reaction with ATP synthesis from ADP and Pi based on a Michaelis-Menten relationship (Equation 14) as used elsewhere (27,30,31). Because the latter accounts for oxidative ATP production only and neglects glycolysis and all factors affecting ATP synthesis other than the concentrations of ADP and Pi, the present analysis only approximately models the relationship between the CK reaction and ATP synthesis. In Figure 8(c) it can be seen that the ATP synthesis stimulated by ADP and Pi concentrations, also partly buffers the cyclic variation in ATP hydrolysis, providing high ATP synthesis during systole and reduced ATP synthesis during diastole. However, while these cyclic variations in ATP synthesis are small for 100% CK activity and only slightly increased for 50% and 30% CK activity, the reaction rate varies nearly 2-fold at 10% CK activity. Because coronary flow is low during systole and high during diastole, it can be speculated that these variations could present a serious challenge to ATP production, possibly resulting in a mismatch between ATP synthesis and hydrolysis. While this is beyond the scope of the current paper, it does underscore the potential importance of the CK reaction as a temporal buffer of ATP and ADP pools.
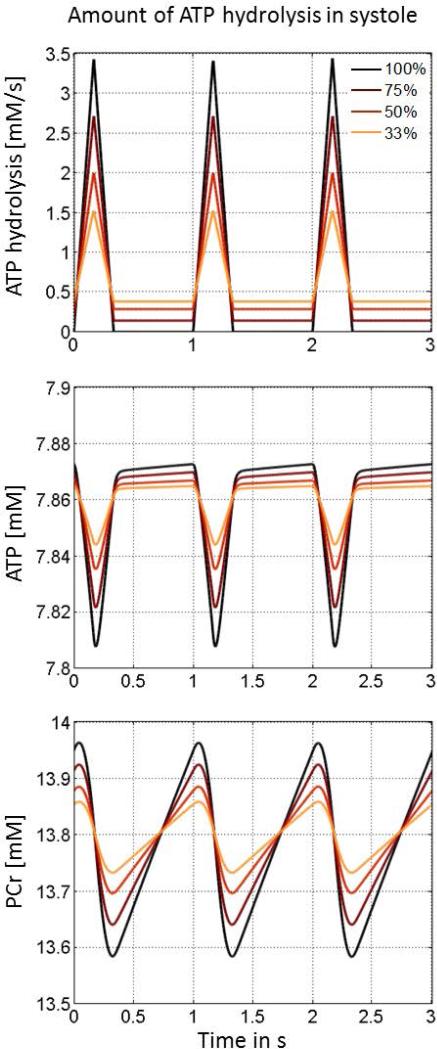
ATP hydrolysis was assumed to occur only during systole, which is also strictly not correct, as ATP is also consumed during diastole and older calorimetric studies suggest that about 75% of ATP consumption occurs during the systolic heart phase (11,12). However, for the purpose of identifying the upper limits of HEP variations, we believe that the assumption is useful (11,12,45,46), as a more temporally homogenous ATP hydrolysis would minimize HEP variations as shown in Figure 10. When CK activity is reduced, potential variations in ATP during the cardiac cycle are increased. When CK activity is high, the fluctuations are mostly observed in PCr, not ATP. The maximum variations in HEPs at baseline were only ≈0.4mM, and proportional to the velocity of ATP hydrolysis. Even a threefold increase in ATP hydrolysis produced temporal changes in HEPs of only ≈1mM which would be difficult to detect with current cardiac 31P MRS methods in human heart in vivo with experimental standard deviations of ~1mmol/kg wet wt (6,24,25,47). This may an explain why it has not yet been possible to measure such changes in the human heart in vivo, while providing insight on what advances in sensitivity would be needed in terms of sensitivity to make them accessible to 31P MRS.
Figure 10.
Temporal variations of ATP and PCr depending on the heterogeneity of ATP hydrolysis over the cardiac cycle. The temporal variations of HEPs are maximum for zero ATP hydrolysis during diastolic heart phase and decrease with increasing amount of ATP hydrolyzed during diastole.
From the Bloch simulations using the data from the enzymatic rate equation-mediated exchange model, it was found that 31P MRS saturation transfer methods provided an apparent kf,ap’ which is equal to the temporal mean of kf’(t) over the cardiac cycle, independent of the triggering time-point in the data acquisition sequence (Figure 9). This is caused by the time needed for the selective saturation of the γ-ATP resonance to reach a steady-state with the PCr resonance, and is of the order of several seconds. Although we used a long saturation period of 60s to be certain that all spins were at steady-state, in practice shorter saturation periods are often used and effective. If the simulations are re-run with a saturation time and TR of 1s in combination with dummy scans according to the FAST protocol (33), similar findings are observed to within 2%. This is good and bad news. As the kf,ap’(t) value measured by saturation transfer 31P MRS provides the temporal mean of the actual kf’(t) value over the cardiac cycle, the measured values will be independent of the measurement time point relative to the cardiac cycle, and studies that use or do not use ECG triggering or trigger at different times, should yield the same values. This might also be true for measurements of flux from ATP to Pi performed in pigs in vivo (48). It also means that short-term cyclic variations in human cardiac CK flux cannot be assessed by current 31P MRS saturation transfer methods in vivo. Note also that, because in vivo 31P MRS saturation transfer methods cannot distinguish between CK activities in different cell compartments, a single compartment for the CK reaction was assumed here and is sufficient for testing the main hypothesis.
Beyond the limitations imposed by the time needed to detect a change in kf’(t) with current saturation transfer methods, the primary limitation of 31P MRS is its low efficiency or sensitivity per unit time, in combination with the relatively high frequency of the cardiac cycle. Even if CK flux measurements were possible in tens or hundreds of milliseconds, the product of this time and the flux would still net only a sub-milli-molar transfer of metabolites, posing a significant challenge to detection. Opportunities for increasing SNR in these experiments include higher MRS magnetic fields such as 7T, which may however present additional hurdles of RF coil design, inhomogeneity in the excitation and main magnetic fields, and RF power limitations (49). The use of detector coil arrays for signal reception could also increase sensitivity (50-52), as indeed could the use of small intravascular coils, albeit not non-invasively (48,53).
All of the simulation parameters except ADP used in our study were based on values found in the literature. The values for ATP, PCr and Cr were taken from human in vivo studies. ADP was calculated from the equilibrium equation for the CK reaction because there are no in vivo values in the literature.
Conclusion
In conclusion this work shows that periodic variations in HEPs in the human heart can be expected to be <1mM in magnitude and proportional to the amount of ATP hydrolyzed and synthesized during a cardiac cycle. Reductions in CK activity in diseased and failing hearts raise the possibility that variations in ATP may be greater in diseased hearts. The two-site exchange model showed that effective buffering of short-term cyclic variations in the cardiac ATP concentration by CK would require that kf’ and kr’, often referred to as the unidirectional CK pseudo-first order reaction rate constants, be temporally adaptive, and this was confirmed by the multi-site model incorporating enzymatic rate equations for the CK reaction. However, predicted variations in HEPs at rest (on the order of <0.4mM) are projected to be too small to be reliably detected by current 31P MRS methods in the human heart in vivo. Finally, current 31P MRS saturation transfer methods applied to the human heart in vivo appear to provide temporal mean values kf,ap’, that are effectively independent of the measurement time-point relative to the cardiac cycle. Periodic short-term fluctuations in kf’ and CK flux do not presently appear to be detectable in human studies employing current in vivo 31P MRS methods.
Acknowledgments
This work was supported by NIH grants HL61912, HL63030, AG045634 and HL56332, by AHA grant 13GRNT17050100, the Clarence Doodeman Endowment and the Swiss National Science Foundation grant PBEZP3_145705.
List of abbreviations
- ATP
Adenosine triphosphate.
- ADP
Adenosine diphosphate.
- Pi
Inorganic phosphate.
- PCr
Creatine phosphate.
- Cr
Creatine.
- CK
Creatine kinase.
- 31P
Phosphorus.
- MRS
Magnetic resonance spectroscopy.
- HEPs
High-energy phosphates.
- CK flux
ATP synthesis through the creatine kinase reaction.
- kf
Reaction rate constants of the CK reaction in direction of ATP production.
- kr
Reaction rate constants of the CK reaction in direction of PCr production.
- kf’
Pseudo-first-order rate constants of the CK reaction in direction of ATP production.
- kr’
Pseudo-first-order rate constants of the CK reaction in direction of PCr production.
- kf,ap’
time-averaged pseudo-first-order rate constant of the CK reaction in direction of ATP production.
- Kia(ATP)
Binary dissociation constant of ATP.
- Kib(Cr)
Binary dissociation constant of Cr.
- Kic(ADP)
Binary dissociation constant of ADP.
- Kid(PCr)
Binary dissociation constant of PCr.
- Kb(Cr)
Ternary dissociation constant of Cr.
- Kc(ADP)
Ternary dissociation constant of ADP.
- Kd(ADP)
Ternary dissociation constant of PCr.
- T1
Longitudinal relaxation time constant.
- T2
Transversal relaxation time constant.
- TR
Repetition time.
Bibliography
- 1.Teague WE, Jr., Dobson GP. Effect of temperature on the creatine kinase equilibrium. The Journal of biological chemistry. 1992;267(20):14084–14093. [PubMed] [Google Scholar]
- 2.Ingwall JS, Kramer MF, Fifer MA, Lorell BH, Shemin R, Grossman W, Allen PD. The creatine kinase system in normal and diseased human myocardium. N Engl J Med. 1985;313(17):1050–1054. doi: 10.1056/NEJM198510243131704. [DOI] [PubMed] [Google Scholar]
- 3.Wallimann T. Bioenergetics: Dissecting the role of creatine kinase. Current Biology. 1994;4(1):42–46. doi: 10.1016/s0960-9822(00)00008-7. [DOI] [PubMed] [Google Scholar]
- 4.Radda GK, Seeley PJ. Recent studies on cellular metabolism by nuclear magnetic resonance. Annu Rev Physiol. 1979;41:749–769. doi: 10.1146/annurev.ph.41.030179.003533. [DOI] [PubMed] [Google Scholar]
- 5.Nunnally RL, Hollis DP. Adenosine triphosphate compartmentation in living hearts: a phosphorus nuclear magnetic resonance saturation transfer study. Biochemistry. 1979;18(16):3642–3646. doi: 10.1021/bi00583a032. [DOI] [PubMed] [Google Scholar]
- 6.Weiss RG, Gerstenblith G, Bottomley PA. ATP flux through creatine kinase in the normal, stressed, and failing human heart. P Natl Acad Sci USA. 2005;102(3):808–813. doi: 10.1073/pnas.0408962102. [DOI] [PMC free article] [PubMed] [Google Scholar]
- 7.Lamb HJ, Beyerbacht HP, Ouwerkerk R, Doornbos J, Pluim BM, van der Wall EE, van der Laarse A, de Roos A. Metabolic response of normal human myocardium to high-dose atropine-dobutamine stress studied by 31P-MRS. Circulation. 1997;96(9):2969–2977. doi: 10.1161/01.cir.96.9.2969. [DOI] [PubMed] [Google Scholar]
- 8.Balaban RS, Kantor HL, Katz LA, Briggs RW. Relation between Work and Phosphate Metabolite in the Invivo Paced Mammalian Heart. Science. 1986;232(4754):1121–1123. doi: 10.1126/science.3704638. [DOI] [PubMed] [Google Scholar]
- 9.Conway MA, Bristow JD, Blackledge MJ, Rajagopalan B, Radda GK. Cardiac metabolism during exercise measured by magnetic resonance spectroscopy. Lancet. 1988;2(8612):692. doi: 10.1016/s0140-6736(88)90510-7. [DOI] [PubMed] [Google Scholar]
- 10.Hudsmith LE, Tyler DJ, Emmanuel Y, Petersen SE, Francis JM, Watkins H, Clarke K, Robson MD, Neubauer S. P-31 cardiac magnetic resonance spectroscopy during leg exercise at 3 Tesla. Int J Cardiovas Imag. 2009;25(8):819–826. doi: 10.1007/s10554-009-9492-8. [DOI] [PubMed] [Google Scholar]
- 11.Monroe RG. Myocardial Oxygen Consumption during Ventricular Contraction and Relaxation. Circ Res. 1964;14:294–300. doi: 10.1161/01.res.14.4.294. [DOI] [PubMed] [Google Scholar]
- 12.Gibbs CL, Wendt IR, Kotsanas G, Young IR. The energy cost of relaxation in control and hypertrophic rabbit papillary muscles. Heart Vessels. 1990;5(4):198–205. doi: 10.1007/BF02058690. [DOI] [PubMed] [Google Scholar]
- 13.Fossel ET, Morgan HE, Ingwall JS. Measurement of Changes in High-Energy Phosphates in the Cardiac Cycle by Using Gated P-31 Nuclear Magnetic-Resonance. P Natl Acad Sci-Biol. 1980;77(6):3654–3658. doi: 10.1073/pnas.77.6.3654. [DOI] [PMC free article] [PubMed] [Google Scholar]
- 14.Tanaka K, Honda H, Akita N. A Gating P-31 Nmr Method Triggered by Pulses for Cardiac Pacing. NMR Biomed. 1992;5(6):329–334. doi: 10.1002/nbm.1940050602. [DOI] [PubMed] [Google Scholar]
- 15.Kusuoka H, Inoue M, Tsuneoka Y, Watari H, Hori M, Abe H. Augmented energy consumption during early systole as a mechanism of cyclical changes in high-energy phosphates in myocardium assessed by phosphorus nuclear magnetic resonance. Jpn Circ J. 1985;49(10):1099–1107. doi: 10.1253/jcj.49.1099. [DOI] [PubMed] [Google Scholar]
- 16.Illing B, Horn M, Urban B, Stromer H, Schnackerz K, de Groot M, Haase A, Hu K, Ertl G, Neubauer S. Changes of myocardial high-energy phosphates with the cardiac cycle during acute or chronic myocardial stress. Magn Reson Med. 1998;40(5):727–732. doi: 10.1002/mrm.1910400513. [DOI] [PubMed] [Google Scholar]
- 17.Honda H, Tanaka K, Akita N, Haneda T. Cyclical changes in high-energy phosphates during the cardiac cycle by pacing-Gated 31P nuclear magnetic resonance. Circ J. 2002;66(1):80–86. doi: 10.1253/circj.66.80. [DOI] [PubMed] [Google Scholar]
- 18.Toyo-oka T, Nagayama K, Umeda M, Eguchi K, Hosoda S. Rhythmic change of myocardial phosphate metabolite content in cardiac cycle observed by depth-selected and EKG-gated in vivo 31P-NMR spectroscopy in a whole animal. Biochem Biophys Res Commun. 1986;135(3):808–815. doi: 10.1016/0006-291x(86)91000-4. [DOI] [PubMed] [Google Scholar]
- 19.Koretsky A, Wang S, Murphy-Boesch J, Klein M, James T, Weiner M. 31P NMR spectroscopy of rat organs, in situ, using chronically implanted radiofrequency coils. Proceedings of the National Academy of Sciences. 1983;80(24):7491–7495. doi: 10.1073/pnas.80.24.7491. [DOI] [PMC free article] [PubMed] [Google Scholar]
- 20.Grist TM, Kneeland JB, Rilling WR, Jesmanowicz A, Froncisz W, Hyde JS. Gated cardiac MR imaging and P-31 MR spectroscopy in humans at 1.5 T. Work in progress. Radiology. 1989;170(2):357–361. doi: 10.1148/radiology.170.2.2911658. [DOI] [PubMed] [Google Scholar]
- 21.Balaban RS, Heineman FW. Control of mitochondrial respiration in the heart in vivo. Mol Cell Biochem. 1989;89(2):191–197. doi: 10.1007/BF00220775. [DOI] [PubMed] [Google Scholar]
- 22.Spindler M, Illing B, Horn M, de Groot M, Ertl G, Neubauer S. Temporal fluctuations of myocardial high-energy phosphate metabolites with the cardiac cycle. Basic Res Cardiol. 2001;96(6):553–556. doi: 10.1007/s003950170006. [DOI] [PubMed] [Google Scholar]
- 23.Saks V, Dzeja P, Schlattner U, Vendelin M, Terzic A, Wallimann T. Cardiac system bioenergetics: metabolic basis of the Frank-Starling law. J Physiol. 2006;571(Pt 2):253–273. doi: 10.1113/jphysiol.2005.101444. [DOI] [PMC free article] [PubMed] [Google Scholar]
- 24.Smith CS, Bottomley PA, Schulman SP, Gerstenblith G, Weiss RG. Altered creatine kinase adenosine triphosphate kinetics in failing hypertrophied human myocardium. Circulation. 2006;114(11):1151–1158. doi: 10.1161/CIRCULATIONAHA.106.613646. [DOI] [PMC free article] [PubMed] [Google Scholar]
- 25.Hirsch GA, Bottomley PA, Gerstenblith G, Weiss RG. Allopurinol acutely increases adenosine triphospate energy delivery in failing human hearts. J Am Coll Cardiol. 2012;59(9):802–808. doi: 10.1016/j.jacc.2011.10.895. [DOI] [PMC free article] [PubMed] [Google Scholar]
- 26.Bottomley PA, Panjrath GS, Lai SH, Hirsch GA, Wu K, Najjar SS, Steinberg A, Gerstenblith G, Weiss RG. Metabolic Rates of ATP Transfer Through Creatine Kinase (CK Flux) Predict Clinical Heart Failure Events and Death. Sci Transl Med. 2013;5(215) doi: 10.1126/scitranslmed.3007328. [DOI] [PMC free article] [PubMed] [Google Scholar]
- 27.Aliev MK, Saks VA. Compartmentalized energy transfer in cardiomyocytes: use of mathematical modeling for analysis of in vivo regulation of respiration. Biophys J. 1997;73(1):428–445. doi: 10.1016/S0006-3495(97)78082-2. [DOI] [PMC free article] [PubMed] [Google Scholar]
- 28.Wu F, Beard DA. Roles of the creatine kinase system and myoglobin in maintaining energetic state in the working heart. BMC Syst Biol. 2009;3:22. doi: 10.1186/1752-0509-3-22. [DOI] [PMC free article] [PubMed] [Google Scholar]
- 29.Kushmerick MJ. Energy balance in muscle activity: simulations of ATPase coupled to oxidative phosphorylation and to creatine kinase. Comp Biochem Physiol B Biochem Mol Biol. 1998;120(1):109–123. doi: 10.1016/s0305-0491(98)00026-1. [DOI] [PubMed] [Google Scholar]
- 30.van Beek JH. Adenine nucleotide-creatine-phosphate module in myocardial metabolic system explains fast phase of dynamic regulation of oxidative phosphorylation. Am J Physiol Cell Physiol. 2007;293(3):C815–829. doi: 10.1152/ajpcell.00355.2006. [DOI] [PubMed] [Google Scholar]
- 31.Hettling H, van Beek JH. Analyzing the functional properties of the creatine kinase system with multiscale 'sloppy' modeling. PLoS Comput Biol. 2011;7(8):e1002130. doi: 10.1371/journal.pcbi.1002130. [DOI] [PMC free article] [PubMed] [Google Scholar]
- 32.Wu F, Zhang J, Beard DA. Experimentally observed phenomena on cardiac energetics in heart failure emerge from simulations of cardiac metabolism. Proc Natl Acad Sci USA. 2009;106(17):7143–7148. doi: 10.1073/pnas.0812768106. [DOI] [PMC free article] [PubMed] [Google Scholar]
- 33.Bottomley PA, Ouwerkerk R, Lee RF, Weiss RG. Four-angle saturation transfer (FAST) method for measuring creatine kinase reaction rates in vivo. Magn Reson Med. 2002;47(5):850–863. doi: 10.1002/mrm.10130. [DOI] [PMC free article] [PubMed] [Google Scholar]
- 34.Schar M, El-Sharkawy AM, Weiss RG, Bottomley PA. Triple repetition time saturation transfer (TRiST) 31P spectroscopy for measuring human creatine kinase reaction kinetics. Magn Reson Med. 2010;63(6):1493–1501. doi: 10.1002/mrm.22347. [DOI] [PMC free article] [PubMed] [Google Scholar]
- 35.Kupriyanov VV, Steinschneider AY, Ruuge EK, Kapelko VI, Zueva MY, Lakomkin VL, Smirnov VN, Saks VA. Regulation of Energy Flux through the Creatine-Kinase Reaction Invitro and in Perfused Rat-Heart - P-31-Nmr Studies. Biochim Biophys Acta. 1984;805(4):319–331. doi: 10.1016/0167-4889(84)90014-4. [DOI] [PubMed] [Google Scholar]
- 36.Vinnakota KC, Bassingthwaighte JB. Myocardial density and composition: a basis for calculating intracellular metabolite concentrations. Am J Physiol Heart Circ Physiol. 2004;286(5):H1742–1749. doi: 10.1152/ajpheart.00478.2003. [DOI] [PubMed] [Google Scholar]
- 37.Morrison JF, Cleland WW. Isotope exchange studies of the mechanism of the reaction catalyzed by adenosine triphosphate: creatine phosphotransferase. J Biol Chem. 1966;241(3):673–683. [PubMed] [Google Scholar]
- 38.Saks VA, Chernousova GB, Gukovsky DE, Smirnov VN, Chazov EI. Studies of energy transport in heart cells. Mitochondrial isoenzyme of creatine phosphokinase: kinetic properties and regulatory action of Mg2+ ions. Eur J Biochem. 1975;57(1):273–290. doi: 10.1111/j.1432-1033.1975.tb02299.x. [DOI] [PubMed] [Google Scholar]
- 39.Bittl JA, DeLayre J, Ingwall JS. Rate equation for creatine kinase predicts the in vivo reaction velocity: 31P NMR surface coil studies in brain, heart, and skeletal muscle of the living rat. Biochemistry. 1987;26(19):6083–6090. doi: 10.1021/bi00393a021. [DOI] [PubMed] [Google Scholar]
- 40.Nascimben L, Ingwall JS, Pauletto P, Friedrich J, Gwathmey JK, Saks V, Pessina AC, Allen PD. Creatine kinase system in failing and nonfailing human myocardium. Circulation. 1996;94(8):1894–1901. doi: 10.1161/01.cir.94.8.1894. [DOI] [PubMed] [Google Scholar]
- 41.Gibbs C. The cytoplasmic phosphorylation potential. Its possible role in the control of myocardial respiration and cardiac contractility. J Mol Cell Cardiol. 1985;17(8):727–731. doi: 10.1016/s0022-2828(85)80034-1. [DOI] [PubMed] [Google Scholar]
- 42.El-Sharkawy AM, Schar M, Ouwerkerk R, Weiss RG, Bottomley PA. Quantitative cardiac 31P spectroscopy at 3 Tesla using adiabatic pulses. Magn Reson Med. 2009;61(4):785–795. doi: 10.1002/mrm.21867. [DOI] [PMC free article] [PubMed] [Google Scholar]
- 43.Schlattner U, Tokarska-Schlattner M, Wallimann T. Mitochondrial creatine kinase in human health and disease. Biochim Biophys Acta. 2006;1762(2):164–180. doi: 10.1016/j.bbadis.2005.09.004. [DOI] [PubMed] [Google Scholar]
- 44.Ingwall JS, Weiss RG. Is the Failing Heart Energy Starved? Circ Res. 2004;95(2):135–145. doi: 10.1161/01.RES.0000137170.41939.d9. [DOI] [PubMed] [Google Scholar]
- 45.Duwel CM, Westerhof N. Feline left ventricular oxygen consumption is not affected by volume expansion, ejection or redevelopment of pressure during relaxation. Pflugers Arch. 1988;412(4):409–416. doi: 10.1007/BF01907560. [DOI] [PubMed] [Google Scholar]
- 46.Yasumura Y, Nozawa T, Futaki S, Tanaka N, Suga H. Time-invariant oxygen cost of mechanical energy in dog left ventricle: consistency and inconsistency of time-varying elastance model with myocardial energetics. Circ Res. 1989;64(4):764–778. doi: 10.1161/01.res.64.4.764. [DOI] [PubMed] [Google Scholar]
- 47.Beer M, Seyfarth T, Sandstede J, Landschutz W, Lipke C, Kostler H, von Kienlin M, Harre K, Hahn D, Neubauer S. Absolute concentrations of high- energy phosphate metabolites in normal, hypertrophied, and failing human myocardium measured noninvasively with P-31-SLOOP magnetic resonance spectroscopy. J Am Coll Cardiol. 2002;40(7):1267–1274. doi: 10.1016/s0735-1097(02)02160-5. [DOI] [PubMed] [Google Scholar]
- 48.Xiong Q, Ye L, Zhang P, Lepley M, Tian J, Li J, Zhang L, Swingen C, Vaughan JT, Kaufman DS, Zhang J. Functional consequences of human induced pluripotent stem cell therapy: myocardial ATP turnover rate in the in vivo swine heart with postinfarction remodeling. Circulation. 2013;127(9):997–1008. doi: 10.1161/CIRCULATIONAHA.112.000641. [DOI] [PMC free article] [PubMed] [Google Scholar]
- 49.Rodgers CT, Clarke WT, Snyder C, Vaughan JT, Neubauer S, Robson MD. Human cardiac P magnetic resonance spectroscopy at 7 tesla. Magn Reson Med. 2013 doi: 10.1002/mrm.24922. [DOI] [PMC free article] [PubMed] [Google Scholar]
- 50.Rodgers CT, Robson MD. Receive array magnetic resonance spectroscopy: Whitened singular value decomposition (WSVD) gives optimal Bayesian solution. Magn Reson Med. 2010;63(4):881–891. doi: 10.1002/mrm.22230. [DOI] [PubMed] [Google Scholar]
- 51.Martini N, Santarelli MF, Giovannetti G, Milanesi M, De Marchi D, Positano V, Landini L. Noise correlations and SNR in phased-array MRS. NMR Biomed. 2010;23(1):66–73. doi: 10.1002/nbm.1429. [DOI] [PubMed] [Google Scholar]
- 52.Weiss K, Martini N, Boesiger P, Kozerke S. Cardiac proton spectroscopy using large coil arrays. NMR Biomed. 2013;26(3):276–284. doi: 10.1002/nbm.2845. [DOI] [PubMed] [Google Scholar]
- 53.Atalar E, Bottomley PA, Ocali O, Correia LC, Kelemen MD, Lima JA, Zerhouni EA. High resolution intravascular MRI and MRS by using a catheter receiver coil. Magn Reson Med. 1996;36(4):596–605. doi: 10.1002/mrm.1910360415. [DOI] [PubMed] [Google Scholar]
- 54.Veech RL, Lawson JW, Cornell NW, Krebs HA. Cytosolic phosphorylation potential. J Biol Chem. 1979;254(14):6538–6547. [PubMed] [Google Scholar]
- 55.Ganz W, Tamura K, Marcus HS, Donoso R, Yoshida S, Swan HJ. Measurement of coronary sinus blood flow by continuous thermodilution in man. Circulation. 1971;44(2):181–195. doi: 10.1161/01.cir.44.2.181. [DOI] [PubMed] [Google Scholar]


