Abstract
This study attempted to clarify the material basis for the detoxification of Rhizoma Zingiberis (RZ) on aconitine, an analgesic drug, by quantitatively assessing the influence of RZ on the in vitro intestinal concentration of aconitine using an everted gut sac model and by qualitatively identifying the components in the RZ extract. To quantify aconitine in rat everted gut sacs, both an accurate processing method and a sensitive detection method were required. We developed a three-step sample processing method to protect the components from decomposition and applied ultra-performance liquid chromatography coupled with triple quadrupole mass spectrometry (UPLC/TQMS) to quantify aconitine, glucose and digoxin. In addition, ultra-performance liquid chromatography coupled with linear ion trap mass spectrometry (UPLC/ITMS) was applied to detect the potential antidotal components in the RZ extract. Finally, the RZ extract reduced the level of aconitine in everted gut sacs, and eleven gingerols were successfully identified, which could be considered potential antidotal components for aconitine. This study demonstrated the application of two UPLC/MS methods for analyzing the material basis for the reciprocity between Chinese medicine components in everted gut sacs.
Introduction
Aconitine primarily exists in aconite tubers. These plants and their herbal formulations have been widely used in clinical applications, which include anti-inflammatory and analgesic functions [1–3]. However, the toxicity resulting from the main alkaloids in these plants, such as aconitine, cannot be neglected [4–7]. Processing and compatibility are the two main methods that can reduce the toxicity of aconite tubers through decreasing the content of toxic alkaloids [8, 9]. With respect to compatibility, the in vivo interaction of medicines must be considered. The intestinal tract is the main absorptive site for orally administered medicines, and interactions between medicines related to P-glycoproteins might affect their plasma concentration. Although previous studies have demonstrated that Rhizoma Zingiberis is a traditional Chinese medicine that can decrease the toxicity of aconitine [10], the material basis for the detoxification of Rhizoma Zingiberis has not yet been clarified. Furthermore, studies on the mechanism of aconitine toxicity [11–13] are currently more common than those on the detoxification mechanism. Therefore, this study attempted to elucidate the reason and the material basis for the detoxification of Rhizoma Zingiberis on aconitine using an everted gut sac model.
In this study, validating the methodology involved a processing method, and a test method was necessary to obtain a credible conclusion. Therefore, we developed a three-step processing method that consisted of freeze-drying, dissolving and centrifuging to separate inorganic salts from the chemical components and to prevent their degradation in the everted gut sac samples. The test methods in the current study included quantifying aconitine and digoxin, semi-quantifying glucose and qualitatively determining the components in Rhizoma Zingiberis. For the semi-quantification of glucose, we developed a UPLC/MS method as a substitute for the UV method to validate the viability of the everted gut sacs. UPLC coupled with quadrupole mass spectrometry was used to quantify aconitine and digoxin with low limits of quantification (LLOQ) of 8 and 16 ppb, respectively. In contrast, UPLC coupled with linear ion trap mass spectrometry was used to identify the components in Rhizoma Zingiberis.
P-glycoprotein is an important membrane transporter pump that mediates drug efflux in the intestinal epithelium [14,15]. This glycoprotein can protect cells from deleterious exogenous compounds by increasing the efflux of them, and it is related to the plasma concentration of numerous compounds. Therefore, it is necessary to determine the relationship between P-glycoprotein and aconitine as well as Rhizoma Zingiberis to elucidate the detoxification mechanism of Rhizoma Zingiberis on aconitine.
Verapamil [16] is an example of a P-glycoprotein inhibitor that can increase in vivo drug concentration by inhibiting P-gp activity. Digoxin is a ubiquitous substrate of P-gp [17, 18] that is commonly used to screen inhibitors or revulsants of P-gp. Previous studies conducted using a Caco-2 cell culture model indicated that aconitine was both a substrate and an inhibitor of P-glycoprotein and that there was a strong correlation between the absorption of aconitine and the activity of P-gp [19]. The everted gut sac model has been the most widely used model for investigating the absorption of drugs in vitro, other than the Caco-2 cell culture model, in recent studies [20–22].
In this study, a very simple and rapid sample processing method and methods for detecting glycoside, aconitine, digoxin and gingerols by applying UPLC/MS were developed. The developed methods were used to study the material basis for the detoxification effect of Rhizoma Zingiberis on aconitine using an everted rat gut sac model for the first time. The results are expected to be important for future in-depth studies.
Materials and Methods
Chemicals
The reference standards for aconitine and 6-gingerol were purchased from the Institute for the Control of Pharmaceutical and Biological Products of China (Beijing, China). Rhizoma Zingiberis was purchased from the Jilin Pharmacy (Changchun, China). Verapamil and digoxin were purchased from the Sigma Chemical Co. (St. Louis, MO, USA). Krebs-Ringer’s (K-R) solution [23] was composed of 1.4 g of glutamine, 7.8 g of sodium chloride, 0.35 g of potassium chloride, 0.32 g of sodium dihydrogen phosphate and 1.37 g of sodium bicarbonate dissolved in 1000 mL of distilled water. Methanol and acetonitrile were of HPLC grade. Dimethylsulfoxide (DMSO) was of analytical grade. Distilled water was prepared using a Millipore water purification system. Aconitine solutions were prepared with a high concentration, an intermediate concentration and a low concentration of 0.3, 0.03 and 0.003 mg/mL, respectively. A digoxin solution was prepared with a concentration of 0.8 mg/mL. A verapamil solution was prepared with a concentration of 1.0 mg/mL. A 10 mL aqueous extract of 10 g Rhizoma Zingiberis was prepared using the decocting method.
Animals
Forty-three male Wister rats (200–220 g) were purchased from the Changchun Institute of Biological Products (Changchun, China). All of the rats were acclimated in the animal house under the following conditions: a temperature of 25°C and a humidity of 50% for seven diurnal cycles. During the seven days, food and water were provided ad libitum. After seven days of acclimation, the forty-three rats were divided into nine groups: the control group (three rats for detecting glucose), a high-concentration aconitine group (five rats), an intermediate-concentration aconitine group (five rats), a low-concentration aconitine group (five rats), an aconitine with Rhizoma Zingiberis extract group (five rats), an aconitine with verapamil group (five rats), a digoxin with Rhizoma Zingiberis extract group (five rats), an aconitine with 6-gingerol group (five rats) and a digoxin with 6-gingerol group (five rats).
Preparation of the everted rat gut sacs
All of the rats were starved for 24 h before the experiments. The rats were sacrificed by decapitation, and the duodenum, jejunum, ileum and colon were immediately removed and placed in a 37°C K-R solution that was oxygenated (O2/CO2, 95%:5%). After washing in order with K-R solution at room temperature, the four intestinal segments were everted on a glass rod (3 mm in diameter) with one end of each clamped before filling with fresh oxygenated K-R solution. The intestines were then sealed with braided sutures. Each sac was placed in a 10 mL test tube that contained 8 mL of oxygenated drug-containing K-R solution at 37°C. Then, 0.1 mL of serosal fluid was collected at the appropriate time points, and an equal volume of K-R solution was added to the serosal side. Finally, the solution in the sacs was collected to accurately calculate the volume, and each sac was accurately weighed before and after being cut open. The area of each sac was measured. All of the samples were analyzed using the UPLC-MS method. After analysis, the amounts (ng/mm2) of absorbed aconitine and digoxin were calculated. Each experiment was repeated five times, and the presented data represent the means ± S.D. This study was conducted in accordance with the internationally accepted principles for laboratory animal use and care as found in the European Community guidelines.
Validation of the viability of the everted rat gut sacs
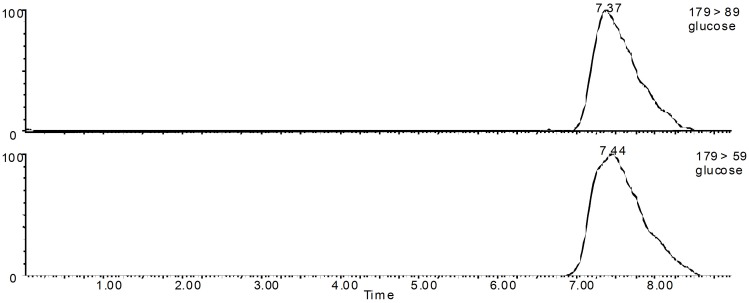
To verify the integrity and viability of the gut sacs, glucose was collected from both the serosal side and the mucosal side of the rat gut sacs at a fixed time, and glucose was detected using a Waters UPLC/MS (Waters Co., USA), which is more accurate and sensitive than a UV-Vis detector. Separation was performed on a Hypersil NH column (4.6*150 mm, 25 μm, Elite Co., China). Although only glucose was available for detection in this part, the column separation was essential because large amounts of inorganic salts were present in the K-R nutrient solution. A mobile phase composed of 80% acetonitrile (A) and 20% distilled water (B) was used for isocratic elution. The retention time for glucose was 7.37 min. The chromatogram of glucose is shown in Fig 1. The peak area ratio of glucose in the serosal side to that in the mucosal side was used to validate the viability of the everted rat gut sacs. Because glucose was actively transported in the intestine, intact and active sacs concentrated glucose in the serosal side, and ratio of the glucose concentration in the serosal side to that in the mucosal side exhibited an increasing trend throughout the entire experiment.
Fig 1. Multiple reaction monitoring (MRM) ion chromatogram of glucose.
UPLC-MS detection of aconitine
The analytical UPLC-MS system consisted of an Acquity Ultra Performance LC with a Xevo TQ mass spectrometer as the detector, and it was equipped with an electrospray source in the positive ion mode (Waters Co., USA). The mass spectrometry conditions used to measure aconitine are shown in Table 1. Separation was performed on a BEH Extend-C18 column (2.1*50 mm, 1.7 μm, Agilent Co., USA). The mobile phase was composed of methanol mixed with acetonitrile in equal volumes (A) and an aqueous solution of ammonium acetate at pH 10.5 (B). The gradient elution conditions were as follows: 0–1 min 10–43% A, 2–4.5 min 55–100% A, and 5–7 min 10% A. The flow rate was 0.3 mL/min. The column temperature was 35°C throughout the entire detection process. All of the samples were freeze-dried after being collected from the serosal side, and the residue was dissolved with 0.1 mL of the mobile phase (A) prior to injecting 5 μL of each sample into the UPLC system. The UPLC retention time of aconitine was 4.77 min. The MRM ion chromatogram of aconitine is shown in Fig 2.
Table 1. Mass spectrometry conditions of detected compounds in this paper.
| Detected compounds | Ion mode | scan mode | cone voltage(V) | collision energy(V) | Diagnosed ions(m/z) | capillary voltage(kV) | desolvation temp(°C) | Desolvation gas(L/h) | collision gas (mL/min) |
|---|---|---|---|---|---|---|---|---|---|
| aconitine | positive | MRM | 54 | 34, 42 | 586.31,368.23 | 3.00 | 350 | 700 | 0.15 |
| digoxin | negtive | MRM | 50 | 35, 45 | 649.64, 475.35 | 3.00 | 350 | 700 | 0.15 |
| glucose | negtive | MRM | 10 | 15, 15 | 59, 89 | 2.5 | 350 | 700 | 0.15 |
| Detected compounds | Ion mode | scan mode | capillary voltage(V) | tube lens voltage(V) | source voltage(kV) | capillary temp(°C) | sheath gas (L/min) | auxiliary gas(L/min) | |
| gingerols | positive | TIC | 3 | 65 | 4 | 250 | 9.9 | 1.65 |
Fig 2. MRM ion chromatogram of aconitine.
UPLC-MS detection of digoxin
Digoxin was detected using the same UPLC-MS system and chromatographic column used for detecting aconitine. However, the negative ion mode was applied to acquire the best signal for digoxin. The mass spectrometry conditions used to measure digoxin are shown in Table 1. Mobile phases composed of methanol mixed with acetonitrile in equal volumes (A) and water (B) were used for isocratic elution at the volume ratio of 70% (A) to 30% (A). The flow rate was 0.3 mL/min. The column temperature was 30°C throughout the entire detection process. All of the samples were freeze-dried after being collected from the serosal side, and the residue was dissolved with 50 μL of dimethyl sulfoxide and 50 μL of mobile solvent prior to injecting 5 μl of each sample into the UPLC system. The UPLC retention time of digoxin was 0.56 min. The chromatogram of digoxin is shown in Fig 3.
Fig 3. MRM ion chromatogram of digoxin.
UPLC-MS detection of gingerols
The gingerols in the Rhizoma Zingiberis extract were detected using the UPLC/ESI-MSn system. This system consists of an ACCELA 1250 Pump with an LTQ ion trap mass spectrometer as the detector, and it is equipped with an electrospray source in the positive ion mode, which is capable of analyzing ions up to m/z 2000 (Thermo Co. USA). The m/z scan range was set to 100–800. The mass spectrometry conditions used are shown in Table 1. The separation was performed on a BEH Extend-C18 column (3×50 mm, 1.7 μm, Agilent Co., USA). The mobile phase was composed of methanol (A) and water (B). The gradient elution conditions were 0–12 min 40–100% A, 12–15 min 100% A. The flow rate was 0.3 mL/min. The column temperature was 30°C throughout the entire detection process.
Assay validation for aconitine and digoxin
The UPLC/MS method for the detection of aconitine and digoxin was validated in terms of selectivity, linearity, accuracy, limit of detection (LOD), low limit of quantification (LLOQ), matrix effect, extraction recovery, and stability. A calibration curve was constructed by correlating the peak area with the concentration of aconitine or digoxin spiked in K-R nutrient solution. No weighting was applied.
The selectivity was examined by detecting blank K-R nutrient solutions, which were useful only if no peaks appeared at the retention times of aconitine and digoxin. The inter-day and intra-day accuracies were evaluated by calculating the percent relative standard deviation (RSD %) of the concentration of the quality control (QC) samples on the same day or over three days. The matrix effect was determined by comparing the concentrations of samples with standard solution added into a blank K-R solution after extraction with QC samples. The extraction recovery was calculated by comparing the concentration of normally extracted samples with that of the QC samples. The stability was evaluated by calculating the RSD % of the concentration of the quality control (QC) samples at 0 h, 24 h and 48 h. The accuracy, matrix effect, extraction recovery and stability were all replicated by five QC samples at three levels. The LOD and LLOQ were the concentrations of QC samples with peak signal-to-noise ratios (S/N) of at least 3 and 10, respectively.
Ethics statement
This study was approved by the Ethics Committee of the Affiliated Hospital to Changchun University of Chinese Medicine and complied with all national and international guidelines on research involving animals. All of the rats were sacrificed by decapitation before the intestinal sacs were removed.
Results
Evaluation of methodology
Because there were numerous inorganic salts that were harmful to the mass spectrometer in the everted sac samples, dechloridation was the first consideration when we developed the processing method. We applied lyophilization as the first step for prolonging the resting period of the samples to avoid the decomposition of unstable components. The inorganic salts could not be dissolved in organic solvents such as methanol, whereas aconitine was able to be dissolved in methanol. Therefore, the second step consisted of dissolving aconitine in methanol. For digoxin, because it only could be dissolved in dimethyl sulfoxide (DMSO) among the tested solvents, which included methanol, ethanol, acetonitrile, and distilled water, the residue of the freeze-dried samples was dissolved with the same volumes of DMSO and methanol. The third step consisted of centrifuging, and 5 μL of the supernatant liquid was injected into the UPLC/MS.
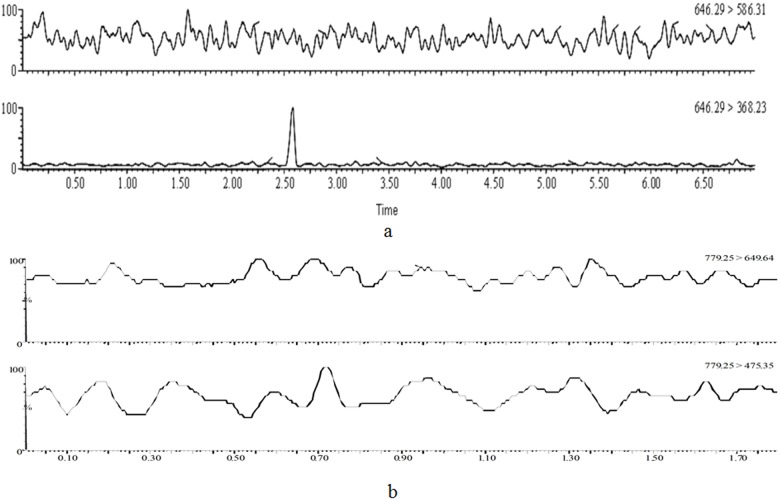
The multiple reaction monitoring (MRM) ion chromatogram of the blank K-R nutrient solution is shown in Fig 4. We confirmed that the blank K-R nutrient solution did not interfere with the quantification of aconitine and digoxin.
Fig 4. MRM ion chromatogram of aconitine(a) and digoxin(b) in blank intestinal nutritious solution.
The calibration curves for aconitine and digoxin were y = 164.7x–26455 and y = 0.1856x+17.12 at the linearity ranges of 1.813 to 18130 ng/mL and 2.048 to 32000 ng/mL, respectively.
The accuracy, matrix effect and extraction recovery, and stability are shown in Tables 2, 3 and 4. The RSD % of both the accuracy and stability were less than 15%, which was in the acceptable range and indicated that the repeatability of processing and the analytical method were adequate, and both aconitine and digoxin were stable for 48 h. The matrix effect and extraction recovery were between 85% and 105%. The LOD and LLOQ of aconitine were 0.03626 and 8 ppb, respectively, and these data for digoxin were 0.09065 and 16 ppb, respectively.
Table 2. Inter-day and intra-day precisions of aconitine and digoxin.
| components | Added (ng/mL) | Found (ng/mL) | Inter-day RSD% | Intra-day RSD% | RE% |
|---|---|---|---|---|---|
| 14504 | 13018 | 3.450 | 1.405 | 10.24 | |
| aconitine | 1133 | 1171 | 0.2911 | 10,62 | 3.375 |
| 226.6 | 220.4 | 4.789 | 3.365 | 2.762 | |
| 16000 | 17231 | 7.735 | 3.995 | 7.694 | |
| digoxin | 3200 | 3292 | 9.853 | 8.178 | 2.882 |
| 128 | 125.8 | 14.17 | 7.657 | 1.709 |
Table 3. Extracted recovery and matrix effects of aconitine and digoxin.
| components | Added (ng/mL) | Matrix effect (%) | Extracted recovery (%) |
|---|---|---|---|
| aconitine | 14504 | 99.36±8.421 | 100.7±9.285 |
| 1133 | 88.69±4.950 | 98.13±1.949 | |
| 226.6 | 101.7±3.763 | 102.7±1.004 | |
| digoxin | 16000 | 90.77±3.157 | 89.38±4.530 |
| 3200 | 101.2±3.921 | 97.56±9.564 | |
| 128 | 93.56±3.386 | 86.97±4.436 |
Table 4. Stabilities of aconitine and digoxin.
| RSD% | |||
|---|---|---|---|
| component | High concentration | Middle concentration | Low concentration |
| aconitine | 10.04 | 11.72 | 2.448 |
| digoxin | 1.336 | 4.913 | 2.036 |
Viability of the gut sacs
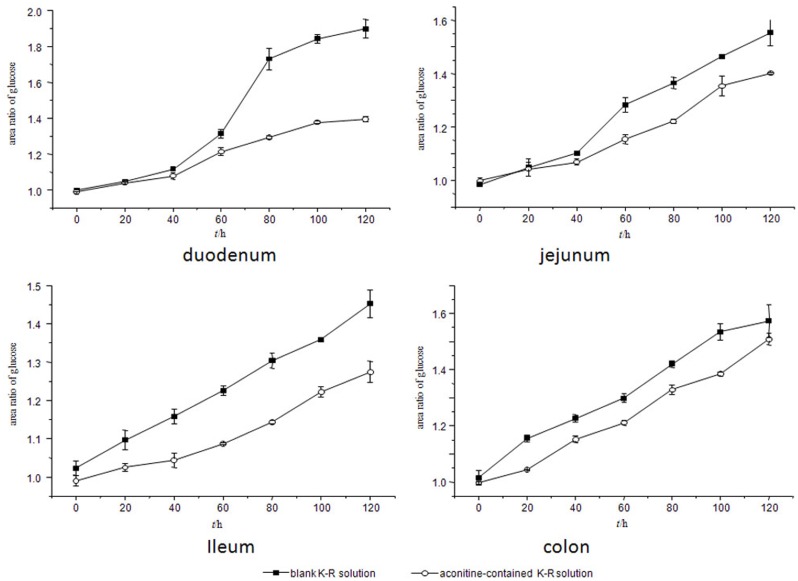
Fig 5 (data for this figure are from parallel three rats samples) shows that both in the absence and presence of aconitine, the ratio of the glucose content in the serosal side to that in the mucosal side increased as the incubation time increased to 120 min, which indicated that the tissues of the gut sacs were viable and that aconitine did not induce toxicity in the gut sac tissue.
Fig 5. Ratios of glucose content in the serosal side to that in the mucosal side in different sacs.
Absorptive behavior of aconitine in the rat gut sacs
The intestinal kinetic absorptive behavior of aconitine was investigated in the gut sac model cultured in K-R nutrient solution for 120 min. The accumulative absorbed dose (Q) of aconitine was calculated for use in zero-level, primary and Higuchi equation fitting. Then, the determination coefficient (R2) of the equation was set as the evaluation criterion for the quality of the fit. The results indicated that the zero-level fitting equation was better than the other two equations, with R2>0.9. The zero-level fitting equation for different concentrations of aconitine in different rat gut sacs is shown in Table 5. The slope of the fitting equation represents the absorption rate constant (ka). Table 5 shows that ka increased as the concentration of aconitine in each gut sac increased, which indicated that the absorption of aconitine in the gut sac depended on the initial concentration of aconitine.
Table 5. Zero-level fitting equations for different concentrations of aconitine in different rat gut sacs.
| Rat gut sacs | Concentratio(/ng·mL-1) | Fitting equation | Determination coefficient (R2) |
|---|---|---|---|
| 7500 | Q = 3.528t | 0.9338 | |
| duodenum | 750 | Q = 0.05406t | 0.9834 |
| 75 | Q = 0.02546t | 0.9715 | |
| 7500 | Q = 3.2531t | 0.9462 | |
| jejunum | 750 | Q = 0.2028t | 0.9345 |
| 75 | Q = 0.02977t | 0.9498 | |
| 7500 | Q = 2.529t | 0.9455 | |
| ileum | 750 | Q = 0.2906t | 0.9688 |
| 75 | Q = 0.01294t | 0.9188 | |
| 7500 | Q = 2.000t | 0.9695 | |
| colon | 750 | Q = 0.1302t | 0.9548 |
| 75 | Q = 0.01937t | 0.9521 |
Effect of the Rhizoma Zingiberis extract on the level of aconitine in the rat gut sacs
To study the effect of the Rhizoma Zingiberis extract on the concentration of aconitine in the rat gut sacs, the apparent osmotic coefficient (Papp) was calculated using the equation Papp = [V/(A·C0)]·dC/dt, where V represents the fluid volume in the serosal side, A represents the superficial area of the gut sac, and C0 represents the initial concentration of aconitine outside the gut sac. The calculated Papp value of aconitine is shown in Table 6. The results of a variance analysis for P0 indicated that different gut sacs influenced the level of aconitine, that the P0 value of aconitine for the jejunum sac was greater than in the other three sacs, and that the value for the colon sac was smallest among the four sacs. In addition, the P1 value of aconitine for each gut sac decreased after the Rhizoma Zingiberis extract was added, and the decrease in the duodenum was most significant, which can be observed from its lowest ER value. These results indicate that the Rhizoma Zingiberis extract reduced the level of aconitine in the rat gut sacs, and this reduction was greatest in the duodenum; however, the mechanism could not be elucidated from the above results. Therefore, further experiments were performed to elucidate the possible reason for the reduction in the level of aconitine by the Rhizoma Zingiberis extract.
Table 6. Effect of the Rhizoma Zingiberis extract on the Papp value of aconitine.
| groups | duodenum | jejunum | ileum | colon |
|---|---|---|---|---|
| high aconitine concentration (P0) | (4.111±0.3898)E-05 | (4.751±0.4762)E-05 | (4.386±0.1086)E-05 | (3.506±0.03262)E-05 |
| high aconitine concentration with the extract of Rhizoma Zingiberis added (P1) | (1.111±0.1150)E-05 | (1.764±0.1251)E-05 | (1.585±0.06571)E-05 | (2.347±0.1634)E-05 |
| high aconitine concentration with 6-gingerol added (P2) | (1.481±0.1242)E-05 | (1.781±0.1923)E-05 | (1.519±0.09117)E-05 | (1.530±0.1401)E-05 |
| ER(P1/P0) | 0.2703 | 0.3942 | 0.3615 | 0.6695 |
| ER(P2/P0) | 0.3602 | 0.3979 | 0.3464 | 0.4363 |
Effect of a P-glycoprotein inhibitor on the level of aconitine in the rat gut sacs
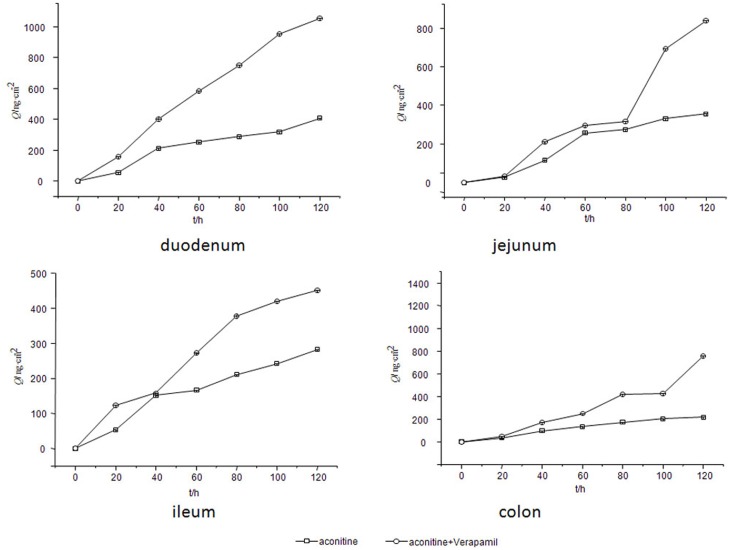
P-gp is an important glycoprotein in the intestinal mucous membrane epithelia. Because it can help pump medicine from the intestinal serosal side to the mucosal side, P-gp has a negative effect on the level of a majority of medicines. However, for toxic substances, P-glycoprotein might play a positive role. To determine the potential role of intestinal P-gp in the dynamic level of aconitine, verapamil (a known P-gp inhibitor), was added to a K-R solution that contained a high concentration of aconitine. As shown in Fig 6 (data for this figure are from parallel five rats samples), the content of aconitine increased when verapamil was added into every gut sac; in other words, the inhibition of intestinal P-gp by verapamil significantly increased the aconitine content in the rat intestine. Therefore, it can be deduced that aconitine is a potential substrate of P-glycoprotein.
Fig 6. Effect of verapamil on the absorptive profile of aconitine.
Effect of the Rhizoma Zingiberis extract on the level of P-gp substrates
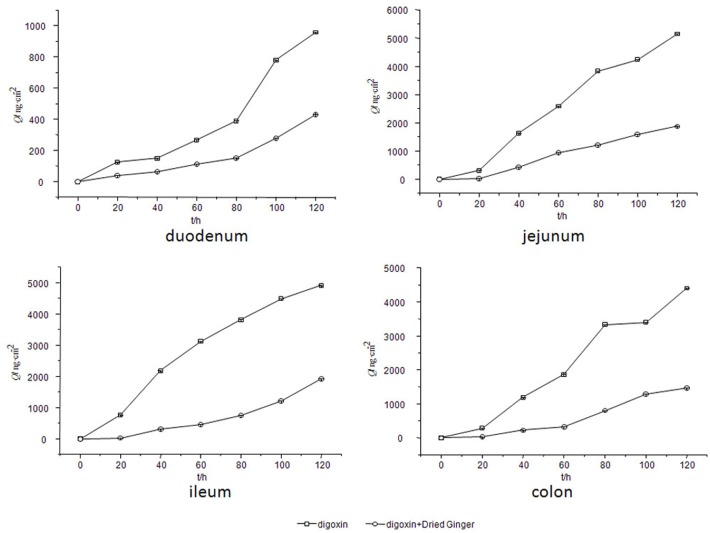
Because digoxin is a well-known substrate of P-glycoprotein, it was selected to be incubated with the Rhizoma Zingiberis extract to determine whether this extract could alter the level of digoxin. As shown in Fig 7 (data for this figure are from parallel five rats samples), the digoxin content decreased in every gut sac when the Rhizoma Zingiberis extract was added; in other words, the Rhizoma Zingiberis extract decreased digoxin level in the rat intestine. Therefore, it can be deduced that the Rhizoma Zingiberis extract might be an inducer of P-glycoprotein. Furthermore, it can be deduced that the Rhizoma Zingiberis extract might decrease the conitine content by activating P-glycoprotein.
Fig 7. Effect of the Rhizoma Zingiberis extract on the absorptive profile of digoxin.
Detection of gingerols in the Rhizoma Zingiberis extract
The above results demonstrated that the Rhizoma Zingiberis extract reduced the level of aconitine in the rat gut sacs by inducing intestinal P-gp; however, the material basis was not determined. Therefore, the following experiments were conducted to identify the main components of Rhizoma Zingiberis that affect aconitine levels in the rat gut sacs.
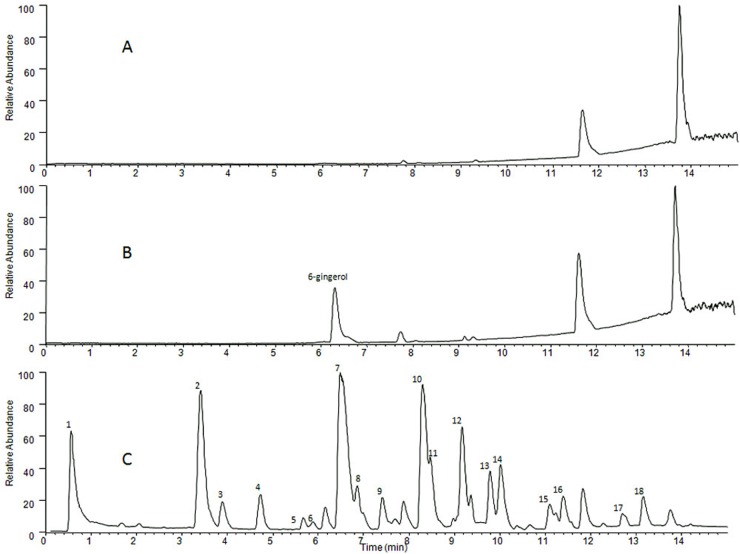
Previous reports have suggested that the major bioactive constituents in Rhizoma Zingiberis are gingerols [24–26]. In this section, the general components in the aqueous extract of Rhizoma Zingiberis were detected using UPLC/MSn, and the base peak chromatogram was shown in Fig 8. In Fig 8, eleven peaks were identified tentatively on the basis of their diagnostic ions and of a previous study [27], as shown in Table 7. 6-Gingerol, which was eluted at 6.50 min, presented the highest peak; thus, the effect of 6-gingerol on the intestinal level of aconitine was investigated.
Fig 8. Base peak ion chromatogram of the extract of Rhizoma Zingiberis: (A) blank solvent, (B) 6-gingerol standard, and (C) the Rhizoma Zingiberis extract.
Table 7. Preliminarily determined phenols in the aqueous extract of Rhizoma Zingiberis.
| Peak No. | t R (min) | [M+H]+ (m/z) | [M+H2O]+ (m/z) | [M+Na]+ (m/z) | [2M+Na]+ (m/z) | Identified phenols |
|---|---|---|---|---|---|---|
| 1 | 0.57 | 267 | — | 289 | — | 4-gingerol |
| 3 | 3.89 | 305 | — | — | — | 8-shogaol |
| 5 | 5.66 | 395 | — | — | — | Me-12-gingediol’isomer |
| 7 | 6.50 | 295 | 312 | 317 | 611 | 6-gingerol |
| 9 | 7.41 | 325 | — | 347 | — | 8-gingediol |
| 10 | 8.30 | 277 | 294 | 299 | 575 | 6-shogaol |
| 11 | 8.46 | 323 | 340 | 345 | 667 | 8-gingerol |
| 12 | 9.15 | — | 398 | 403 | — | 12-gingediol |
| 13 | 9.77 | — | 412 | 417 | — | Me-12-gingediol |
| 14 | 10.01 | 351 | 368 | 373 | 723 | 10-gingerol |
| 16 | 11.38 | 333 | 350 | 355 | 687 | 10-shogaol |
Effect of 6-gingerol on the level of aconitine in the rat gut sacs
The experiment described in this section was conducted under the same conditions as decribed in the “Effect of the Rhizoma Zingiberis extract on the level of aconitine in the rat gut sacs” section. The calculated Papp value of aconitine is shown in Table 6. As shown in Table 6, the P2 value is smaller than the P0 value in each gut sac, and the P2 value for the ileum was the smallest among the four gut sacs. From the above results, it could be concluded that 6-gingerol, as well as other gingerols in the Rhizoma Zingiberis extract, contributed to the decreased effect of the extract on the aconitine level.
Effect of 6-gingerol on the level of digoxin in the rat gut sacs
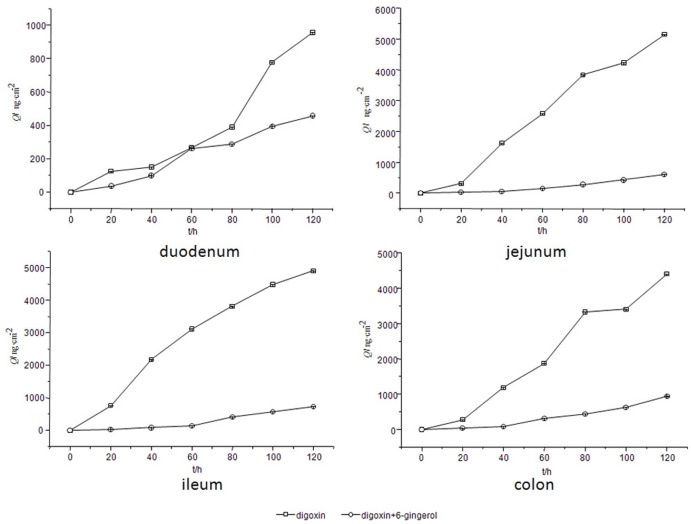
To study the mechanism by which the effect of 6-gingerol on the aconitine level was reduced, 6-gingerol and digoxin were co-incubated. The effect of 6-gingerol on the digoxin concent in various rat gut sacs is clearly visible in Fig 9 (data for this figure are from parallel five rats samples). The obtained results show that the digoxin content in the rat gut sacs was decreased after adding 6-gingerol. Therefore, it can be concluded that 6-gingerol is a potential revulsant of P-gp; together with the previous conclusion, this finding indicates that 6-gingerol reduced the level of aconitine by inducing P-gp.
Fig 9. Effect of 6-gingerol on the absorptive profile of digoxin.
Discussion
Aconitine is a well-known toxic compound that has been the focus of many previous studies. Previous studies have shown that various traditional Chinese medicines, such as Radix Glycyrrhizae and Rhizoma Zingiberis can decrease the toxicity of aconitine. The content of aconitine in the co-decoction of Rhizoma Zingiberis with Radix Aconiti Lateralis Preparata was not less than that in the single decoction of Radix Aconiti Lateralis Preparata, whereas the LD50 value of the co-decoction was larger than that of the single Radix Aconiti Lateralis decoction [28]. Therefore, it was hypothesized that Rhizoma Zingiberis might reduce the plasma concentration of aconitine. Based on the above proposal, this study was conducted.
Drugs are absorbed into the blood stream mainly in the intestine; therefore, everted rat gut sacs were studied to determine the methanism by which Rhizoma Zingiberis affects aconitine transport and to determine the main extract components responsible. The findings demonstrate that aconitine is a potential substrate of intestinal P-gp and that the Rhizoma Zingiberis extract is a potential revulsant of P-glycoprotin; in addition, the Rhizoma Zingiberis extract reduced the permeation of aconitine by inducing P-glycoprotein, and gingerols were the main Rhizoma Zingiberis components responsible for the effect of Rhizoma Zingiberis on aconitine transport in the intestine. Early studies showed that the substrate, which comprised at least one basic nitrogen atom and an aromatic ring containing benzoyl groups, could be combined with P-glycoprotein [29]. Therefore, the structure of aconitine indicates that this compound is a substrate for P-glycoprotein, which is consistent with the results obtained in this study. Previous studies showed that the rate of transport of the P-glycoprotein substrate is related to the nature of the hydrogen bonds formed between the substrate and P-glycoprotein (stronger hydrogen bonds result in slower transport rates) [30]. Large numbers of phenols that contain hydroxy groups are present in the molecular structures of Rhizoma Zingiberis extract components; these hydroxy groups competed with aconitine to form hydrogen bonds with P-gp. Thus, the induction of P-gp by gingerols present in Rhizoma Zingiberis might be related to a weakening of the hydrogen bonds that are formed between aconitine and P-glycoprotein.
Conclusion
This paper demonstrated an effective reduction in the toxicity of aconitine, namely, the Rhizoma Zingiberis extract, reduced the intestinal aconitine level by inducing intestinal P-gp, which will be verified by our further studies on acute toxicity test. This conclusion is consistent with previous studies using the Caco-2 cell culture model. Moreover, the material basis for the detoxification of Rhizoma Zingiberis on aconitine might be all of the gingerols involved in this study. This study provided a strategy for identifying new P-gp inducers and activators to search for new antidotes to be used in intoxication caused by P-gp sbustrates.
Acknowledgments
Y.Xin wishes to express her gratitude for help from colleagues at Changchun Center of Mass Spectrometry & Chemical Biology Laboratory, Changchun Institute of Applied Chemistry, Chinese Academy of Sciences.
Data Availability
All relevant data are within the paper.
Funding Statement
This research was supported by National Natural Science Foundation of China (Nos. 81403067, 21175127, 21475012), Heilongjiang Province Science and Technology Department (No. 12541874), Qiqihar Science and Technology Bureau (No.SFZD-2012087), and Program for Young Teachers Scientific Research in Qiqihar University (No.2012k-Z04). The funders had no role in study design, data collection and analysis, decision to publish, or preparation of the manuscript.
References
- 1. Shaheen F, Ahmad M, Khan MTH, Jalil S, Ejaz A, Sultankhodjaev MN, et al. Alkaloids of Aconitum laeve and their anti-inflammatory, antioxidant and tyrosinase inhibition activities. Phytochemistry. 2005; 66:935–940. [DOI] [PubMed] [Google Scholar]
- 2. Shen XY, Li CX, Zhao HF, Li SH, Chen JF, Yuta K, et al. Inhibitory effects of atraditional Chinese herbal formula TBL-II on type II collagen-induced arthritis in mice. J Ethnopharmacol. 2011; 134: 399–405. 10.1016/j.jep.2010.12.033 [DOI] [PubMed] [Google Scholar]
- 3. Liou SS, Liu IM, Lai MC, Cheng JT. Comparison of the antinociceptive action of crude Fuzei, the root of Aconitum, and its processed products. J Ethnopharmacol. 2005; 99: 379–383. [DOI] [PubMed] [Google Scholar]
- 4. Qian JY, Guo L. Altered cytosolic Ca2+ dynamics in cultured Guinea pid cardiomyocytes as an in vitro model to identify potential cardiotoxicants. Toxicol. in Vitro. 2010; 24:960–972. 10.1016/j.tiv.2009.12.027 [DOI] [PubMed] [Google Scholar]
- 5. Li YF, Tu DN, Xiao H, Du YM, Zou AR, Liao YH, et al. Aconitine blocks HERG and Kv1.5 potassium channels. J Ethnopharmacol. 2010; 131: 187–195. 10.1016/j.jep.2010.06.025 [DOI] [PubMed] [Google Scholar]
- 6. Zhao YL, Bu Q, Zhou Y, Lv L, Yan GY, Chen B, et al. Mechanism study of Aconitum-induced neurotoxicity in PC12 cells: Involvement of dopamine release and oxidative damage. NeuroToxicol. 2010; 31: 752–757. [DOI] [PubMed] [Google Scholar]
- 7. Ono T, Hayashida M, Uekusa K, Lai CF, Hayakawa H, Nihira M. An accidental case of aconite poisoning due to Kampo herbal medicine ingestion. Legal Med. 2009, 11: 132–135. 10.1016/j.legalmed.2008.11.001 [DOI] [PubMed] [Google Scholar]
- 8. Yue H, Pi ZF, Zhao YF, Song FR, Liu ZQ, Liu SY. Analysis of Norditerpenoid Alkaloids in Processing Radix Aconiti Lateralis Preparata with Radix Glycyrrhizae Preparata by Electrospray Ionization Tandem Mass Spectrometry. Chin J Anal Chem. 2007; 35: 959–963. [Google Scholar]
- 9. Yue H, Zhao YF, Song FR, Liu ZQ, Liu SY. Analysis of aconite alkaloids in the combination of Radix Aconiti Lateralis Preparata with different herbs by ESI-MS spectrometry. Acta Pharm Sinica. 2007; 42: 201–205. [PubMed] [Google Scholar]
- 10. Xu SJ, Chen CX, Gao JP. The Effective Components of Radix Ginger on Reducing the Toxicity of Radix Aconiti Laterlis. Lishizhen Med Mat Med Res. 2006; 17: 518–520. [Google Scholar]
- 11. Fu M, Wu M, Wang JF, Qiao YJ, Wang Z. Disruption of the istracellular Ca2+ homeostasis in the cardiac excitation-contraction coupling is a crucial mechanism of arrhythmic toxicity in aconitine-induced cardiomyocytes. Biochemical and Biophysical Research Communication. 2007; 354: 929–936. [DOI] [PubMed] [Google Scholar]
- 12. Fu M, Li RX, Fan L, He GW, Thorburg KL, Wang Z. Sarcoplasmic reticulum Ca2+ release channel ryanodine receptor (RyR2) plays a crucial role in aconitine-induced arrhythmias. Biochem Pharmacol. 2008; 75: 2147–2156. 10.1016/j.bcp.2008.02.027 [DOI] [PMC free article] [PubMed] [Google Scholar]
- 13. Lin MW, Wang YJ, Liu SI, Lin AA, Lo YC, Wu SN. Characterization of aconitine-induced block of delayed rectifier K+ current in differentiated NG108-15 neuronal cells. Neuropharmacol. 2008; 54: 912–923. [DOI] [PubMed] [Google Scholar]
- 14. Takano M, Yumoto R, Murakami T. Expression and function of efflux drug transporters in the intestine. Pharmacol Therap. 2006; 109: 137–161. [DOI] [PubMed] [Google Scholar]
- 15. Solazzo M, Fantappie O, Lasagna N, Sassoli C, Nosi D, Mazzanti R. P-gp localization in mitochondria and its functional characterization in multiple drug-resistant cell lines. Exp Cell Res. 2006; 312: 4070–4078. [DOI] [PubMed] [Google Scholar]
- 16. Pérez R, Palma C, Núnez MJ, Urrutia P, Salazar A, Morales L. Influence of verapamil on pharmacokinetics and transplacental transfer of ivermectin in sheep. Small Ruminant Res. 2010; 93: 103–109. [Google Scholar]
- 17. Smalley J, Marino AM, Xin BM, Olah T, Balimane PV. Development of a quantivative LC-MS/MS analytical method coupled with turbulent flow chromatography for digoxin for the in vitro P-gp inhibitionassay. J Chromatogr B. 2007; 854: 260–267. [DOI] [PubMed] [Google Scholar]
- 18. Cornaire G, Woodley J, Hermann P, Cloarec A, Arellano C, Houin G. Impact of excipients on the absorption of P-glycoprotein substrates in vitro and in vivo. Int J Pharm. 2004; 278: 119–131. [DOI] [PubMed] [Google Scholar]
- 19. Han TJ, Song FR, Liu ZY, Pi ZF, Liu ZQ, Liu SY. Studies of the intestinal transport of the diterpenoid alkaloids in the Aconitum carmichaeli combined with different medicinal herbs in a caco-2 cell culture system with UPLC/MS. Acta Chimica Sinica. 2011; 69:1795–1802. [Google Scholar]
- 20. Chan K, Liu ZQ, Jiang ZH, Zhou H, Wong YF, Xu HX. The effects of sinomenine on intestinal absorption of paeoniflorin by the everted rat gut sac model. J Ethnopharmacol. 2006; 103: 425–432. [DOI] [PubMed] [Google Scholar]
- 21. Klinck JS, Wood CM. In vitro characterization of cadmium transport along the gastro-intestinal tract of freshwater rainbow trout (Oncorhynchus mykiss). Aquat. Toxicol. 2011; 102: 58–72. 10.1016/j.aquatox.2010.12.009 [DOI] [PubMed] [Google Scholar]
- 22. Arellano C, Gandia P, Bettuing L, Woodley J, Chatelut E. Quantification of topotecan by liquid chromatography-mass spectrometry (LC-MS). Application to intestinal transport using rat everted gut sacs. J Chromatogr B. 2010; 878: 645–652. 10.1016/j.jchromb.2010.01.019 [DOI] [PubMed] [Google Scholar]
- 23. Zhou YQ, Li WZ, Chen LY, Ma SW, Ping L, Yang ZL. Enhancement of intestinal absorption of akebia saponin D by borneol and probenecid in situ and in vitro . Environmental Toxicol Pharmacol. 2010; 29: 229–234. 10.1016/j.etap.2010.01.004 [DOI] [PubMed] [Google Scholar]
- 24. Ahui MLB, Champy P, Ramadan A, Van LP, Araujo L, André KB, et al. Ginger prevents Th2-mediated immune responses in a mouse model of airway inflammation. Int Immunopharmacol. 2008; 8: 1626–1632. 10.1016/j.intimp.2008.07.009 [DOI] [PubMed] [Google Scholar]
- 25. Araya JJ, Zhang H, Prisinzano TE, Mitscher LA, Timmermann BN. Identification of unprecedented purine-containing compounds, the zingerines, from ginger rhizomes (Zingiber offcinale Roscoe) using a phase-trafficking approach. Phytochemistry. 2011; 72: 935–941. 10.1016/j.phytochem.2011.03.007 [DOI] [PMC free article] [PubMed] [Google Scholar]
- 26. Kim EC, Min JK, Kim TY, Lee SJ, Yang HO, Han S, et al. [6]-Gingerol, a pungent ingredient of ginger, inhibits angiogenesis in vitro and in vivo. Biochem Biophys Res Commun. 2005; 335: 300–308. [DOI] [PubMed] [Google Scholar]
- 27. He XG, Bernart MW, Lian LZ, Lin LZ. High-performance liquid chromatography-electrospray mass spectrometric analysis of pungent constituents of ginger. J Chromatogr A. 1998; 796: 327–334. [Google Scholar]
- 28. Xu SJ, Chen CX. Gao JP. The effective components of Radix Ginger on reducing the toxicity of Radix Aconiti Laterlis. Lishizhen Med and Mat Med Res. 2006; 17: 518–520. [Google Scholar]
- 29. Zamora JM.Pearce HL.Beck WT. Physical-chemical properties shared by compounds that modulate multidrug resistance in human leukemic cells. Mol Pharmacol. 1988; 33: 454–462 [PubMed] [Google Scholar]
- 30. Omote H, Shawi MK. Interaction of transported drugs with the lipid bilayer and P2 glycoprotein throughas olvation exchange mechanism. Biophysical J. 2006; 90: 4046–4059 [DOI] [PMC free article] [PubMed] [Google Scholar]
Associated Data
This section collects any data citations, data availability statements, or supplementary materials included in this article.
Data Availability Statement
All relevant data are within the paper.


