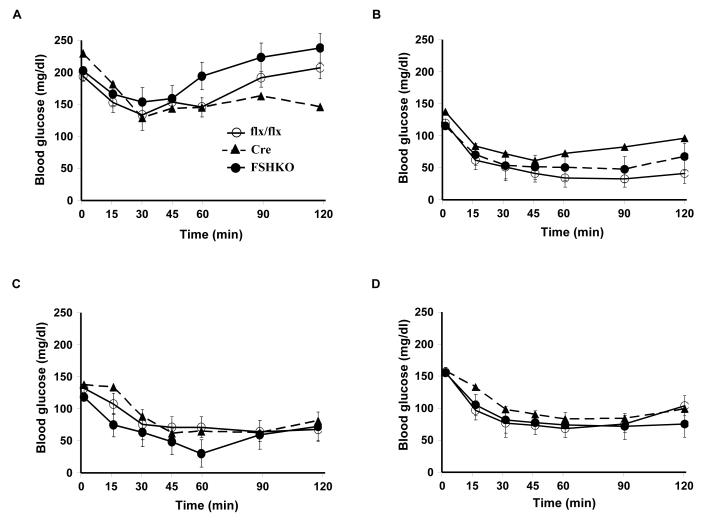
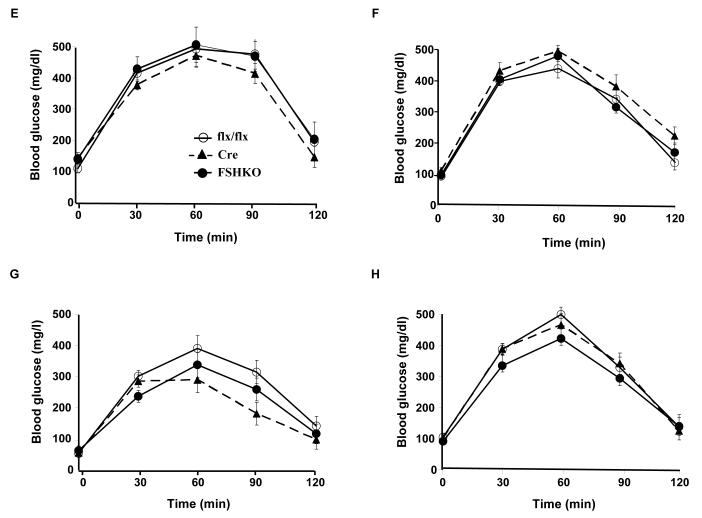
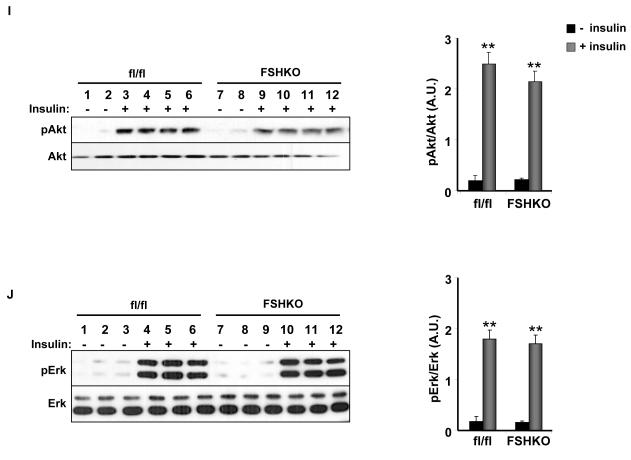
Figure 3. Insulin sensitivity and glucose tolerance in mice with adipose-specific Shp2 deletion.
(A-D) Insulin tolerance tests (ITTs) in male (A, C) and female (B, D) Cre (n= 9), flx/flx (n= 9), and FSHKO (n= 9) mice on a HFD (A, B) and chow (C, D) at 14 weeks of age (insulin 1 mU/g B.W.). (E-H) Glucose tolerance tests (GTTs) in male (E, G) and females (F, H) Cre (n= 9), flx/flx (n= 9), and FSHKO (n= 9) mice on a HFD (E, F) and chow (G, H) at 15 weeks of age (glucose dose, 2 mg/g B.W.). (I, J) Male mice (30 weeks old) were injected intraperitoneally with saline or insulin (10 mU/g B.W.) and sacrificed after 10 minutes. Total adipose tissue lysates were immunoblotted for pAkt (S473) (I) and pErk (J) and the corresponding total proteins. Bar graph indicates quantitation of Akt and Erk phosphorylation (adjusted to protein level) from at least 4 mice per group. All blots were scanned and quantified using FluorChem 8900 and statistical analysis was performed using two-tailed Student’s t-test. * Indicates statistically significant difference between basal and insulin stimulated conditions for each genotype (*, P < 0.05; **, P < 0.01).


