

Abstract
Objective Cancer can involve gene dysregulation via multiple mechanisms, so no single level of genomic data fully elucidates tumor behavior due to the presence of numerous genomic variations within or between levels in a biological system. We have previously proposed a graph-based integration approach that combines multi-omics data including copy number alteration, methylation, miRNA, and gene expression data for predicting clinical outcome in cancer. However, genomic features likely interact with other genomic features in complex signaling or regulatory networks, since cancer is caused by alterations in pathways or complete processes.
Methods Here we propose a new graph-based framework for integrating multi-omics data and genomic knowledge to improve power in predicting clinical outcomes and elucidate interplay between different levels. To highlight the validity of our proposed framework, we used an ovarian cancer dataset from The Cancer Genome Atlas for predicting stage, grade, and survival outcomes.
Results Integrating multi-omics data with genomic knowledge to construct pre-defined features resulted in higher performance in clinical outcome prediction and higher stability. For the grade outcome, the model with gene expression data produced an area under the receiver operating characteristic curve (AUC) of 0.7866. However, models of the integration with pathway, Gene Ontology, chromosomal gene set, and motif gene set consistently outperformed the model with genomic data only, attaining AUCs of 0.7873, 0.8433, 0.8254, and 0.8179, respectively.
Conclusions Integrating multi-omics data and genomic knowledge to improve understanding of molecular pathogenesis and underlying biology in cancer should improve diagnostic and prognostic indicators and the effectiveness of therapies.
INTRODUCTION
Translational bioinformatics is an emerging field in which basic genomic and biomedical data are translated into clinical products in order to generate clinical knowledge for use in various applications.1–3 One of the main problems in translational bioinformatics is predicting clinical outcome using molecular-based data such as gene expression profiles for improving diagnostics, prognostics, and further therapeutics.3 In particular, DNA microarray technologies have been widely used to predict clinical outcomes in several types of cancer.4–8 However, there is emerging evidence that gene expression profiles, which constitute a single level of genomic data, are insufficient for fully understanding tumor behavior or underlying tumorigenesis. This is because cancer is the phenotypic result of events cumulating through multi-omic dimensions from genome to proteome.9,10
Recent multi-omics data and clinical information emerging from cancer patients have provided unprecedented opportunities to investigate the multilayered genetic basis of disease for improving the ability to diagnose, treat, and prevent cancer. The Cancer Genome Atlas (TCGA) is a large-scale collaborative initiative to improve our understanding of the multilayered molecular basis of cancer. The TCGA research network has produced many prominent reports in the literature related to several types of cancer on interim analyses of copy number alteration (CNA), somatic mutation, miRNA, methylation, gene expression, and protein expression data.11–17 The International Cancer Genome Consortium (ICGC) is another comprehensive collaborative initiative that aims to provide a multidisciplinary description of genomic, transcriptomic, and epigenomic abnormalities in 50 different cancer types.18 While TCGA and the ICGC have opened numerous opportunities to reveal new insights on the molecular basis of cancer,18–20 it is imperative to address the issue of integration with the available multi-omics data in order to better understand cancer phenotypes, and thereby provide an enhanced global view of the interplay between the different levels of data and knowledge.
We previously proposed a graph-based framework for integrating multi-omics data including CNA, DNA methylation, miRNA, and gene expression data in predicting clinical outcomes in glioblastoma multiforme and serous cystadenocarcinoma in an intermediate integration manner.21 Instead of combining input matrices before modeling as an early integration approach, the approach of intermediate integration has the advantage that a model is trained by weighting multi-omics data simultaneously through the use of different graph levels in order to preserve data-specific properties. On the other hand, the late integration approach involves combining trained multiple models from individual types of data with a decision function to obtain better predictive performance, which is the approach adopted in the ensemble technique. In contrast to multiple independent hypotheses that have to be combined afterwards, the intermediate integration approach results in one prediction for each patient and only one hypothesis being formulated. Other strengths of our intermediate integration approach are that it can be applied using multiple scales, its flexibility, and its computation efficiency.22 However, our previous study integrated multi-omics data without considering any genomic knowledge.21
Several studies incorporating genomic knowledge such as pathways or protein–protein interaction networks based on gene expression data have been developed to increase their power in predicting clinical outcomes.23–27 In addition, Yang et al.28 proposed integrating gene expression and pathway or Gene Ontology (GO) as genomic knowledge in the development of a classifier. The findings of these studies suggest that integrating gene expression profiles with genomic knowledge to construct pre-defined features results in higher performance in predicting clinical outcomes and higher consistency between the results of different studies. Incorporating genomic knowledge will make signatures obtained from a predefined gene set more interpretable, and thus provide greater insight into the complex molecular mechanisms underlying cancer. However, to the best of our knowledge, no systematic approach has been reported for integrating the available multi-omics data and genomic knowledge for predicting clinical outcome of cancer. Here we propose a new methodological framework for integrating multi-omics data and genomic knowledge in an intermediate integration manner with the aim of better elucidating cancer phenotypes (figure 1).
Figure 1:

Schematic overview of integration with multi-omics data and genomic knowledge.
In order to highlight the validity of the proposed framework, ovarian cancer data from TCGA were adopted for predicting outcomes according to survival, stage, and grade as a baseline task. Ovarian cancer has the highest mortality among gynecological malignancies in the USA.29 Patients with ovarian cancer are likely to be diagnosed at the late stage due to its asymptomatic nature, which has resulted in poor survival statistics.30 In addition, responses to standard chemotherapy such as platinum-taxane vary among patients, and tend to be poor for advanced cases. Integrating multi-omics data and genomic knowledge for predicting clinical outcome will lead to a better understanding of the multilayered genetic determinants of ovarian cancer survival and responses to treatment, further providing the possibility of identifying alternative therapies that could improve outcomes.
MATERIALS AND METHODS
Data and genomic knowledge
Normalized multi-omics datasets in ovarian cancer were retrieved from the TCGA data portal (http://tcga-data.nci.nih.gov/; table 1). In order to directly map from genomic features to genomic knowledge such as pathway or GO gene sets, multi-omics data were summarized as a gene feature (with the exception of miRNA data). CNA data were downloaded from level 3 in the TCGA portal as segmentation results, and then divided into 23 228 gene features containing segmentation values when genes were overlapping in the segmented region. A matrix of DNA methylation was constructed containing 9129 genes mapped to probes of a DNA methylation chip. The included gene expression data and miRNA data comprised 12 042 genes and 799 miRNAs, respectively.
Table 1:
Data description
| Data type | Platform | No. of features |
|---|---|---|
| CNA | Agilent SurePrint G3 Human CGH Microarray Kit 1 × 1M | 23 228 genes |
| Methylation | Infinium Humanmethylation27 BeadChip | 9219 genes |
| Gene expression | Affymetrix HT Human Genome U133 Array Plate Set | 12 042 genes |
| miRNA | Agilent Human miRNA Microarray Rel2.0 | 799 miRNAs |
CNA, copy number alteration.
Using the clinical information from ovarian cancer patients, a binary classification problem was formulated. Three sets of classifications were defined as follows based on the clinical outcomes of ovarian cancer: (i) early stage (T1 or T2) or late stage (T3 or T4), (ii) low grade (G1 or G2) or high grade (G3 or G4), and (iii) short-term (less than 3 years) or long-term (at least 3 years) survival (table 2).31 Predefined gene sets as genomic knowledge were downloaded from the Molecular Signatures Database (MSigDB 3.0).32 We used chromosomal position (C1), pathway (C2), motif (C4), and GO (C5) gene sets from MSigDB for a further investigation involving 326, 3272, 688, and 1454 gene sets, respectively.
Table 2:
Clinical outcomes
| Clinical outcome | No. of samples (negative/positive) |
|---|---|
| Early stage (T1 or T2) vs late stage (T3 or T4) | 493 (39/454) |
| Low grade (G1 or G2) vs high grade (G3 or G4) | 381 (43/338) |
| Short-term survival (survived less than 3 years) vs long-term survival (survived longer than 3 years) | 340 (147/193) |
Constructing gene sets for miRNA data
Each predefined gene set comprises a list of genes with relevant biological annotations. However, it is difficult to directly map miRNA onto gene sets since the member of a gene set is also itself a gene. Thus, a new gene set containing miRNAs rather than genes needs to be constructed in order to integrate miRNA data and relevant genomic knowledge. Suppose we would like to perform the enrichment test of a gene set, which consists of genes, with respect to specific miRNA, which consists of its target genes. The numbers of genes in a gene set that are annotated (pi) and not annotated (pj) by the miRNA are used in a 2×2 contingency table along with the numbers of genes that are not in the gene set, and can be either annotated (pk) or not annotated (pl) with the miRNA (figure 2). Then, the enrichment test can be conducted based on the contingency table via a hypergeometric distribution. An miRNA and a specific gene set (ie, pathway) should be inserted for the procedure as an input. After calculating hypergeometric distribution based on the miRNA and its target gene information, p value for the association between the miRNA and the specific gene set can be obtained as an output. Thus, through the test for the entire miRNAs per a specific gene set, the final significant miRNA members for the gene set can be obtained. In order to construct the new gene set containing miRNAs instead of genes, enrichment tests were conducted for chromosomal position, pathway, motif, and GO gene sets (p<0.05).
Figure 2:

Framework for calculating gene sets for miRNA data.
Classification of clinical outcomes
We used a graph-based semi-supervised learning (SSL) method; this scheme falls halfway between unsupervised and supervised learning for improving the predictive power by using unlabeled data.33–36 Graph-based SSL has advantages of computational efficiency and representational ease when applied to a biological system. The learning time of graph-based SSL increases nearly linearly with the number of graph edges, however, accuracy is comparable to those of other methods such as kernel-based methods with a longer learning time.37,38 Furthermore, the graph structure could improve the interpretation of biological phenomena,39–41 which is one of the advantages of graph-based SSL.
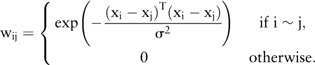
We assumed that the clinical outcomes of two patients were more likely to be similar if the two patients were more closely related to each other than to others. Therefore, the clinical outcome can be predicted based on the similarities between patients based on their genomic profiles. Edges in graph-based SSL represent similarities between cancer patients that can be extracted from different multi-omics data including CNA, methylation, miRNA, or gene expression data (figure 1). A graph is a general method for analyzing relationships between objects, with its nodes representing patients and its edges showing relationships between them. A labeled patient could be marked either by ‘−1’ or ‘1’, representing two possible clinical outcomes of low grade or high-grade, respectively. The edges perform an essential role in influencing propagation between the patients to predict the true label of the unlabeled patient. In graph-based SSL, a node i represents a patient xi (i=1, … ,n), and an edge represents a relationship between patients. A n × n symmetric weight matrix W contains an element wij as an edge strength from node i to node j. In order to calculate edge strength, a Gaussian function of Euclidean distance between patients was used:
 |
(1) |
If i is in j's k-nearest-neighborhood or vice versa, nodes i, j can be connected by an edge. The labeled nodes have labels yl ∈ {−1, 1}, while the unlabeled nodes have zeros yu=0. An n-dimensional real-valued vector f=[flTfuT]T=(f1, … ,fl, fl+1, … ,fn=l+u)T is the output of graph-based SSL. This method consists of two conditions, which are loss condition that assumes fi should be close to the given label yi in labeled nodes and smoothness condition assuming that fi should not be too different from the fi of adjacent nodes. The output f can be calculated by minimizing the quadratic function as follows33,35,36:
| (2) |
where y=(y1, … ,yl, 0, … 0)T, and the graph Laplacian matrix L42 is defined as L=D−W where D=diag(di), di=∑jwij. The parameter μ trades off smoothness condition versus loss condition. The final solution of this problem can be obtained as
| (3) |
where I is the identity matrix.
Similarity matrix incorporating genomic knowledge
One of main problems encountered in this study was calculating the similarity matrix containing genomic knowledge. The underlying idea of the proposed measure is that genes are not likely to act in isolation, but rather interact with other genes via complex signaling or regulatory networks, since cancer is caused by alteration in pathways or complete processes. Thus, in order to construct a similarity matrix containing genomic knowledge, the original matrix was converted into a new matrix containing gene sets as a new feature by aggregating values of the genes in the gene set and then dividing by the total number of gene members in a gene set for the normalization (see online supplementary figure S1). After a matrix based on genomic knowledge was constructed, a weight matrix was calculated using the Gaussian function of the Euclidean distances between patients, and then the k-nearest-neighborhood method was used for making a graph structure. Thus, patients who are closer to each other in the Euclidean space are assigned larger edge weights. This weight matrix containing genomic knowledge can be used as an input for graph-based SSL, representing a genomic knowledge graph based on the genomic profiles of the patients.
Integration of multiple graphs
Multiple graphs can be generated from multi-omics data and genomic knowledge (figure 1). Four data-driven graphs can be generated from CNA, methylation, miRNA, and gene expression data, respectively. In addition, pathway, GO, motif, and chromosomal position gene set knowledge-driven graphs can be generated based on each set of genomic data. However, the ability to predict clinical outcomes can be improved when multi-omics data is integrated with genomic knowledge. This is because a single dimension of genomic data might have limitations such as incomplete information or noise. In addition, each graph from multi-omics data can be considered as partly independent from and partly complementary to that from other graphs. Thus, it is not sufficiently accurate to predict clinical outcomes using only a single dimensional genomic data set. Multi-omics data or genomic knowledge can be integrated by employing a graph integration method via finding optimum combination coefficients when each data set is presented as a graph form.21,37,43 The main function of this method is to find the combination coefficients α for the individual graph of the following mathematical formulation:
| (4) |
where K represents the number of graphs from multi-omics data or genomic knowledge and Lk corresponds to graph-Laplacian of graph Gk. The final solution can be obtained by
| (5) |
RESULTS
For each problem, we calculated the area under the curve of the receiver operating characteristic (AUC) as a performance measure. To avoid overfitting, five-fold cross-validation was performed. Since genome-wide biological data commonly suffer from high dimensionality containing many redundant features and noise, which might be associated with low accuracy and computational difficulty, we used the Student's t test as a feature-selection method.44 Although there are many different types of feature-selection methods, such as wrapper, filter, and embedded methods,45 we used an univariate feature-selection method in the present study for emphasizing not the effect of feature selection for the accuracy but the effect of integration with multi-omics data or genomic knowledge.
Effects of integrating genomic knowledge
Figures 3–5 show the AUC performances for the three sets of clinical outcome prediction. For the low-grade versus high-grade outcome, gene expression data alone via SSL produced an AUC of 0.7866. However, the models with genomic knowledge graphs, which were obtained after transforming the original gene expression matrix based on the pre-defined gene sets, showed better performances than the model from the original gene expression data (figure 3A). These results suggest that genes are not likely to act in isolation, but rather interact with other genes in predefined gene sets such as via a pathway. In particular, the integration with gene expression data and genomic knowledge even outperformed the model with a gene expression graph or a genomic knowledge graph alone (figure 3A). Note that similar results were obtained for other genomic data: methylation, CNA, and miRNA data (figure 3B–D). For the other clinical outcomes (ie, early stage vs late stage and short-term survival vs long-term survival), the overall results showed that integration with genomic knowledge produced a gradual increase in AUC (figures 4 and 5). We found that integrating the genomic knowledge increases the power in predicting clinical outcomes.
Figure 3:

Results of low versus high grade outcome. E indicates the semi-supervised learning (SSL) model from gene expression data. E_Pathway, E_GO, E_Chr, and E_Motif represent the SSL model using pathway, GO, chromosomal position, and motif gene set based on gene expression data. E+Pathway means the model integrating a gene expression graph and a pathway-based genomic knowledge graph. A dashed line indicates the area under the curve of the model with genomic data alone. ANOVA was used for the significance test between the model with a single genomic data set alone and models from integration with a single genomic data set and genomic knowledge. An asterisk (*) indicates statistical difference among groups (p<0.05). (A) Integration results between gene expression and genomic knowledge. (B) Integration results between methylation and genomic knowledge. (C) Integration results between CNA and genomic knowledge (p=0.0495). (D) Integration results between miRNA and genomic knowledge (p=0.0026). C, CNA; CNA, copy number alteration; E, gene expression; GO, Gene Ontology; M, methylation; miR, miRNA data.
Figure 4:

Results of early versus late stage outcome. E indicates the semi-supervised learning (SSL) model from gene expression data. E_Pathway, E_GO, E_Chr, and E_Motif represent the SSL model using pathway, GO, chromosomal position, and motif gene set based on gene expression data. E+Pathway means the model integrating a gene expression graph and a pathway-based genomic knowledge graph. A dashed line indicates the area under the curve of the model with genomic data alone. ANOVA was used for the significance test between a model with a single genomic data set alone and models from integration with a single genomic data set and genomic knowledge. An asterisk (*) indicates the statistical difference among groups (p<0.05). (A) Integration results between gene expression and genomic knowledge (p=0.0394). (B) Integration results between methylation and genomic knowledge (p=0.0221). (C) Integration results between CNA and genomic knowledge. (D) Integration results between miRNA and genomic knowledge. C, CNA; CNA, copy number alteration; E, gene expression; GO, Gene Ontology; M, methylation; miR, miRNA data.
Figure 5:

Results of short-term versus long-term survival outcome. E indicates the semi-supervised learning (SSL) model from gene expression data. E_Pathway, E_GO, E_Chr, and E_Motif represent the SSL model using pathway, GO, chromosomal position, and motif gene set based on gene expression data. E+Pathway means the model integrating a gene expression graph and a pathway-based genomic knowledge graph. A dashed line indicates the area under the curve of the model with genomic data alone. ANOVA was used for the significance test between the model with a single genomic data set alone and models from integration with a single genomic data set and genomic knowledge. An asterisk (*) indicates the statistical difference among groups (p<0.05). (A) Integration results between gene expression and genomic knowledge. (B) Integration results between methylation and genomic knowledge. (C) Integration results between CNA and genomic knowledge (p=0.0037). (D) Integration results between miRNA and genomic knowledge. C, CNA; CNA, copy number alteration; E, gene expression; GO, Gene Ontology; M, methylation; miR, miRNA data.
In order to compare between data-driven integration and knowledge-driven integration, we integrated multi-omics data (ie, CNA, methylation, miRNA, and gene expression graph) as a data-driven integration, and integrated the best genomic knowledge graph from each type of genomic data (ie, C_Pathway, M_Pathway, miR_GO, and E_GO graphs) as a knowledge-driven integration for the classification of low-grade versus high-grade outcomes (figure 6). Notably, the knowledge-driven integration (AUC=0.8679) outperformed the data-driven integration (AUC=0.8243); however, there was no significant difference between them (p=0.1574, t test). Together these results suggest that the use of genomic knowledge improves the predictive power in explaining cancer phenotypes due to the co-operation between genomic processes in the pathways involved in cancer.
Figure 6:

Comparison between data-driven integration and knowledge-driven integration. C, CNA; CNA, copy number alteration; E, gene expression; M, methylation; miR, miRNA data.
Relative contribution of genomic knowledge
Biological and clinical implications can be drawn from our results. Figure 7 illustrates the following observations concerning the different contributions of genomic knowledge by the four types of genomic data. For the low-grade versus high-grade outcomes, the GO gene set performed best when incorporating gene expression data. In contrast to gene expression data, however, CNA, methylation, and miRNA data showed that integrating the pathway gene set provided the best performance (figure 7A). In the first stage of investigation we posed the following question: which genomic knowledge is more informative for predicting the clinical outcome of cancer? For three cases of clinical outcome prediction, DNA methylation data consistently showed the pathway gene set to be the best contributor in a model. However, the effect of combining genomic knowledge with other genomic data sets (ie, gene expression, CNA, or miRNA data) varied with the clinical outcome; for example, the motif gene set-based gene expression showed the best performance (figure 7). There has been no clear conclusion about the relative importance of different types of genomic knowledge such as pathway, GO, motif, and chromosomal position gene sets, and protein–protein interactions; however, our combined results suggest that the effect of genomic knowledge integration varies with clinical outcomes and the types of genomic data. However, this result may be due to the nature of the knowledge collected from each database rather than a true information benefit of any single database.
Figure 7:

Relative contribution of genomic knowledge. (A) The low versus high grade classification. (B) The early versus late stage classification. (C) The short-term versus long-term survival classification. C, CNA; CNA, copy number alteration; E, gene expression; M, methylation; miR, miRNA data.
Historical improvement of genomic knowledge
Genomic knowledge consists of pieces of accumulated biological knowledge. We therefore assumed that the predictive power of the model integrating genomic knowledge will increase as long as the quality of genomic knowledge improves. In order to validate the historical effect of integration with genomic knowledge, we compared the performances of different versions of genomic knowledge. The following five versions of MSigDB were retrieved: 1.0, 2.1, 2.5, 3.0, and 3.1, which were released in 2005, 2007, 2008, 2010, and 2012, respectively. The GO gene set was only available from MSigDB versions 2.5, 3.0, and 3.1, while other gene sets were available from all versions of MSigDB. Figure 8 shows the historical improvement of genomic knowledge for the classification of low-grade versus high-grade outcomes based on gene expression data. Notably, with the exception of the chromosomal position gene set, the AUC for the models incorporating genomic knowledge (ie, pathway, GO, and motif gene sets) increased gradually with version of genomic knowledge.
Figure 8:
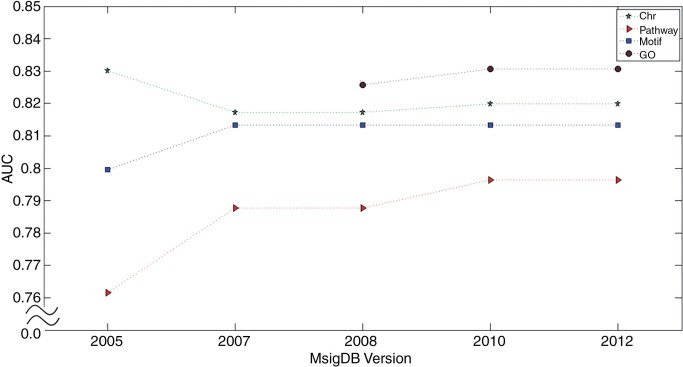
Historical improvement of genomic knowledge. Chr indicates chromosomal positional gene set, Pathway indicates pathway gene set, Motif indicates motif gene set, and GO indicates GO gene set. GO, Gene Ontology.
DISCUSSION AND CONCLUSIONS
Due to the nature of genomic features co-operating in cancer (eg, in a pathway) rather than acting in isolation, it appears beneficial to incorporate genomic knowledge when integrating multi-omics data for predicting the clinical outcome of cancer. This approach should improve the predictive power and also provide an enhanced global view of the interplay between the different levels of data and knowledge. In the present study we employed a proposed new methodological framework for integrating multi-omics data and genomic knowledge in the intermediate integration manner for better explaining cancer phenotypes. The issue of integrating heterogeneous genomic data and clinical data has recently been regarded as one of main problems in translational bioinformatics that needs to be addressed before future clinical applications can be realized.3 To the best of our knowledge, no previous studies have applied a systematic and comprehensive approach to integrating the available multi-omics and genomic knowledge for predicting the clinical outcome of cancer. Our proposed framework has the advantage of flexibility that makes it easy to integrate any kinds of genomic data or genomic knowledge due to the intermediate integration approach; this is analogous to the plug and play functionality of a computer. In addition, the strengths of graph-based integration include its high computational efficiency (which is due to its sparseness properties) combined with an accuracy that is comparable to those of other methods such as kernel-based integration.22,37
The results of our computational experiments indicated that the model incorporating genomic knowledge was greatly improved compared to the model with genomic data alone. In particular, not only gene expression data but also other types of genomic data such as CNA, methylation, and miRNA data showed the positive effect of integration with genomic knowledge. These results suggest that the use of genomic knowledge improves the predictive power in explaining cancer phenotypes because any genomic mechanisms involved in the same process (eg, a signaling or metabolic pathway) are likely to operate together in cancer. In addition, the demonstrated historical improvement of genomic knowledge (figure 8) supports the validity of our proposed framework involving the incorporation of genomic knowledge into a model. It can further be expected that the accuracy of any model integrating multi-omics data and genomic knowledge will improve as long as the quality of genomic knowledge increases in the future, which is highly likely.
Since genomic knowledge involves genes, the features of multi-omics data should be mapped to the applicable genes in order to construct similarity matrices incorporating genomic knowledge. Since miRNA has many target genes, it is difficult to map from miRNA to its target genes for the annotation of genomic knowledge such as in the GO enrichment test.46 Thus, in the present study a new gene set was constructed in order to directly map from miRNAs to the genomic knowledge based on a hypergeometric distribution. Interestingly, integrating miRNA and genomic knowledge produced a great improvement (figures 3D, 4D, and 5D). In particular, the performance of the model integrating miRNA data and pathway gene sets for the low-grade versus high-grade outcomes improved dramatically even though the original performance of miRNA was not high (figure 3D). This result suggests that our work has demonstrated how to use original multi-omic features such as miRNA, CNA loci, or CpG loci for mapping genomic knowledge.
One of the limitations of the current study was that our proposed framework does not consider the inter-relationships between multi-omics data, such as that between (i) the region where the number of genes was altered and genes located in that region, (ii) the site of DNA methylation in the promoter region and the target genes regulated by promoter regions, or (iii) the miRNA and its target genes. Thus, a framework for integrating multi-omics data should consider not only genomic knowledge but also the inter-relationships between different levels of genomic data under consideration. Furthermore, incorporating genomic knowledge increases the interpretability of signatures obtained by using predefined genomic knowledge, and thus provides greater insight into the complex molecular mechanisms underlying cancer. Therefore, future studies should attempt to obtain more information about the obtained signatures associated with clinical outcomes such as survival.
The TCGA network has generated additional cancer genomics data for about 25 cancer types, and data generation should be completed soon. The increasing amount of multi-omics data and clinical data from cancer patients and the greater availability of many genomic knowledge bases will make our proposed framework invaluable for better understanding the molecular pathogenesis and underlying biology in cancer, ultimately leading to better diagnostic strategies and candidate targets for treatment in different types of cancer.
ACKNOWLEDGMENTS
We gratefully acknowledge the TCGA Consortium and all its members for the TCGA Project initiative, for providing samples and tissues, for data processing and for making data and results available.
CONTRIBUTORS
DK and JHK designed and implemented the study and wrote the manuscript. DK, J-GJ, K-AS, HS, YRP, and MDR obtained and interpreted the experimental results. JHK provided intellectual guidance and mentorship. All of the authors read and approved the final version of the manuscript.
FUNDING
This research was supported by the Basic Science Research Program through the National Research Foundation of Korea (NRF) funded by the Ministry of Education, Science and Technology (2012-0000994) and by a grant of the Korean Health Technology R&D Project, Ministry of Health and Welfare (HI13C2164). MDR would like to gratefully acknowledge NIH grant 5R01 LM010040 and NHLBI grant 2U01 HL065962.
COMPETING INTERESTS
None.
ETHICS APPROVAL
Ethics approval was provided by the Institutional Review Board.
PROVENANCE AND PEER REVIEW
Not commissioned; externally peer reviewed.
REFERENCES
- 1.Butte AJ, Ohno-Machado L. Making it personal: translational bioinformatics. J Am Med Inform Assoc 2013;20:595–6. [DOI] [PMC free article] [PubMed] [Google Scholar]
- 2.Shah NH, Tenenbaum JD. The coming age of data-driven medicine: translational bioinformatics’ next frontier. J Am Med Inform Assoc 2012;19(e1):e2–4. [DOI] [PMC free article] [PubMed] [Google Scholar]
- 3.Butte AJ. Translational bioinformatics: coming of age. J Am Med Inform Assoc 2008;15:709–14. [DOI] [PMC free article] [PubMed] [Google Scholar]
- 4.van't Veer LJ, Dai H, van de Vijver MJ, et al. Gene expression profiling predicts clinical outcome of breast cancer. Nature 2002;415:530–6. [DOI] [PubMed] [Google Scholar]
- 5.Huang E, Cheng SH, Dressman H, et al. Gene expression predictors of breast cancer outcomes. Lancet 2003;361:1590–6. [DOI] [PubMed] [Google Scholar]
- 6.Golub TR, Slonim DK, Tamayo P, et al. Molecular classification of cancer: class discovery and class prediction by gene expression monitoring. Science 1999;286:531–7. [DOI] [PubMed] [Google Scholar]
- 7.Fan X, Shi L, Fang H, et al. DNA microarrays are predictive of cancer prognosis: a re-evaluation. Clin Cancer Res 2010;16:629–36. [DOI] [PubMed] [Google Scholar]
- 8.Berchuck A, Iversen ES, Lancaster JM, et al. Patterns of gene expression that characterize long-term survival in advanced stage serous ovarian cancers. Clin Cancer Res 2005;11:3686–96. [DOI] [PubMed] [Google Scholar]
- 9.Chin L, Gray JW. Translating insights from the cancer genome into clinical practice. Nature 2008;452:553–63. [DOI] [PMC free article] [PubMed] [Google Scholar]
- 10.Hanash S. Integrated global profiling of cancer. Nat Rev Cancer 2004;4:638–44. [DOI] [PubMed] [Google Scholar]
- 11.Cancer Genome Atlas Research Network. Genomic and epigenomic landscapes of adult de novo acute myeloid leukemia. N Engl J Med 2013;368:2059–74. [DOI] [PMC free article] [PubMed] [Google Scholar]
- 12.Kandoth C, Schultz N, Cherniack AD, et al. Cancer Genome Atlas Research Network. Integrated genomic characterization of endometrial carcinoma. Nature 2013;497:67–73. [DOI] [PMC free article] [PubMed] [Google Scholar]
- 13.TCGA Network. Comprehensive molecular characterization of human colon and rectal cancer. Nature 2012;487:330–7. [DOI] [PMC free article] [PubMed] [Google Scholar]
- 14.TCGA Network. Comprehensive genomic characterization of squamous cell lung cancers. Nature 2012;489:519–25. [DOI] [PMC free article] [PubMed] [Google Scholar]
- 15.TCGA Network. Comprehensive molecular portraits of human breast tumours. Nature 2012;490:61–70. [DOI] [PMC free article] [PubMed] [Google Scholar]
- 16.TCGA Network. Integrated genomic analyses of ovarian carcinoma. Nature 2011;474:609–15. [DOI] [PMC free article] [PubMed] [Google Scholar]
- 17.TCGA Network. Comprehensive genomic characterization defines human glioblastoma genes and core pathways. Nature 2008;455:1061–8. [DOI] [PMC free article] [PubMed] [Google Scholar]
- 18.International Cancer Genome Consortium. Hudson TJ, Anderson W, et al. International network of cancer genome projects. Nature 2010;464:993–8. [DOI] [PMC free article] [PubMed] [Google Scholar]
- 19.Noushmehr H, Weisenberger DJ, Diefes K, et al. Identification of a CpG island methylator phenotype that defines a distinct subgroup of glioma. Cancer Cell 2010;17:510–22. [DOI] [PMC free article] [PubMed] [Google Scholar]
- 20.Srinivasan S, Patric IR, Somasundaram K. A ten-microRNA expression signature predicts survival in glioblastoma. PLoS ONE 2011;6:e17438. [DOI] [PMC free article] [PubMed] [Google Scholar]
- 21.Kim D, Shin H, Song YS, et al. Synergistic effect of different levels of genomic data for cancer clinical outcome prediction. J Biomed Inform 2012;45:1191–8. [DOI] [PubMed] [Google Scholar]
- 22.Lussier YA, Li H. Breakthroughs in genomics data integration for predicting clinical outcome. J Biomed Inform 2012;45:1199–201. [DOI] [PMC free article] [PubMed] [Google Scholar]
- 23.Abraham G, Kowalczyk A, Loi S, et al. Prediction of breast cancer prognosis using gene set statistics provides signature stability and biological context. BMC Bioinform 2010;11:277. [DOI] [PMC free article] [PubMed] [Google Scholar]
- 24.Ma S, Shi M, Li Y, et al. Incorporating gene co-expression network in identification of cancer prognosis markers. BMC Bioinform 2010;11:271. [DOI] [PMC free article] [PubMed] [Google Scholar]
- 25.Taylor IW, Linding R, Warde-Farley D, et al. Dynamic modularity in protein interaction networks predicts breast cancer outcome. Nat Biotechnol 2009;27:199–204. [DOI] [PubMed] [Google Scholar]
- 26.Lee E, Chuang HY, Kim JW, et al. Inferring pathway activity toward precise disease classification. PLoS Comput Biol 2008;4:e1000217. [DOI] [PMC free article] [PubMed] [Google Scholar]
- 27.Chuang HY, Lee E, Liu YT, et al. Network-based classification of breast cancer metastasis. Mol Syst Biol 2007;3:140. [DOI] [PMC free article] [PubMed] [Google Scholar]
- 28.Yang X, Regan K, Huang Y, et al. Single sample expression-anchored mechanisms predict survival in head and neck cancer. PLoS Comput Biol 2012;8:e1002350. [DOI] [PMC free article] [PubMed] [Google Scholar]
- 29.Jemal A, Siegel R, Ward E, et al. Cancer statistics, 2009. CA Cancer J Clin 2009;59:225–49. [DOI] [PubMed] [Google Scholar]
- 30.Cannistra SA. Cancer of the ovary. N Engl J Med 2004;351:2519–29. [DOI] [PubMed] [Google Scholar]
- 31.Bild AH, Yao G, Chang JT, et al. Oncogenic pathway signatures in human cancers as a guide to targeted therapies. Nature 2006;439:353–7. [DOI] [PubMed] [Google Scholar]
- 32.Liberzon A, Subramanian A, Pinchback R, et al. Molecular signatures database (MSigDB) 3.0. Bioinformatics 2011;27:1739–40. [DOI] [PMC free article] [PubMed] [Google Scholar]
- 33.Chapelle O, Weston J, Scholkopf B. Cluster kernels for semi-supervised learning. Adv Neural Inf Process Syst (NIPS) 2003;15:585–92. [Google Scholar]
- 34.Zhu X, Ghahramani Z, Lafferty J. Semi-supervised learning using Gaussian fields and harmonic functions. Proceedings of the Twenty-first International Conference on Machine Learning (ICML); Washington, DC, AAAI Press, 2003:912–19. [Google Scholar]
- 35.Belkin M. Regularization and semi-supervised learning on large graphs. Proceedings of the 17th Annual Conference on Learning Theory (COLT) 3120 Lecture Notes in Computer Science; 2004:624–38. [Google Scholar]
- 36.Zhou D, Bousquet O, Weston J, et al. Learning with local and global consistency. Adv Neural Inf Process Syst (NIPS) 2004;16:321–8. [Google Scholar]
- 37.Tsuda K, Shin H, Scholkopf B. Fast protein classification with multiple networks. Bioinformatics 2005;21(Suppl 2):ii59–65. [DOI] [PubMed] [Google Scholar]
- 38.Shin H, Tsuda K. Prediction of protein function from networks. In: Chapelle O, Schölkopf B, Zien A. eds. Semi-supervised learning. MIT Press, 2006:339–52; Chapter 20. [Google Scholar]
- 39.Spellman PT, Sherlock G, Zhang MQ, et al. Comprehensive identification of cell cycle-regulated genes of the yeast Saccharomyces cerevisiae by microarray hybridization. Mol Biol Cell 1998;9:3273–97. [DOI] [PMC free article] [PubMed] [Google Scholar]
- 40.Segal E, Shapira M, Regev A, et al. Module networks: identifying regulatory modules and their condition-specific regulators from gene expression data. Nat Genet 2003;34:166–76. [DOI] [PubMed] [Google Scholar]
- 41.Ohn JH, Kim J, Kim JH. Genomic characterization of perturbation sensitivity. Bioinformatics 2007;23:i354–8. [DOI] [PubMed] [Google Scholar]
- 42.Chung FRK. Spectral graph theory. Number 92 in Regional Conference Series in Mathematics; 1997. [Google Scholar]
- 43.Shin H, Lisewski AM, Lichtarge O. Graph sharpening plus graph integration: a synergy that improves protein functional classification. Bioinformatics 2007;23:3217–24. [DOI] [PubMed] [Google Scholar]
- 44.Jafari P, Azuaje F. An assessment of recently published gene expression data analyses: reporting experimental design and statistical factors. BMC Med Inform Decis Mak 2006;6:27. [DOI] [PMC free article] [PubMed] [Google Scholar]
- 45.Saeys Y, Inza I, Larranaga P. A review of feature selection techniques in bioinformatics. Bioinformatics 2007;23:2507–17. [DOI] [PubMed] [Google Scholar]
- 46.Lee SY, Sohn KA, Kim JH. MicroRNA-centric measurement improves functional enrichment analysis of co-expressed and differentially expressed microRNA clusters. BMC Genomics 2012;13(Suppl 7):S17. [DOI] [PMC free article] [PubMed] [Google Scholar]