

Abstract
Objective Meningioma consistency is important because it affects the difficulty of surgery. To predict preoperative consistency, several methods have been proposed; however, they lack objectivity and reproducibility. We propose a new method for prediction based on tumor to cerebellar peduncle T2-weighted imaging intensity (TCTI) ratios.
Design The magnetic resonance (MR) images of 20 consecutive patients were evaluated preoperatively. An intraoperative consistency scale was applied to these lesions prospectively by the operating surgeon based on Cavitron Ultrasonic Surgical Aspirator (Valleylab, Boulder, Colorado, United States) intensity. Tumors were classified as A, very soft; B, soft/intermediate; or C, fibrous. Using T2-weighted MR sequence, the TCTI ratio was calculated. Tumor consistency grades and TCTI ratios were then correlated.
Results Of the 20 tumors evaluated prospectively, 7 were classified as very soft, 9 as soft/intermediate, and 4 as fibrous. TCTI ratios for fibrous tumors were all ≤ 1; very soft tumors were ≥ 1.8, except for one outlier of 1.66; and soft/intermediate tumors were > 1 to < 1.8.
Conclusion We propose a method using quantifiable region-of-interest TCTIs as a uniform and reproducible way to predict tumor consistency. The intraoperative consistency was graded in an objective and clinically significant way and could lead to more efficient tumor resection.
Keywords: meningioma consistency, meningioma imaging, meningioma surgery, brain tumor, Cavitron Ultrasonic Surgical Aspirator (CUSA)
Introduction
The general consistency of meningiomas affects the difficulty of surgery.1 Preoperative prediction of consistency contributes to decision making regarding surgical approach, instruments, and resectability.1 Soft tumors, which are easily removed utilizing suction or Cavitron Ultrasonic Surgical Aspirator (CUSA) (Valleylab, Boulder, Colorado, United States) at a very low setting, lend themselves to easy debulking in which surgery is often faster. Firmer tumors, which are more difficult to debulk, generally are more tedious and take longer to resect. They are also more difficult to dissect from cortical neurovascular structures, which affects the morbidity of surgery.
No single objective and reproducible method currently exists to predict meningioma consistency. Many methods have been introduced utilizing imaging modalities such as magnetic resonance (MR) imaging, MR elastography, MR spectroscopy, fractional anisotropy, and computed tomography (CT).2 3 4 5 Based on these studies, it is suggested that hypointensity on T2 correlates with a more fibrous and firm lesion or increased difficulty of resection.1 2 3 Increased T2 signal intensity correlates with increased tissue water content and thus softness.1 3 4 6 7 8 9 Decreased T2 signal intensity correlates with more fibrous and collagen components and thus firmness.1 3 4 7 8 9 10 Other routine sequences including T1 and proton density (PD) seemed to lack significant association in previous studies.1 6
Many of these methods are subjective with no clear definition of hypo- and hyperintense tumor or lack reproducibility. In addition, the intraoperative grading of tumor consistency is typically not defined objectively, which limits reproducibility among different surgeons. Furthermore, most of the available literature on this topic consists of a retrospective collection of data relying on operative reports to determine the consistency of the tumor during surgery. Such a method is obviously limited by the accuracy of the operative notes available.
In this article we propose an objective and reproducible method for both preoperative prediction of consistency and intraoperative grading of tumor consistency. The method was developed after collecting data on 20 consecutive patients.
Design
Patients
This was a prospective imaging study of 20 consecutive patients who underwent meningioma resection at one academic medical facility. All patients were operated on by a single surgeon (R.C.). Locations of meningiomas included 4 convexity and 16 skull base. The MR images were reviewed independently by a radiologist (J.L.) blinded to the operative findings. Tumor to cerebellar peduncleT2-weighted imaging intensity (TCTI) ratios were calculated independent of consistency grades. TCTI ratios and grades were then correlated.
Clinical Setting
During surgery, the surgeon predicts the complexity of a resection based on the size and location of a tumor. Tumor consistency also affects complexity. Tumors that are soft in consistency tend to be easier to remove and often take less time than expected. Tumors that are hard in consistency tend to be more difficult to remove and often take more time than expected. A grading scale of consistency was developed based on CUSA intensity (Table 1). Cutoff values for CUSA intensity are < 40 for grade A, very soft; 40 to 70 for grade B, soft/intermediate; and > 70 for grade C, firm. These amplitudes denote the lowest CUSA setting possible to adequately remove the tumor, even if higher settings were used for more rapid surgery. These category values were chosen by the operating surgeon who believed that they correlate well with ease of debulking and dissection and would be clinically relevant.
Table 1. Grading scale for intraoperative consistency.
| Grade | Method of resection |
|---|---|
| A (soft) | Can be removed with: |
| Suction or CUSA, amplitude < 40 | |
| B (intermediate) | Can be removed with: |
| CUSA, amplitude 40–70 | |
| C (firm) | Can be removed with: |
| CUSA, amplitude > 70 |
Imaging
Standard MR imaging sequence was chosen for developing a prediction method because this imaging modality does not require special equipment or interpretation and can be done without special sequences. MR sequences reviewed included T1, T2, diffusion-weighted imaging, and fluid-attenuated inversion recovery (FLAIR). Sequence T2 appeared to correlate best with the surgeon's rating of consistency. We found no significant correlation with other sequences and consistency.
Utilizing T2 sequence on MR, tumor to cerebellar peduncle TCTI ratios were calculated (Fig. 1). Examples of TCTI ratio calculations are shown in Figs. 2 and 3. Regions of interest (ROIs) were drawn within the tumor for an average value of intensity. For intensity comparison, the middle cerebellar peduncle was chosen, and ROIs were sampled here. Many studies have used the cortex for comparison, but these areas are relatively thin and serpiginous. The cerebellar peduncles are larger and more uniform structures, and therefore they should reduce sample error from erroneously including sulci or subarachnoid space in the ROI field for volume averaging. A ratio was calculated that we named the TCTI ratio.
Fig. 1.
How to use the tumor to cerebellar peduncle T2-weighted imaging intensity (TCTI) ratio. (A) Region of interest (ROI) in tumor on T2 sequence. (B) ROI in middle cerebellar peduncle on T2 sequence. Calculating the TCTI ratio. TCTI ratio = intensity value for ROI within tumor (A)/Intensity value for ROI within middle cerebellar peduncle (B).
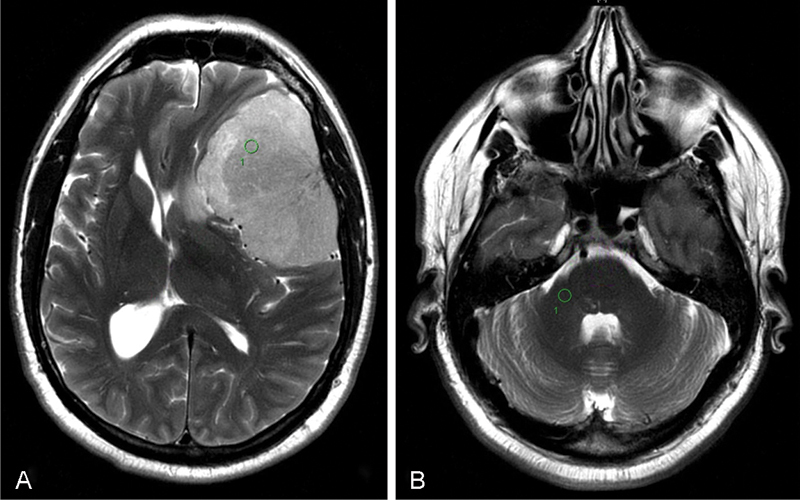
Fig. 2.
Tumor to cerebellar peduncle T2-weighted imaging intensity (TCTI) ratio example. (A) Region of interest (ROI) intensity within tumor = 976.6. (B) ROI intensity within middle cerebellar peduncle = 435.4. TCTI ratio = 976.6/435.4 = 2.243. Green circle indicates ROI chosen for calculation.
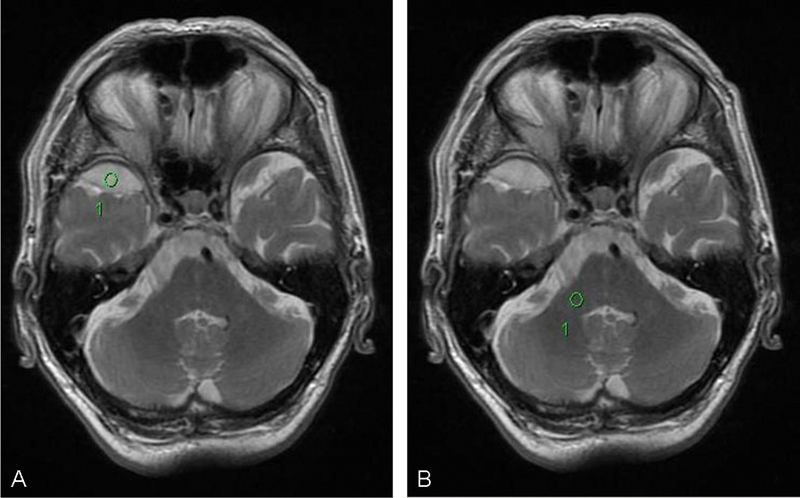
Fig. 3.

Tumor to cerebellar peduncle T2-weighted imaging intensity (TCTI) ratio example. (A) Region of interest (ROI) intensity within tumor = 341.3. (B) ROI intensity within cerebellar peduncle = 438.2. TCTI ratio = 341.3/438.2 = 0.779. Green circle indicates ROI chosen for calculation.
Results
Imaging and operative data were collected on 20 consecutive patients. Table 2 shows the results of the data analysis. Six patients were male; 14 were female. Patient ages ranged from 36 to 79 years. Mean age was 55.9 years; median age was 53 years. Tumor size ranged from 1.8 cm to 7.5 cm. Mean size was 3.75 cm; median size was 3.55 cm.
Table 2. Patient data.
| Age, y | Sex | Location | Size, cm | TCTI ratio | Clinical consistency | |
|---|---|---|---|---|---|---|
| 1 | 68 | M | Olfactory groove | 4.0 | 1.96 | Soft |
| 2 | 71 | M | Sphenoid wing | 3.3 | 2.8 | Soft |
| 3 | 54 | F | Tuberculum sella | 2.3 | 1.66 | Soft |
| 4 | 45 | F | Planum sphenoidale | 3.6 | 1.88 | Soft |
| 5 | 49 | F | Sellar/suprasellar | 5.6 | 1.79 | Soft |
| 6 | 66 | F | Foramen magnum | 2.7 | 2.16 | Soft |
| 7 | 58 | M | Sphenoid wing | 7.5 | 2.53 | Soft |
| 8 | 50 | F | Sphenoid wing | 4.7 | 1.74 | Intermediate |
| 9 | 64 | M | Rt parietal convexity | 4.1 | 1.27 | Intermediate |
| 10 | 47 | F | Planum sphenoidale | 3.5 | 1.38 | Intermediate |
| 11 | 68 | F | Sphenoid wing | 5.9 | 1.13 | Intermediate |
| 12 | 36 | M | Lt anterior fossa/Cribriform plate | 2.8 | 1.44 | Intermediate |
| 13 | 41 | F | Lt parietal convexity | 4.0 | 1.72 | Intermediate |
| 14 | 76 | F | Rt orbital roof | 1.8 | 1.64 | Intermediate |
| 15 | 61 | F | Rt frontal convexity | 3.4 | 1.6 | Intermediate |
| 16 | 79 | M | Tuberculum sella | 3.3 | 1.75 | Intermediate |
| 17 | 36 | F | Pineal region | 2.5 | 0.88 | Firm |
| 18 | 46 | F | Lt occipital convexity | 3.7 | 0.42 | Firm |
| 19 | 52 | F | Foramen magnum | 2.1 | 0.71 | Firm |
| 20 | 51 | F | Lt petrous ridge | 4.1 | 0.53 | Firm |
Abbreviations: F, female; Lt, left; M, male; Rt, right; TCTI, tumor to cerebellar peduncle T2-weighted imaging intensity.
Based on intraoperative CUSA settings, the consistency of the tumors were analyzed. Grade A, very soft consistency, required CUSA intensity < 40 or were easily removed with suction alone. Seven tumors were grade A. Grade B, soft/intermediate consistency, required CUSA intensity between 40 and 70. Nine tumors were grade B. Grade C, firm consistency, required CUSA intensity > 70. Four tumors were grade C.
TCTI ratios for all 20 tumors ranged from 0.42 to 2.8. Overall mean TCTI ratio was 1.54. Grade A tumors were correlated with TCTI ratios > 1.8, with the exception of one outlier of 1.66. Mean TCTI ratio for this category was 2.11; median was 1.96. Grade B tumors were correlated with TCTI ratios of 1.0 to 1.8. Mean TCTI ratio was 1.51; median was 1.6. Grade C tumors were correlated with TCTI ratios < 1.0. Mean TCTI ratio was 0.6; median was 0.62. In general, TCTI ratios correlated quite well with intraoperative findings of consistency.
Discussion
Meningiomas are one of the most common primary neoplasms of the central nervous system, and although their course is usually indolent, surgical resection remains a mainstay therapy.1 Thus preoperative planning remains an important part of meningioma resection and depends on tumor location, size, and consistency.1 3 9 Prediction of consistency is beneficial because it predicts resectability and the difficulty of surgery in addition to assisting operative planning.1 6 9 Duration of surgery also somewhat depends on meningioma consistency in addition to size and location. Soft tumors are more easily resected with suction or CUSA at a low setting, leading to shorter operative times. Harder tumors are more difficult to resect, leading to increased degree of surgical difficulty and increased operation times. If these firm tumors are encasing neurovascular structures, difficulty of resection increases further. Having the ability to predict meningioma consistency before surgery would allow for more efficient operative planning and choice of resection strategy.1 This is particularly important for surgical outcome of tumors located in difficult locations or in the skull base.3 6
No standardized method exists at this time to predict meningioma consistency. Some models exist, but, in general, these methods have shortcomings in objectivity and reproducibility. Additionally some modalities require special equipment or radiologist training for interpreting the results.
CT, fractional anisotropy, and various sequences of MRI including T1, T2, PD, elastography, and spectroscopy have been utilized in an attempt to develop a prediction method. Current studies have shown mixed results for various modalities. Meningioma consistency has shown significant correlation with fractional anisotropy.3 However, this modality requires special techniques and trained professionals to interpret the results, which restricts its generalizability. MR T2-weighted imaging may be the most promising modality for significant correlation and ease of acquisition and interpretation. T2 sequences have shown significant correlation with consistency in several studies.1 4 6 7 8 9 11 MR T2 hyperintensity correlates with increased tissue water content and softer tumors.1 3 4 6 7 8 9 MR T2 hypointensity correlates with more fibrous and harder tumors.1 3 4 7 8 9 10 MR T2 FLAIR sequence showed potential for correlation in a recent study1 but lacked significant correlation in our patient series. PD-weighted imaging has shown mixed results with some correlation noted in two case series but no significant correlation noted in another series.6 11 12 MR T1-weighted imaging appears to lack significant correlation in multiple studies.1 6 9 11 12 Additionally, several studies suggest that a combination of sequences may produce a more significant result. For instance, T2 hyperintensity with T1 hypointensity showed correlation with soft consistency in one study.9
The grading of intensity for categorizing consistency is still somewhat subjective and based on the interpreting radiologist. One scale places intensity into one of five categories based on comparisons with surrounding structures such as bone and cerebrospinal fluid.10
Clinical consistency grading also lacks objectivity and generalizability in most studies. Most studies rate consistency intraoperatively by one operating surgeon based on his or her experience, but this lacks objectivity when comparing consistencies of tumors removed by another surgeon. One system classifies consistency based on the instruments used for the majority of tumor volume removal including suction, ultrasonic aspirator, loop electrocautery, or sharp dissection.1 Although this classification system incorporates a full range of instruments, no systems have the objectivity of a numeric continuum.
In the present study, we sought an objective numeric method of rating tumor intensity. We also sought an objective numeric method of rating tumor consistency. Analyses of both methods were made to evaluate correlation of intensity and consistency. Our grading scale of consistency utilizing CUSA intensity places tumors on a numeric continuum. This allows generalization to other surgeons using the same scale. The main limitation of this method would be availability of CUSA equipment.
Conclusion
In the present study, TCTI ratios were measured utilizing ROIs for numeric values of intensity. These ratios allow precise objectivity and generalizability to other surgeons. We found that MR T2-weighted imaging had the best correlation with consistency and other sequences lacked significant correlation.
Tumor consistency was strongly correlated with T2-weighted imaging and TCTI ratios. Hyperintensity or TCTI ratios > 1.8 correlate with softer tumors (grade A: can be removed with suction of CUSA amplitude < 40). Hypointensity or TCTI ratios < 1.0 correlate with harder tumors (grade C: can be removed with CUSA amplitude > 70). Presurgical prediction of consistency will add value for surgical planning and surgical outcome. We plan to complete a second validation study of a larger number of patients to confirm these results and evaluate correlation of the TCTI ratios and clinical consistency.
Footnotes
Disclosures The authors report no conflict of interest concerning the materials or methods used in this study or the findings specified in this article.
References
- 1.Sitthinamsuwan B, Khampalikit I, Nunta-aree S, Srirabheebhat P, Witthiwej T, Nitising A. Predictors of meningioma consistency: a study in 243 consecutive cases. Acta Neurochir (Wien) 2012;154(8):1383–1389. doi: 10.1007/s00701-012-1427-9. [DOI] [PubMed] [Google Scholar]
- 2.Murphy M C, Huston J III, Glaser K J. et al. Preoperative assessment of meningioma stiffness using magnetic resonance elastography. J Neurosurg. 2013;118(3):643–648. doi: 10.3171/2012.9.JNS12519. [DOI] [PMC free article] [PubMed] [Google Scholar]
- 3.Kashimura H, Inoue T, Ogasawara K. et al. Prediction of meningioma consistency using fractional anisotropy value measured by magnetic resonance imaging. J Neurosurg. 2007;107(4):784–787. doi: 10.3171/JNS-07/10/0784. [DOI] [PubMed] [Google Scholar]
- 4.Chernov M F, Kasuya H, Nakaya K. et al. 1H-MRS of intracranial meningiomas: what it can add to known clinical and MRI predictors of the histopathological and biological characteristics of the tumor? Clin Neurol Neurosurg. 2011;113(3):202–212. doi: 10.1016/j.clineuro.2010.11.008. [DOI] [PubMed] [Google Scholar]
- 5.Pfisterer W K, Nieman R A, Scheck A C, Coons S W, Spetzler R F, Preul M C. Using ex vivo proton magnetic resonance spectroscopy to reveal associations between biochemical and biological features of meningiomas. Neurosurg Focus. 2010;28(1):E12. doi: 10.3171/2009.11.FOCUS09216. [DOI] [PubMed] [Google Scholar]
- 6.Yamaguchi N, Kawase T, Sagoh M, Ohira T, Shiga H, Toya S. Prediction of consistency of meningiomas with preoperative magnetic resonance imaging. Surg Neurol. 1997;48(6):579–583. doi: 10.1016/s0090-3019(96)00439-9. [DOI] [PubMed] [Google Scholar]
- 7.Maiuri F, Iaconetta G, de Divitiis O, Cirillo S, Di Salle F, De Caro M L. Intracranial meningiomas: correlations between MR imaging and histology. Eur J Radiol. 1999;31(1):69–75. doi: 10.1016/s0720-048x(98)00083-7. [DOI] [PubMed] [Google Scholar]
- 8.Yrjänä S K, Tuominen H, Karttunen A, Lähdesluoma N, Heikkinen E, Koivukangas J. Low-field MR imaging of meningiomas including dynamic contrast enhancement study: evaluation of surgical and histopathologic characteristics. AJNR Am J Neuroradiol. 2006;27(10):2128–2134. [PMC free article] [PubMed] [Google Scholar]
- 9.Hoover J M, Morris J M, Meyer F B. Use of preoperative magnetic resonance imaging T1 and T2 sequences to determine intraoperative meningioma consistency. Surg Neurol Int. 2011;2:142. doi: 10.4103/2152-7806.85983. [DOI] [PMC free article] [PubMed] [Google Scholar]
- 10.Soyama N, Kuratsu J, Ushio Y. Correlation between magnetic resonance images and histology in meningiomas: T2-weighted images indicate collagen contents in tissues. Neurol Med Chir (Tokyo) 1995;35(7):438–441. doi: 10.2176/nmc.35.438. [DOI] [PubMed] [Google Scholar]
- 11.Suzuki Y, Sugimoto T, Shibuya M, Sugita K, Patel S J. Meningiomas: correlation between MRI characteristics and operative findings including consistency. Acta Neurochir (Wien) 1994;129(1–2):39–46. doi: 10.1007/BF01400871. [DOI] [PubMed] [Google Scholar]
- 12.Carpeggiani P, Crisi G, Trevisan C. MRI of intracranial meningiomas: correlations with histology and physical consistency. Neuroradiology. 1993;35(7):532–536. doi: 10.1007/BF00588715. [DOI] [PubMed] [Google Scholar]