

Abstract
Gene delivery to the central nervous system (CNS) has potential as a means for treating numerous debilitating neurological diseases. Non-viral gene vector platforms are tailorable and can overcome key limitations intrinsic to virus-mediated delivery; however, lack of clinical efficacy with non-viral systems to date may be attributed to limited gene vector dispersion and transfection in vivo. We show that the brain extracellular matrix strongly limits penetration of polymer-based gene vector nanoparticles through the brain parenchyma, even when they are very small (<60 nm) and coated with a polyethylene glycol (PEG) corona of typical density. Following convection enhanced delivery (CED), these “conventional gene vectors” were confined to the injection site, presumably by adhesive interactions with the brain extracellular matrix, and did not provide gene expression beyond the point of administration. In contrast, we found that incorporating highly PEGylated polymers allowed production of compacted (~43 nm) and colloidally stable DNA nanoparticles that avoided adhesive trapping within the brain parenchyma. When administered by CED into the rat striatum, highly PEGylated DNA nanoparticles distributed throughout and provided broad transgene expression without vector-induced toxicity. The use of these “brain-penetrating gene vectors”, in conjunction with CED, offers an avenue to improve gene therapy for CNS diseases.
Keywords: CNS diseases, non-viral gene therapy, brain tissue barrier, convection enhanced delivery, extracellular matrix
Graphical abstract
1. Introduction
The growing knowledge of specific genetic targets that can alter or reverse the progression of central nervous system (CNS) diseases has made gene therapy an attractive therapeutic strategy.[1–2] Multiple preclinical and clinical studies have aimed to improve the delivery of nucleic acids to the CNS using viral or non-viral gene vectors, with specific focus on enhancing the level and distribution of transgene expression throughout the brain tissue.[1,3] Viral gene vectors, though relatively efficient, have been limited by low packaging capacity, technical difficulties in scale-up, high cost of production[4] and/or risk of mutagenesis.[5] Furthermore, neutralizing immune responses may occur with repeated administrations or after prior exposures.[2,6] Non-viral gene vectors are an alternative strategy for gene delivery without many of the limitations of viral vectors.[1]
Cationic polymer-based gene vectors provide a tailorable platform for DNA condensation and gene transfer in vitro and in vivo. The positive charge density allows for stable compaction of negatively charged nucleic acids,[7] protecting them from enzymatic degradation.[8] Also, the protonatable amines provide increased buffering capacity that may facilitate endosome escape via the proton sponge effect, leading to efficient intracellular trafficking and transgene expression.[9] A wide variety of cationic polymers have been developed to improve nucleic acid delivery, and in vitro transfection efficiency has been commonly used as a means to predict their performance in vivo.[10–11] However, in vitro studies do not take into account the gene vector physicochemical properties required for efficient in vivo gene transfer.[12] Also, gene vectors may not retain the same physicochemical properties and stability in physiological conditions.[13] In fact, key nanoparticle (NP) qualities required for effective in vitro gene transfer often have the opposite effect in vivo. For example, in vitro screening may favor NP that aggregate and settle on adherent cells,[14] a feature that prevents gene vectors from efficiently overcoming various extracellular barriers and reaching target cells in vivo.[15] Thus, we sought to design a synthetic gene delivery platform tailored for optimal gene delivery to the brain in vivo.
Non-viral gene vectors must overcome numerous biological barriers to reach target cells in the brain.[1] Various strategies have been developed to manipulate or bypass the blood brain barrier (BBB),[16] which is the primary barrier to the systemic delivery of gene vectors to the brain. These approaches include, but are not limited to, direct administration to the CNS [17] and reversible disruption of the BBB via focused ultrasound [18] or chemical agents.[19] However, once beyond the BBB, the anisotropic and electrostatically charged extracellular matrix (ECM) found between brain cells has been widely recognized as another critical barrier.[20–21] This ‘brain tissue barrier’ limits distribution of macromolecules and NP in the brain, thereby preventing their access to target cells in disseminated neurological diseases.[20–23] The ECM is rich in hyaluronan, chondroitin sulfate, proteoglycans, link proteins and tenascins, and may provide a negatively charged adhesive barrier to the penetration of cationic polymer-based gene vectors.[21,24] Moreover, the pores formed by ECM proteins impose a steric barrier to the penetration of NP through brain tissue.[20,25] We recently demonstrated that sub-114 nm NP rapidly diffuse in the brain ECM if they are well-coated with hydrophilic and neutrally-charged polyethylene glycol (PEG), providing improved distribution of therapeutics.[20]
Convection enhanced delivery (CED) can further enhance the distribution of therapeutics by providing a pressure gradient during intracranial administration.[26] However, CED is unlikely to provide a significant benefit if particles are trapped in the brain parenchyma due to adhesive interactions and/or steric obstruction. Previous reports have demonstrated that, even following CED, the interactions between positively charged gene vectors and the negatively charged ECM confine NP to the point of injection and perivascular spaces, and limit their penetration into, and distribution throughout, the brain parenchyma.[22,25,27] Thus, designing particles with surfaces that minimize interactions with the brain ECM may improve CED-mediated enhanced particle distribution in the brain.[25–26]
We aimed to develop a DNA NP platform with the physicochemical properties required for efficient brain penetration by polymeric NP, namely, a non-adhesive surface coating and small particle diameter in comparison to the average ECM mesh spacing.[20] We formulated highly PEGylated brain-penetrating DNA NP (DNA-BPN), conventionally PEGylated DNA NP (DNA-CPN), and un-PEGylated DNA NP (DNA-UPN) and characterized their toxicity, cell uptake, and transfection efficiency in vitro. We then used high resolution multiple particle tracking (MPT) to compare their ability to avoid adhesive trapping (as measured by diffusive transport rates) in freshly excised rodent brain tissues ex vivo. Finally, we investigated NP distribution and transfection in brain tissue following administration in vivo by CED.
2. Results
To effectively shield the positive surface charge intrinsic to cationic gene vectors, we formulated gene vectors using copolymers of polyethyleneimine (PEI) conjugated to multiple 5 kDa PEG molecules (PEG5k-PEI) with a range of PEG to PEI molar ratios. As previously reported, PEGylation of cationic polymers may have a negative influence on DNA complexation due to reduction of available positive charges and additional steric hindrance by the PEG chains after conjugation.[28] Thus, using only highly PEGylated PEI to condense DNA copolymers yields loose, unstable gene vectors that are not likely to retain their stability in biological environments.[29] In order to achieve compact and colloidally stable gene vectors, we formulated vectors with a blend of PEG5k-PEI and free PEI, with 25% of the total amines deriving from free PEI.[29] Using a fixed amount of free PEI, we achieved DNA compaction into ~50 nm DNA NP using PEG5k-PEI copolymers with a wide range of PEG to PEI molar ratios (Table S1). Importantly, we found that the use of a copolymer with a PEG to PEI ratio of 26, which is substantially higher than PEGylation ratios used typically,[28,30–32] is sufficient to form gene vectors with a near neutral ζ-potential (Table 1 and S1) (brain penetrating nanoparticles; DNA-BPN); near-neutral ζ-potential has been shown to be key to enabling NP diffusion in brain tissue.[20] We also prepared conventionally PEGylated DNA NP (DNA-CPN) consisting of PEGylated PEI with a more conventional PEG to PEI ratio of 8,[28,33–34] and un-PEGylated DNA NP (DNA-UPN). The physicochemical properties of DNA-BPN, DNA-CPN and DNA-UPN are summarized in Table 1. Of note, DNA-CPN possessed a larger particle diameter and more positive surface charge compared to DNA-BPN, (59 nm ± 1 nm and 9.3 mV ± 0.5 mV for DNA-CPN; 43 nm ± 5 nm and 2.9 mV ± 0.3 mV for DNA-BPN) suggesting looser compaction and/or inferior surface coating of DNA-CPN.
Table 1.
Physicochemical properties and diffusivity of gene vectors in cortical tissue
| PEG/PEI w/w(a) | Hydrodynamic Diameter ± SEM [nm](b) | ζ-potential ± SEM [mV](b) | PDI(b) | Hydrodynamic Diameter in ACSF [nm](c) | MSDAQ/MSDBrain(d) | |
|---|---|---|---|---|---|---|
| DNA-UPN | 0 | 47 ± 2 | 26 ± 1.2 | 0.15 | 1071 ± 53 | 6900 |
| DNA-CPN | 1.6 | 59 ± 1 | 9.3 ± 0.5 | 0.17 | 193 ± 4 | 930 |
| DNA-BPN | 3.9 | 43 ± 5 | 2.9 ± 0.3 | 0.19 | 80 ± 9 | 260 |
PEG/PEI weight to weight ratio used to formulate respective NP.
Size, ζ-potential and polydispersity (PDI) were measured by dynamic light scattering (DLS) in 10 mM NaCl at pH 7.0 and are presented as an average of at least 3 measurements ± standard error of the mean (SEM).
Hydrodynamic diameter in aCSF was measured by DLS following incubation in aCSF at 37 °C for 1 h.
MSD at 1 s was measured using MPT of fluorescently labeled gene vectors in rodent brain slice. NP diffusivity in aCSF was calculated using the Stokes-Einstein equation and the mean particle diameter.
To predict the particle stability of gene vectors following in vivo administration, we characterized in vitro stability in artificial cerebrospinal fluid (aCSF) at 37°C over time (Figure 1A). DNA-UPN rapidly aggregated after addition to aCSF; the hydrodynamic diameter immediately increased 8.3-fold, from 47 nm ± 2 nm to 392 nm ± 32 nm, and became over 1 μm within an hour (Table 1, Figure 1A). After 7 h, the polydispersity index (PDI) of DNA-UPN was greater than 0.5 (PDI = 0.97), indicating loss of colloidal stability. DNA-CPN diameter increased ~3-fold within 30 min of addition to aCSF, from 59 nm ± 1 nm to 172 nm ± 5 nm, and then remained stable at the larger size for 24 h (Figure 1A). In contrast, DNA-BPN exhibited improved stability in aCSF compared to both DNA-UPN and DNA-CPN. DNA-BPN size remained relatively unchanged over the first 30 min in aCSF at 50 nm ± 17 nm, followed by a 1.6-fold increase in diameter that remained stable over the remaining 24 h (Table 1, Figure 1A). These observations were further confirmed by transmission electron micrographs (TEM) of gene vectors in ultrapure water (Figure 1B, upper row) and after 1 h incubation in aCSF at 37 °C (Figure 1B, lower row).
Figure 1. Stability of gene vector in artificial cerebrospinal fluid.

(A) Hydrodynamic diameter of gene vectors in aCSF at 37 °C was measured by dynamic light scattering (DLS). Measurements were taken every 30 min up to 24 hours until polydispersity (PDI) > 0.5. Data represents the mean ± SEM. Note that hydrodynamic diameters of DNA-CPN and DNA-BPN are overlapping at 0 h. Arrows denote hydrodynamic diameters of DNA-UPN, DNA-CPN and DNA-BPN at 30 min post-incubation. (B) Transmission electron microscopy images of gene vectors in ultrapure water (top panel) and following 1 h incubation in aCSF at 37 °C (bottom panel). Scale bars = 100 nm.
Despite their wide use as non-viral gene vector systems, concern has been raised about the potential toxicity of PEI-based gene vectors due to their high positive charge density.[28,31] To gain insight into their potential safety for administration to the CNS, we thoroughly characterized the in vitro toxicity mediated by the various DNA NP (BPN, CPN and UPN) at concentrations ranging from 1 to 10 μg/ml in primary astrocytes derived from neonatal rabbits (Figure 2A) and rats (Figure 2B), as well as 9L rat gliosarcoma cells (Figure 2C) following 24 h incubation. Both DNA-UPN and DNA-CPN exhibited cytotoxicity in all three cells lines tested; DNA-UPN resulted in 50% cell death at 5, 10, and 10 μg/ml of plasmid concentration for primary rabbit astrocytes, primary rat astrocytes and 9L cells, respectively. Similarly, DNA-CPN resulted in more than 50% cell death at 10 μg/ml for primary rabbit and rat astrocytes. DNA-CPN treatment of 9L gliosarcoma cells at 5 and 10 μg/ml of plasmid resulted in approximately 30% cell death. Contrary to these findings, the DNA-BPN were non-toxic in rabbit primary astrocytes and 9L gliosarcoma cells, and showed only mild toxicity in rat primary astrocytes even at a high concentration of 10 μg/ml (Figure 2). Similar trends were observed after incubation with gene vectors for 48 and 72 h (Figure S2). To further demonstrate the increased safety of PEI afforded by the higher PEG density, we compared the toxicity of DNA-BPN to a poly-L-lysine (PLL) PEG copolymer (PEG-PLL) DNA NP system shown to be safe in animals[35–36] and humans.[37] DNA-BPN and PEG-PLL exhibited similar safety profiles in all three cell types at varying concentrations (Figure 2). We used histology to further characterize the in vivo safety profile of these gene vectors following CED in the rat striatum. DNA-UPN treated rats demonstrated higher average toxicity scores compared to DNA-CPN, DNA-BPN and normal saline controls. In contrast, the average toxicity scores in the brains of DNA-BPN and DNA-CPN treated rats were comparable to those of saline-treated controls (Figure 2D), suggesting that they were well-tolerated at the dose administered (1 mg/ml, 20 μl). Importantly, regardless of the gene vector type, inflammatory and hemorrhagic changes were confined around the injection site and did not propagate throughout the brain tissue.
Figure 2. Safety profile of gene vectors.

(A) Rabbit primary astrocytes, (B) rat primary astrocytes and (C) 9L rat gliosarcoma cells were treated with varying concentrations of cationic polymer-based gene vectors. Cell viability was measured after 24 h of treatment and compared to untreated controls. Data represented as mean ± SEM. *Denotes statistically significant difference from 100% viability (p < 0.05). (D) Histopathological analysis of gene vector safety profile following CED administration. Normal saline was used as a control. Inflammation and hemorrhage were scored by a board certified neuropathologist using a custom scale (0: no inflammation/hemorrhage, 1: mild, 2: moderate, 3: severe).
We then characterized the cellular uptake and transfection efficiencies of gene vectors in 9L gliosarcoma cells and primary astrocytes in vitro. In good agreement with previous reports,[12] we found that conventional PEGylation (i.e. DNA-CPN) did not affect cellular uptake by PEI-based gene vectors; the small particle size we used may contribute to effective uptake of PEGylated gene vectors.[38–39] DNA-BPN, despite incorporation of more PEG compared to DNA-CPN, also demonstrated no difference in cell uptake compared to DNA-UPN and DNA-CPN. All three PEI-based gene vectors were detected in 50% of 9L gliosarcoma cells (Figure 3A) and 35% of rodent primary cells (Figure 3B). The uptake of the PEI-based gene vectors was ~17 and ~35 fold higher than clinically tested PEG-PLL gene vectors in 9L gliosarcoma cells and primary astrocytes, respectively (p < 0.05). The increase in cell uptake translated to significantly higher luciferase expression by PEI-based gene vectors in treated cells in comparison to cells treated with PEG-PLL at the same plasmid dose. Despite the similar cellular uptake among different PEI-based gene vectors, we found significantly lower in vitro transgene expression by both DNA-CPN and DNA-BPN compared to DNA-UPN (Figs. 3C and 3D), in agreement with previous observations.[12]
Figure 3. Cellular uptake and in vitro transfection.

Flow cytometric analysis of in vitro gene vector cell uptake in (A) 9L gliosarcoma cells and (B) primary astrocytes following treatment with fluorescently tagged gene vectors. In vitro transfection of luciferase gene to (C) 9L gliosarcoma cells and (D) primary astrocytes by cationic polymer-based gene vectors. Data represented as mean ± SEM. *Denotes statistical significant difference (p < 0.05) between PEI-based gene vectors and #denotes statistically significant difference from free plasmid control (p <0.05).
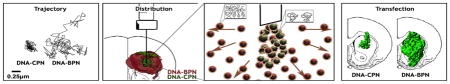
We next used multiple particle tracking (MPT) to assess the ability of DNA-BPN, DNA-CPN and DNA-UPN to avoid adhesive trapping in the brain parenchyma (via measurement of the rates of diffusion). We have previously demonstrated, using model NP, that diffusion rates measured by MPT in ex vivo brain tissue can be used to predict whether NP will penetrate within the brain parenchyma in vivo.[20] As expected, due to their positive surface charge, DNA-UPN were largely immobilized by the brain ECM, as shown by their constrained, non-Brownian trajectories (Figure 4A). Similarly, the average DNA-CPN exhibited hindered motion, though not completely immobilized (Figure 4A). In contrast, the trajectory of a typical DNA-BPN spanned much greater distances, indicating relatively unhindered diffusion in brain tissue (Figure 4A). At a timescale of 1 s, the ensemble-averaged mean squared displacement (MSD) of DNA-BPN was 5- and 29-fold higher than that of DNA-CPN and DNA-UPN, respectively (Figure 4B). The diffusion rates of DNA-UPN and DNA-CPN in brain tissue were 6,900- and 930-fold lower than their theoretical diffusion rates in aCSF, respectively, while DNA-BPN diffused only 260-fold slower in brain than in aCSF (Table 1). When examining histograms displaying the range of logarithmic MSD values (log10MSD) for individual gene vectors, we found that the transport behavior was largely unimodal for DNA-UPN and DNA-BPN; the majority of DNA-UPN displayed low MSD values, whereas most DNA-BPN exhibited increased MSD values indicative of diffusion in brain tissue. DNA-CPN were largely immobilized in brain tissue, but a minor population was able to diffuse in the brain parenchyma (Figure 4C). To test whether the enhanced ability of DNA-BPN to avoid adhesive trapping (as measured by ex vivo diffusion rates) in brain tissue would translate to improved distribution of these gene vectors in the brain parenchyma in vivo, we performed a bolus co-injection of fluorescently labeled DNA-CPN and DNA-BPN in the rodent striatum. As shown in Figure 4D, DNA-CPN largely remained localized to the injection site, whereas DNA-BPN spread approximately 300 μm from the injection site only 2 h after administration.
Figure 4. Penetration of gene vectors through rodent brain tissue.

(A) Representative particle trajectories over 20 s in ex vivo rodent brain tissue. Trajectories shown are of particles that had an MSD equal to the ensemble average at a time scale of 1 s. Scale bar = 0.25 μm (B) Ensemble-averaged geometric mean of MSD of PEI-based gene vectors as a function of time. Data represent the ensemble average of at least three independent experiments, with n ≥ 500 particles tracked for each experiment. (C) Histograms of individual MSD of respective gene vectors from at least three independent experiments at a timescale of τ = 1 s. (D) In vivo spread of Cy5- labeled DNA-CPN (Green) and Cy3-labeled DNA-BPN (Red) following bolus co-injection in the striatum. Scale bar = 100 μm. Co-localization of DNA-BPN and DNA-CPN in each image is represented as yellow. White arrow demonstrates point of injection.
We next aimed to determine the effect of vector surface characteristics on distribution in the brain striatum following CED. To directly compare the spatial distribution of the gene vectors, we co-infused Cy5-labeled DNA-BPN and Cy3-labeled DNA-CPN. We quantified the NP distribution within the striatum only in order to exclude any DNA NP found in the white matter tracts from our analysis. DNA-BPN distributed relatively uniformly throughout the rodent striatum, whereas DNA-CPN were confined in the injection site (Figure 5A, B). Within the coronal plane of injection, DNA-BPN covered a 3-fold larger tissue area than DNA-CPN (Figure 5C, p < 0.05). Moreover, the overall volume of distribution in the striatum achieved with DNA-BPN was found to be 3.1-fold higher than the volume of distribution achieved with DNA-CPN (Figure 5D). The concentration of gene vectors in the CED infusate has been shown to have a significant effect on the volume of distribution.[22] While, we confirmed that co-infusing gene vectors at half the concentration resulted in lower volumes of distribution, DNA-BPN still provided 4.6-fold higher volume of distribution, compared to DNA-CPN (Figure S3).
Figure 5. In vivo distribution of PEI-based gene vectors following CED.

(A) Representative distribution of labeled Cy3 DNA-CPN (green) and Cy5 DNA-BPN (red) in rat striatum using confocal microscopy; DAPI staining for cell nuclei (blue). Colocalization of DNA-BPN and DNA-CPN in each image represented as yellow. Scale bar = 1 mm. (B) Representative 3D reconstruction of labeled Cy3 DNA-CPN (green) and Cy5 DNA-BPN (red) distribution in the rat striatum following CED. (C) Image-based MATLAB quantification of area of distribution of PEI-based NP as a function of distance from the injection site (n = 6). (D) Summated image-based MATLAB quantification of volume of distribution for DNA-BPN and DNA-CPN (n = 6). *Denotes statistical significant difference (p < 0.05).
We then sought to determine whether increased tissue distribution would also lead to an increase in the volume of tissue transfected following CED administration of gene vectors carrying plasmid DNA encoding eGFP. DNA-UPN and DNA-CPN treated animals demonstrated significant eGFP expression surrounding the infusion site (Figure 6A–D). In contrast, DNA-BPN provided widespread transfection throughout the rat striatum (Figure 6E–F), which correlated well with the gene vector distribution analysis (Figure 5A, B). In particular, DNA-BPN resulted in a statistically significant (p > 0.05) increase in the eGFP transgene expression with a 2.4- and 3.2-fold higher volume of tissue transfection compared to DNA-CPN and DNA-UPN, respectively (Figure 6G). We also quantitatively determined total transgene eGFP expression mediated by CED of DNA-UPN, DNA-CPN and DNA-BPN, using western blot analysis. DNA-BPN demonstrated a statistically significant, 2-fold higher overall transgene expression in the striatum in comparison to DNA-CPN and DNA-UPN (Figure 6H).
Figure 6. In vivo distribution and overall level of eGFP transgene expression following CED of various PEI-based gene vectors carrying eGFP plasmid DNA.

(A–C) Representative stacked and aligned confocal images of eGFP expression (Green) following administration of the respective PEI-based gene vectors in the rodent caudate putamen. Scale bar = 1 mm. (D–F) Isosurface 3D reconstruction of distribution of in vivo eGFP expression using multiple sequential confocal fluorescence images of respective PEI-based gene vectors. (G) Image-based MATLAB quantification of volume of distribution of eGFP expression (n = 4–6). (H) Transgene expression following NP CED administration in rodent striatum. eGFP expression was analyzed using Western blot. The band quantification was performed using Multi Gauge software (Fujifilm). The expression level of eGFP was normalized with β-actin. Data represents the mean ± SEM. *Denotes statistically significant difference (p < 0.05).
2. Discussion
In order to achieve efficacious gene therapy for diffuse and debilitating CNS disorders, including neurodegenerative diseases and malignant tumors, transgene expression must occur throughout the broadly disseminated diseased area at therapeutically relevant levels.[23,40–41] Regardless of delivery method, the limited spatial distribution of non-viral gene vectors in the brain remains a key challenge to achieving clinically-relevant therapeutic results.[40,42] In this study, we found that endowing a high PEG content to DNA NP, achieved by using blends of PEG-PEI and PEI, is critical to DNA NP size, stability, and safety, and also allows for improved distribution and transfection within the rodent brain. We demonstrated that the DNA-BPN gene vector platform is relatively non-adhesive to the brain parenchyma, leading to improved distribution in the brain. When combined with CED, DNA-BPN achieved widespread transgene expression in the brain parenchyma. Importantly, this was achieved with no signs of vector-induced toxicity. This strategy provides a tailorable polymer-based platform that may significantly improve the efficacy of non-viral gene therapy in CNS diseases.
NP diffusion in the brain predominantly takes place through the narrow, tortuous space between cells and blood vessels.[21] The extracellular matrix (ECM), which is the main component of the extracellular space, imposes an adhesive and steric barrier to the movement of NP through the brain parenchyma. Non-specific electrostatic interactions with the abundant negative charges of the ECM hinder the diffusion of poorly-shielded cationic polymer-based gene vectors,[24] as shown with DNA-UPN (no PEG) and DNA-CPN (less PEG) in this study. Hence, improved brain penetration of DNA-BPN can be attributed to the efficient shielding of the positive surface charge intrinsic to the cationic polymer-based gene vectors. Moreover, the PEG coating achieved by blending highly PEGylated polymer with unmodified polymer allows DNA-BPN to retain their compact sub-100 nm size in physiological conditions (i.e. CSF) required to move through the pores in the ECM without being strongly hindered by steric obstruction. In comparison, the loose compaction, lack of stability and the tendency towards aggregation of conventionally PEGylated cationic particles, including DNA-CPN, does not allow for efficient penetration through the large proportion of ECM pores that are smaller than 200 nm in diameter.[20,22] These results suggest the potential value of designing gene vectors capable of overcoming both the adhesive interactions and steric hindrance imposed by the brain ECM.
CED has been applied to further enhance the distribution of locally administered therapeutics. However, CED of non-PEGylated liposomal non-viral gene vectors for the treatment of unresectable or recurrent glioblastoma has demonstrated limited success in a phase I/II clinical trial. Voges et al. underlined the fact that, even following CED, the heterogeneous ECM can act as a barrier, hence limiting the spatial distribution of gene vectors.[23,43] Namely, the physicochemical characteristics of gene vectors leading to adhesive and/or steric interactions with the brain parenchyma significantly impact their flow through brain tissue.[22,26] Previous studies have reported that cationic charge, even if shielded, greatly restricts the convection of NP away from the point of administration.[22,40] Here, we observed that the ability to avoid adhesive trapping (measured by rate of diffusion) of DNA-BPN in the brain parenchyma translates to enhanced distribution of gene vectors in vivo and, therefore, widespread transgene expression throughout the brain when administered by CED. It should be noted that a high amount of PEG incorporation is required to achieve improved CED-facilitated distribution of gene vectors; the insufficiently shielded DNA-CPN were unable to escape the injection site and failed to mediate enhanced distribution of transgene expression compared to unshielded DNA-UPN following CED.
A broad range of volumes of distribution following the direct infusion of NP into the brain has been reported.[22,25,44–47] The differences can be attributed to variations in experimental conditions and settings, as well as methods of analysis, that can significantly impact the final outcomes. These include, but are not limited to, catheter design and configuration,[48] anatomic location of infusion,[49] infusion parameters, such as type of infusate solutions,[50] infusion volume and rate,[51] particle/solute concentrations[22], whether particle distribution measurements are made in grey matter, white matter or both, and methods of data acquisition/analysis.[52] For example, following infusion into the grey matter, escape of nano vectors into highly permeable white matter tracts leads to significantly higher distribution [25,27] to locations that may or may not be intended.[26,53] Zhou et al. demonstrated a broad distribution (80 – 110 mm3) of NP following CED that included NP distribution in both grey (i.e. striatum) and white matter tracts.[44] However, studies investigating distribution solely within the rat striatum report significantly lower volumes of distribution within the target anatomic location.[22,27,50,54–55] To address the numerous aforementioned experimental variations, we controlled for all variables and directly compared the distribution and transgene expression of DNA-BPN to two conventionally used counterparts within the striatum only.
PEGylation as a stealth coating strategy has previously been shown to decrease cell uptake, endosome escape and subsequent transgene expression.[56] However, we found that PEGylation of cationic polymer-based gene vectors did not decrease entry in primary astrocytes or 9L cells, likely due to the small particle size we used, as suggested in previous reports,[38–39] but led to significantly lower transfection efficacy in vitro.[12,57] The increased stability of DNA-BPN may decrease in vitro transfection efficiency by hindering DNA unpackaging, and the conjugation of PEG to primary amines may reduce the buffering capacity and subsequent endosome escape by the PEI-based vectors.[12,58] Regardless, CED administration of DNA-BPN resulted in double the total amount of in vivo transgene expression in comparison to DNA-UPN and DNA-CPN. This suggests that the broader dispersion of DNA-BPN more than offsets the inferior intracellular delivery capacity often observed with PEG-coated gene vectors.
Finally, although cationic polymer-based gene vectors have been safely tested in clinical trials,[44] cytotoxicity remains a concern.[28,31] In agreement with previous observations,[28,59–60] conventional PEGylation (i.e. DNA-CPN) was not sufficient to significantly improve the in vitro safety profile of cationic polymer-based gene vectors. However, we demonstrated that effective shielding of the positive surface charge by incorporating highly PEGylated polymers, significantly decreased the toxicity of PEI-based gene vectors. DNA-BPN was associated with a favorable safety profile, similar to the widely used PEG-PLL NP system shown to be safe in animal brain[35–36] and lung,[61–62] as well as the human airways.[37] The reduced toxicity of DNA-BPN in vivo, in combination with the widespread distribution in the brain when administered by CED, improves on limitations of conventional cationic polymer-based gene vectors.
3. Conclusion
Non-viral gene vectors have potential for the treatment of CNS diseases. However, achieving high spatial distribution of therapeutically relevant transgene expression remains a challenge. We described a strategy for designing cationic polymer-based gene vectors that are capable of penetrating deeply within the brain parenchyma, leading to enhanced distribution and transfection throughout the striatum following CED. This strategy has the potential to be adapted to a variety of cationic polymers with different attributes that may further enhance gene transfer to the brain. These results offer new avenues to explore gene delivery for diffuse neurological conditions.
4. Experimental Section
Polymer preparation
Methoxy PEG N-hydroxysuccinimide (mPEG-NHS, 5 kDa, Sigma-Aldrich, St. Louis, MO) was conjugated to 25 kDa branched polyethyleneimine (PEI) (Sigma-Aldrich, St. Louis, MO) to yield a PEG5k-PEI copolymer as previously described.[29] Briefly, PEI was dissolved in ultrapure distilled water, the pH was adjusted to 7.5 – 8.0 and mPEG-NHS was added to the PEI solution at various molar ratios and allowed to react overnight in 4°C. The polymer solution was extensively dialyzed (20,000 MWCO, Spectrum Laboratories, Inc., Rancho Dominguez, CA) against ultrapure distilled water and lyophilized. Nuclear magnetic resonance (NMR) was used to confirm PEG: PEI ratios of 8, 26, 37 and 50 (Figure S1). 1H NMR (500 MHz, D2O): δ 2.48 – 3.20 (br, CH2CH2NH), 3.62 – 3.72 (br, CH2CH2O). The poly-L-lysine 30-mer (PLL) and PEG5K-PLL block copolymers were synthesized and characterized as previously published.[29] The lyophilized polymers were dissolved in ultrapure distilled water and pH was adjusted to ~6.5 – 7.
Gene vector complexation
The pd1GL3-RL plasmid DNA was a kind gift from Professor Alexander M. Klibanov (M.I.T) and pEGFP plasmid was purchased by Clontech Laboratories Inc. (Mountainview, CA). The plasmid DNA was propagated and purified as previously described.[29] Mirus Label IT® Tracker™ Intracellular Nucleic Acid Localization Kit (Mirus Bio, Madison, WI) was used to fluorescently tag plasmid DNA with a Cy3 or Cy5 fluorophore. Gene vectors were formed by the drop-wise addition of 10 volumes of labeled or non-labeled plasmid DNA (0.2 mg/ml) to 1 volume of a swirling polymer solution. PEI solutions were prepared at previously optimized nitrogen to phosphate (N/P) ratio of 6 and at PEG5k-PEI to PEI molar ratio of 3. For the formulation of free PEI (DNA-UPN) and (PEG5k)8-PEI (DNA-CPN) based gene vector controls, the PEI solutions were prepared at N/P ratio of 6 using 100% of free PEI or (PEG5k)8-PEI, respectively. For fluorescence imaging, Cy3- or Cy5-labeled DNA was used to assemble fluorescently labeled gene vectors. The plasmid/polymer solutions were incubated for 30 min at room temperature to form gene vectors. Gene vectors were washed twice with 3 volumes of ultrapure distilled water, and re-concentrated to 1 mg/ml using Amicon® Ultra Centrifugal Filters (100,000 MWCO, Millipore Corp., Billerica, MA) to remove free polymers. DNA concentration was determined via absorbance at 260 nm using a NanoDrop ND-1000 spectrophotometer (NanoDrop Technologies, Wilmington, DE). PEG-PLL gene vectors were similarly prepared at an N/P ratio of 2 as previously described.[29]
Physicochemical characterization of gene vectors
Hydrodynamic diameter, ζ-potential and polydispersity index (PDI) were measured in 10 mM NaCl at pH 7.0 by dynamic light scattering and laser Doppler anemometry, respectively, using a Nanosizer ZS90 (Malvern Instruments, Southborough, MA). Gene vectors were imaged using transmission electron microscopy (TEM, Hitachi H7600, Japan) to determine their morphology and dimensions. PEI gene vector stability was assessed by incubating gene vectors in artificial cerebrospinal fluid (aCSF; Harvard Apparatus, Holliston, MA) at 37 °C and conducting dynamic light scattering every 30 min for 24 h. At 1 h of incubation, a fraction of the NP solution was used for TEM.
Cell culture
9L gliosarcoma cells were provided by Dr. Henry Brem. 9L gliosarcoma cells were cultured in Dulbecco’s modified Eagle’s medium (DMEM, Invitrogen Corp., Carlsbad, CA) supplemented with 1% penicillin/streptomycin (pen/strep, Invitrogen Corp., Carlsbad, CA) and 10% heat inactivated fetal bovine serum (FBS, Invitrogen Corp., Carlsbad, CA). Rabbit primary astrocytes were provided by Dr. Sujatha Kannan. Mixed cell culture was prepared from day 1 neonatal rabbits, and astrocytes were isolated using the conventional shake off method as previously published.[63] Astrocytes were cultured in DMEM supplemented with 1% pen/strep and 10% FBS and passaged once before use. Rat brain primary astrocytes were provided by Dr. Arun Venkatesan. Rat brain primary mixed cultures were isolated form neonatal P3-P6 rats, and astrocytes were isolated with the conventional shake off method. Cells were cultured in DMEM/F12 (Invitrogen Corp., Carlsbad, CA) supplemented with 10% FBS and 1% pen/strep and used at the first passage. Cells at 70–80 % confluency were immediately reseeded in 96-well plates to assess gene vector toxicity and in 24-well plates to evaluate cellular uptake and transfection efficacy of gene vectors.
In vitro toxicity
To thoroughly assess the safety profile of DNA NP we used 3 different cell lines, including rabbit and rat primary astrocytes and 9L rat gliosarcoma cellsCells were seeded onto 96-well plates at an initial density of 1.0 × 10⁴ cells/well and incubated at 37 °C. After 24 h, cells were incubated with a wide range of doses of DNA gene vectors in media for 24 h at 37 °C. Cell viability was assessed using the Dojindo cell counting kit-8 (Dojindo Molecular Technologies, Inc., Rockville, MD). Absorbance at 450 nm was measured spectrophotometrically using the Synergy Mx MultiMode Microplate Reader (Biotek, Instruments Inc. Winooski, VT).
In vitro transfection
Cells were seeded onto 24-well plates at an initial density of 5.0 × 10⁴ cells/well. After 24 h, cells were incubated with various PEI-based gene vectors carrying pd1GL3-RL plasmid (1 μg of DNA/well) in media for 5 h at 37 °C. Transfection efficiency of gene vectors was compared to that of free plasmid control. Subsequently, gene vectors and culture media were replaced with fresh media. After additional 48 h of incubation at 37 °C, the media was removed and 0.5 ml of 1X Reporter Lysis Buffer was added. Cells were subjected to three freeze-and-thaw cycles to assure complete cell lysis, and supernatants were obtained by centrifugation. Luciferase activity in the supernatant was then measured using a standard luciferase assay kit (Promega, Madison, WI) and a 20/20n luminometer (Turner Biosystems, Sunnyvale, CA). The relative light unit (RLU) was normalized to the total protein concentration of each well measured by Bio-Rad protein assay (Life Science, Hercules, CA).
Cellular uptake/flow cytometry
Cells were seeded onto 24-well plates at an initial density of 5.0 × 10⁴ cells/well. After 24 h, cells were incubated with various PEI-based gene vectors carrying Cy3-labeled plasmid (1 μg DNA/well) in media. After 5 h of incubation, the media was removed and cells were thoroughly washed 3 times with 1x PBS and incubated with 1 volume of 0.25 % Trypsin with EDTA for 5 min at 37 °C. Three volumes of DMEM medium with 10% FBS were added to neutralize trypsin. The cellular uptake of gene vectors was measured using the Accuri C6 flow cytometer (BD Biosciences, USA) with an FL2 ban-pass filter with emission detection wavelength of 585/40 nm. Data were analyzed using the BD Accuri C6 software. Thresholds were determined using untreated samples and cellular uptake of gene vectors was compared to that of free plasmid.
Multiple particle tracking in rodent brain slices
Multiple particle tracking (MPT) was used to estimate the MSD of fluorescent gene vectors in ex vivo rodent brain slices as previously described.[20] Briefly, brains were harvested from adult Fischer rats and incubated in aCSF for 10 min on ice. The brains were sliced into 1.5 mm coronal slices using a Zivic brain matrix slicer (Zivic Instruments, Pittsburgh, PA) and placed on custom made slides. Half a microliter of fluorescently labeled gene vectors was injected on the cerebral cortex at a depth of 1 mm using a 50 μl Hamilton Neuro Syringe (Hamilton, Reno, NV) mounted on a stereotaxic frame. Tissues were covered by a 22 mm x 22 mm coverslip to minimize tissue movement and bulk flow. Particle trajectories were recorded over 20 s at an exposure time of 66.7 ms by an Evolve 512 EMCCD camera (Photometrics, Tucson, AZ) mounted on an inverted epifluorescence microscope (Axio Observer D1, Zeiss; Thornwood, NY) equipped with a 100x/1.46 NA oil-immersion objective. Movies were analyzed with a custom made MATLAB code to extract x, y-coordinates of gene vector centroids over time and calculate the MSD of each particle as a function of time.[20,64] The spatial resolution to the noise/signal ratio correlation was estimated using immobilized gene vectors on a glass slide.[65] We estimated the average resolution of our MPT experiments to be ~0.009 μm2 at 1 s. At least three rat brains were used per gene vector type, and at least 500 gene vectors were tracked per brain sample. The ensemble-averaged MSD (<MSD>) for all gene vectors in a sample was calculated and then averaged over different samples as a function of time. Histograms were generated from the MSD data for each individual vector at a time scale of 1 s. The theoretical MSD of gene vectors in aCSF was calculated using the Stokes-Einstein equation and the mean particle diameter calculated through dynamic light scattering.
Animal studies
Female Fischer 344 rats, weighing 120–140 g each, were purchased from Harlan Laboratories (Frederick, MD). The use of inbred rats was preferred to other outbred strains due to the impact of genetic differences in gene expression.[66] Rats were housed in standard facilities and given free access to food and water. All animals were treated in accordance with the policies and guidelines of the Johns Hopkins University Animal Care and Use Committee. All surgical procedures were performed using standard, sterile surgical techniques.
Rats were anesthetized with a mixture of ketamine-xylazine at 75 mg/kg and 7.5mg/kg, respectively, as previously described.[67] A midline scalp incision was made to expose the coronal and sagittal sutures and a burr whole was drilled 3 mm lateral to the sagittal suture and 0.5 mm posterior to the bregma. Following the administration of gene vector solution, the skin was closed using biodegradable sutures (Polysorb™ Braided Absorbable Sutures 5-0) and Bacitracin was applied.
To study the diffusion based spread of NP in vivo, three animals were used for each vector; a 33 gauge 10 μl Hamilton Neuro Syringe mounted to a stereotaxic headframe was lowered to a depth of 3.5 mm and retracted 1 mm to create a pocket in the rodent striatum in order to minimize the convective flow during the infusion. A 10 μl solution of Cy5-labeled conventionally PEGylated NP and Cy3-labeled brain penetrating NP at a plasmid concentration of 500 μg/ml for each particle type was administered as a bolus injection at the infusion rate of 2 μl/min. Animals were sacrificed 2 h following the injection.
To study the distribution of PEI-based gene vectors following CED in the rodent striatum, six rats for each vector type were used. A 33 gauge 50 μl Hamilton Neuro Syringe mounted to a stereotaxic headframe was lowered to a depth of 3.5 mm. A 20 μl solution of Cy3-labeled DNA-CPN and Cy5-labeled DNA-BPN at a plasmid concentration of 500 μg/ml for each particle type in normal saline was administered. The rate of infusion was set at 0.33 μl/min, using a Chemyx Inc. Nanojet Stereotaxic syringe pump (Chemyx, Stafford, TX). Animals were sacrificed 5 h following the injection in order to assure the cessation of pressure-driven flow and to allow assessment of neurologic deficits or other adverse effects that may result from the CED. Importantly, no such effects were observed during our studies. To examine the concentration-dependence of particle distribution, we also performed co-injections at half the plasmid concentration, 250 μg/ml for each particle type, in normal saline.
To assess the distribution of transgene expression following CED administration of gene vectors, at least four rats for each particle type were used; plasmid encoding fluorescent eGFP reporter protein with a cytomegalovirus (CMV) promoter was complexed into the various PEI-based gene vector formulations and infused in a 20 μl solution of 1 mg/ml plasmid solution using the same parameters described above. Animals were sacrificed 48 h following CED administration, and harvested brains were fixed in 4% formaldehyde.
For western blot analysis of in vivo transfection following CED of gene vectors, three rats for each particle type were used and the same experimental procedures followed for imaging-based analysis of distribution of transfection were used. Animals were sacrificed 48 h following CED administration and immediately placed on ice and a 4 mm thick coronal slice of the striatum from −2 mm to 2 mm from the injection site was dissected and stored in −80°C for western blot analysis.
To evaluate the safety profile of the gene vectors in vivo following CED administration, three rats for each group were used. Various PEI-based gene vector formulations were infused in a 20 μl solution at a 1 mg/ml plasmid concentration as described above. A normal saline solution was infused as a negative control. Animals were sacrificed 4 d following administration and the harvested brains were fixed in 4% formaldehyde, processed, sectioned and stained with hematoxylin and eosin. Blind histopathological analysis was performed by a board certified neuropathologist and tissues were scored from 0–3 for indications of inflammation and hemorrhage (0: no inflammation/hemorrhage, 1: mild, 2: moderate, 3: severe).
Imaging and Analysis
Freshly harvested brains were fixed in 4% formaldehyde overnight followed by a gradient sucrose solutions before cryosection. Tissues were sectioned coronally into 100 μm thick slices using Leica CM 1905 cryostat. Slices were stained with DAPI (Molecular Probes, Eugene, OR) to visualize cell nuclei, and imaged for the fluorescence originated from DAPI, Cy3 and Cy5 or Alexa Fluor 488 (eGFP) using confocal LSM 710 microscope (Carl Zeiss; Hertfordshire, UK) under 5x and 10x magnification. Settings were carefully optimized to avoid background fluorescence based on non-injected control rat brains. Laser power, pinhole, gain, offset and digital gain were selected separately for each magnification and kept constant throughout the study.
The volume of gene vector distribution following CED administration was quantified using a custom MATLAB script that subtracted the background fluorescence and thresholded the fluorescent intensities at 10% of the maximum intensity. NP fluorescence in the white matter tracts due to backflow was excluded from quantification. Every 100 μm slice within 2 mm of the injection plane was imaged. The area of distribution on each slice was summated to calculate the total volume of gene vector distribution. The identical process was utilized for the analysis of the distribution of transgene expression mediated by various PEI-based gene vectors carrying eGFP plasmid. To reconstruct three dimensional images of NP distribution and distribution of transfection within the rodent striatum, we stacked and aligned the previously acquired images using Metamorph ® Microscopy Automation & Image Analysis Software (Molecular Devices, CA). We used Imaris ® Software (Bitplane, CT) to create 3D isosurfaces of the reconstructed images.
Antibodies and western blotting
For western blot analysis of in vivo transfection efficacy following the CED administration of gene vectors, the antibodies, anti-GFP (B-2): sc-9996 and anti-β-actin:sc-47778 (Santa Cruz Biotechnology, Santa Cruz, CA), were used for the detection of transgene expression (eGFP) and housekeeping protein (actin), respectively. Brain tissues were lysed using brief sonication in ice PBS buffer (1 mM PMSF, and 1 μg/ml each of aprotinin, leupeptin, and pepstatin A). Sampling buffer (10% glycerol, 2% SDS, 62.5 mM Tris–HCl, 2% β-mercaptoethanol, pH 6.8) was added and samples were boiled at 100°C for 10 min. Samples were resolved by SDS–polyacrylamide gel electrophoresis (PAGE) and proteins on the gels were transferred to nitrocellulose (Bio-Rad, Hercules, CA) using a semidry blotter (Bio-Rad, Hercules, CA). The membrane was blocked with 3% BSA in TBST (10 mM Tris-Cl, pH 8.0, 150 mM NaCl, 0.5% Tween-20) and incubated overnight at 4 °C with primary antibodies. Immunoblots were visualized by enhanced chemiluminescence method. Quantification of western blot results was performed using the Multi Gauge program (Fujifilm, Tokyo, Japan).
Statistical analysis
Statistically significant differences between two groups were analyzed with a two-tailed Student’s t test assuming unequal variances or paired student’s t test when allowed. Multiple comparisons were performed using one-way analysis of variance (ANOVA), followed by post hoc test using SPSS 18.0 software (SPS S Inc., Chicago, IL).
Supplementary Material
Acknowledgments
Partial funding was provided by the National Institutes of Health (R01CA164789). The content is solely the responsibility of the authors and does not necessarily represent the official views of the National Institutes of Health. We are grateful to Dr. S. Kannan and Dr. A. Venkatesan for providing primary cell lines. We also thank Benjamin Schuster for his help in high-throughput MPT analysis, as well as Laura Ensign and Eric Song for insightful discussion.
Contributor Information
Dr. Panagiotis Mastorakos, Center for Nanomedicine, at the Wilmer Eye Institute, Johns Hopkins University School of Medicine, 400 N Broadway, Baltimore, MD 21231 (USA). Department of Ophthalmology, The Wilmer Eye Institute, Johns Hopkins University School of Medicine, 600 N Wolfe Street, Baltimore, MD 21297, USA
Clark Zhang, Center for Nanomedicine, at the Wilmer Eye Institute, Johns Hopkins University School of Medicine, 400 N Broadway, Baltimore, MD 21231 (USA). Department of Biomedical Engineering, Johns Hopkins University School of Medicine, 720 Rutland Av., Baltimore, MD 21205, USA.
Sneha Berry, Center for Nanomedicine, at the Wilmer Eye Institute, Johns Hopkins University School of Medicine, 400 N Broadway, Baltimore, MD 21231 (USA). Center for Biotechnology Education, Krieger School of Arts and Sciences, Johns Hopkins University, 3400 N. Charles Street, Baltimore, MD 21218, USA.
Dr. Yumin Oh, Center for Nanomedicine, at the Wilmer Eye Institute, Johns Hopkins University School of Medicine, 400 N Broadway, Baltimore, MD 21231 (USA). Russell H. Morgan Department of Radiology and Radiological Science, Johns Hopkins University, 601 N Caroline St, Baltimore, MD 21287, USA
Prof. Dr. Seulki Lee, Center for Nanomedicine, at the Wilmer Eye Institute, Johns Hopkins University School of Medicine, 400 N Broadway, Baltimore, MD 21231 (USA). Russell H. Morgan Department of Radiology and Radiological Science, Johns Hopkins University, 601 N Caroline St, Baltimore, MD 21287, USA
Prof. Charles G. Eberhart, Department of Pathology, Johns Hopkins University School of Medicine, 600 N. Wolfe Street, Baltimore, MD 21287, USA
Prof. Graeme F. Woodworth, Departments of Neurological Surgery, Anatomy and Neurobiology, University of Maryland School of Medicine, 22 S. Greene Street, Baltimore, MD 21201, USA
Dr. Jung Soo Suk, Email: jsuk@jhmi.edu, Center for Nanomedicine, at the Wilmer Eye Institute, Johns Hopkins University School of Medicine, 400 N Broadway, Baltimore, MD 21231 (USA). Department of Ophthalmology, The Wilmer Eye Institute, Johns Hopkins University School of Medicine, 600 N Wolfe Street, Baltimore, MD 21297, USA
Prof. Justin Hanes, Email: hanes@jhmi.edu, Center for Nanomedicine, at the Wilmer Eye Institute, Johns Hopkins University School of Medicine, 400 N Broadway, Baltimore, MD 21231 (USA). Department of Ophthalmology, The Wilmer Eye Institute, Johns Hopkins University School of Medicine, 600 N Wolfe Street, Baltimore, MD 21297, USA. Department of Biomedical Engineering, Johns Hopkins University School of Medicine, 720 Rutland Av., Baltimore, MD 21205, USA. Department of Chemical and Biomolecular Engineering, Johns Hopkins University, 3400 N Charles Street, Baltimore, MD 21218, USA
References
- 1.O’Mahony AM, Godinho BM, Cryan JF, O’Driscoll CM. J Pharm Sci. 2013;102:3469. doi: 10.1002/jps.23672. [DOI] [PubMed] [Google Scholar]
- 2.Lentz TB, Gray SJ, Samulski RJ. Neurobiol Dis. 2012;48:179. doi: 10.1016/j.nbd.2011.09.014. [DOI] [PMC free article] [PubMed] [Google Scholar]
- 3.Perez-Martinez FC, Carrion B, Cena V. J Alzheimers Dis. 2012;31:697. doi: 10.3233/JAD-2012-120661. [DOI] [PubMed] [Google Scholar]
- 4.Thomas CE, Ehrhardt A, Kay MA. Nat Rev Genet. 2003;4:346. doi: 10.1038/nrg1066. [DOI] [PubMed] [Google Scholar]
- 5.Olsen NJ, Stein CM. N Engl J Med. 2004;350:2167. doi: 10.1056/NEJMra032906. [DOI] [PubMed] [Google Scholar]
- 6.Lowenstein PR, Kroeger K, Castro MG. Neurotherapeutics. 2007;4:715. doi: 10.1016/j.nurt.2007.07.010. [DOI] [PMC free article] [PubMed] [Google Scholar]
- 7.Sun X, Zhang N. Mini Rev Med Chem. 2010;10:108. doi: 10.2174/138955710791185109. [DOI] [PubMed] [Google Scholar]
- 8.Kukowska-Latallo JF, Raczka E, Quintana A, Chen C, Rymaszewski M, Baker JR., Jr Hum Gene Ther. 2000;11:1385. doi: 10.1089/10430340050057468. [DOI] [PubMed] [Google Scholar]
- 9.Sonawane ND, Szoka FC, Jr, Verkman AS. J Biol Chem. 2003;278:44826. doi: 10.1074/jbc.M308643200. [DOI] [PubMed] [Google Scholar]
- 10.Tamaru M, Akita H, Kajimoto K, Sato Y, Hatakeyama H, Harashima H. Int J Pharm. 2014;465:77. doi: 10.1016/j.ijpharm.2014.02.016. [DOI] [PubMed] [Google Scholar]
- 11.Langiu M, Dadparvar M, Kreuter J, Ruonala MO. PLoS One. 2014;9:e107603. doi: 10.1371/journal.pone.0107603. [DOI] [PMC free article] [PubMed] [Google Scholar]
- 12.Mishra S, Webster P, Davis ME. Eur J Cell Biol. 2004;83:97. doi: 10.1078/0171-9335-00363. [DOI] [PubMed] [Google Scholar]
- 13.Zhang Y, Satterlee A, Huang L. Mol Ther. 2012;20:1298. doi: 10.1038/mt.2012.79. [DOI] [PMC free article] [PubMed] [Google Scholar]
- 14.DeLoid G, Cohen JM, Darrah T, Derk R, Rojanasakul L, Pyrgiotakis G, Wohlleben W, Demokritou P. Nat Commun. 2014;5:3514. doi: 10.1038/ncomms4514. [DOI] [PMC free article] [PubMed] [Google Scholar]
- 15.Burke RS, Pun SH. Bioconjug Chem. 2008;19:693. doi: 10.1021/bc700388u. [DOI] [PubMed] [Google Scholar]
- 16.Jain KK. Nanomedicine (Lond) 2012;7:1225. doi: 10.2217/nnm.12.86. [DOI] [PubMed] [Google Scholar]
- 17.Patel T, Zhou JB, Piepmeier JM, Saltzman WM. Advanced Drug Delivery Reviews. 2012;64:701. doi: 10.1016/j.addr.2011.12.006. [DOI] [PMC free article] [PubMed] [Google Scholar]
- 18.Vykhodtseva N, McDannold N, Hynynen K. Ultrasonics. 2008;48:279. doi: 10.1016/j.ultras.2008.04.004. [DOI] [PMC free article] [PubMed] [Google Scholar]
- 19.Kroll RA, Neuwelt EA. Neurosurgery. 1998;42:1083–99. doi: 10.1097/00006123-199805000-00082. discussion 1099. [DOI] [PubMed] [Google Scholar]
- 20.Nance EA, Woodworth GF, Sailor KA, Shih TY, Xu Q, Swaminathan G, Xiang D, Eberhart C, Hanes J. Sci Transl Med. 2012;4:149. doi: 10.1126/scitranslmed.3003594. [DOI] [PMC free article] [PubMed] [Google Scholar]
- 21.Sykova E, Nicholson C. Physiol Rev. 2008;88:1277. doi: 10.1152/physrev.00027.2007. [DOI] [PMC free article] [PubMed] [Google Scholar]
- 22.MacKay JA, Deen DF, Szoka FC., Jr Brain Res. 2005;1035:139. doi: 10.1016/j.brainres.2004.12.007. [DOI] [PubMed] [Google Scholar]
- 23.Voges J, Reszka R, Gossmann A, Dittmar C, Richter R, Garlip G, Kracht L, Coenen HH, Sturm V, Wienhard K, Heiss WD, Jacobs AH. Ann Neurol. 2003;54:479. doi: 10.1002/ana.10688. [DOI] [PubMed] [Google Scholar]
- 24.Zimmermann DR, Dours-Zimmermann MT. Histochem Cell Biol. 2008;130:635. doi: 10.1007/s00418-008-0485-9. [DOI] [PubMed] [Google Scholar]
- 25.Kenny GD, Bienemann AS, Tagalakis AD, Pugh JA, Welser K, Campbell F, Tabor AB, Hailes HC, Gill SS, Lythgoe MF, McLeod CW, White EA, Hart SL. Biomaterials. 2013;34:9190. doi: 10.1016/j.biomaterials.2013.07.081. [DOI] [PubMed] [Google Scholar]
- 26.Allard E, Passirani C, Benoit JP. Biomaterials. 2009;30:2302. doi: 10.1016/j.biomaterials.2009.01.003. [DOI] [PubMed] [Google Scholar]
- 27.Writer MJ, Kyrtatos PG, Bienemann AS, Pugh JA, Lowe AS, Villegas-Llerena C, Kenny GD, White EA, Gill SS, McLeod CW, Lythgoe MF, Hart SL. J Control Release. 2012;162:340. doi: 10.1016/j.jconrel.2012.07.002. [DOI] [PMC free article] [PubMed] [Google Scholar]
- 28.Petersen H, Fechner PM, Martin AL, Kunath K, Stolnik S, Roberts CJ, Fischer D, Davies MC, Kissel T. Bioconjug Chem. 2002;13:845. doi: 10.1021/bc025529v. [DOI] [PubMed] [Google Scholar]
- 29.Suk JS, Kim AJ, Trehan K, Schneider CS, Cebotaru L, Woodward OM, Boylan NJ, Boyle MP, Lai SK, Guggino WB, Hanes J. J Control Release. 2014;8 doi: 10.1016/j.jconrel.2014.01.007. [DOI] [PMC free article] [PubMed] [Google Scholar]
- 30.Malek A, Czubayko F, Aigner A. J Drug Target. 2008;16:124. doi: 10.1080/10611860701849058. [DOI] [PubMed] [Google Scholar]
- 31.Merkel OM, Urbanics R, Bedocs P, Rozsnyay Z, Rosivall L, Toth M, Kissel T, Szebeni J. Biomaterials. 2011;32:4936. doi: 10.1016/j.biomaterials.2011.03.035. [DOI] [PubMed] [Google Scholar]
- 32.Yang J, Hendricks W, Liu G, McCaffery JM, Kinzler KW, Huso DL, Vogelstein B, Zhou S. Proc Natl Acad Sci U S A. 2013;110:14717. doi: 10.1073/pnas.1313330110. [DOI] [PMC free article] [PubMed] [Google Scholar]
- 33.Malek A, Merkel O, Fink L, Czubayko F, Kissel T, Aigner A. Toxicol Appl Pharmacol. 2009;236:97. doi: 10.1016/j.taap.2009.01.014. [DOI] [PubMed] [Google Scholar]
- 34.Lutz GJ, Sirsi SR, Williams JH. Methods Mol Biol. 2008;433:141. doi: 10.1007/978-1-59745-237-3_9. [DOI] [PubMed] [Google Scholar]
- 35.Yurek DM, Flectcher AM, Kowalczyk TH, Padegimas L, Cooper MJ. Cell Transplant. 2009;18:1183. doi: 10.3727/096368909X12483162196881. [DOI] [PMC free article] [PubMed] [Google Scholar]
- 36.Yurek DM, Fletcher AM, Smith GM, Seroogy KB, Ziady AG, Molter J, Kowalczyk TH, Padegimas L, Cooper MJ. Mol Ther. 2009;17:641. doi: 10.1038/mt.2009.2. [DOI] [PMC free article] [PubMed] [Google Scholar]
- 37.Konstan MW, Davis PB, Wagener JS, Hilliard KA, Stern RC, Milgram LJ, Kowalczyk TH, Hyatt SL, Fink TL, Gedeon CR, Oette SM, Payne JM, Muhammad O, Ziady AG, Moen RC, Cooper MJ. Hum Gene Ther. 2004;15:1255. doi: 10.1089/hum.2004.15.1255. [DOI] [PubMed] [Google Scholar]
- 38.Pamujula S, Hazari S, Bolden G, Graves RA, Chinta DD, Dash S, Kishore V, Mandal TK. J Pharm Pharmacol. 2012;64:61. doi: 10.1111/j.2042-7158.2011.01376.x. [DOI] [PMC free article] [PubMed] [Google Scholar]
- 39.Hu Y, Xie J, Tong YW, Wang CH. J Control Release. 2007;118:7. doi: 10.1016/j.jconrel.2006.11.028. [DOI] [PubMed] [Google Scholar]
- 40.MacKay JA, Li W, Huang Z, Dy EE, Huynh G, Tihan T, Collins R, Deen DF, Szoka FC. Molecular Therapy. 2008;16:893. doi: 10.1038/mt.2008.36. [DOI] [PubMed] [Google Scholar]
- 41.Stiles DK, Zhang Z, Ge P, Nelson B, Grondin R, Ai Y, Hardy P, Nelson PT, Guzaev AP, Butt MT, Charisse K, Kosovrasti V, Tchangov L, Meys M, Maier M, Nechev L, Manoharan M, Kaemmerer WF, Gwost D, Stewart GR, Gash DM, Sah DW. Exp Neurol. 2012;233:463. doi: 10.1016/j.expneurol.2011.11.020. [DOI] [PubMed] [Google Scholar]
- 42.Fox JH, Connor T, Stiles M, Kama J, Lu Z, Dorsey K, Liebermann G, Sapp E, Cherny RA, Banks M, Volitakis I, DiFiglia M, Berezovska O, Bush AI, Hersch SM. Journal of Biological Chemistry. 2011;286:18320. doi: 10.1074/jbc.M110.199448. [DOI] [PMC free article] [PubMed] [Google Scholar]
- 43.Voges J, Weber F, Reszka R, Sturm V, Jacobs A, Heiss WD, Wiestler O, Kapp JF. Hum Gene Ther. 2002;13:675. doi: 10.1089/10430340252837260. [DOI] [PubMed] [Google Scholar]
- 44.Zhou J, Patel TR, Sirianni RW, Strohbehn G, Zheng MQ, Duong N, Schafbauer T, Huttner AJ, Huang Y, Carson RE, Zhang Y, Sullivan DJ, Jr, Piepmeier JM, Saltzman WM. Proc Natl Acad Sci U S A. 2013;110:11751. doi: 10.1073/pnas.1304504110. [DOI] [PMC free article] [PubMed] [Google Scholar]
- 45.Salegio EA, Streeter H, Dube N, Hadaczek P, Samaranch L, Kells AP, San Sebastian W, Zhai Y, Bringas J, Xu T, Forsayeth J, Bankiewicz KS. Front Neuroanat. 2014;8:9. doi: 10.3389/fnana.2014.00009. [DOI] [PMC free article] [PubMed] [Google Scholar]
- 46.Guerrero-Cazares H, Tzeng SY, Young NP, Abutaleb AO, Quinones-Hinojosa A, Green JJ. ACS Nano. 2014;8:5141. doi: 10.1021/nn501197v. [DOI] [PMC free article] [PubMed] [Google Scholar]
- 47.Szerlip NJ, Walbridge S, Yang L, Morrison PF, Degen JW, Jarrell ST, Kouri J, Kerr PB, Kotin R, Oldfield EH, Lonser RR. J Neurosurg. 2007;107:560. doi: 10.3171/JNS-07/09/0560. [DOI] [PubMed] [Google Scholar]
- 48.Yin D, Forsayeth J, Bankiewicz KS. J Neurosci Methods. 2010;187:46. doi: 10.1016/j.jneumeth.2009.12.008. [DOI] [PMC free article] [PubMed] [Google Scholar]
- 49.Lieberman DM, Laske DW, Morrison PF, Bankiewicz KS, Oldfield EH. J Neurosurg. 1995;82:1021. doi: 10.3171/jns.1995.82.6.1021. [DOI] [PubMed] [Google Scholar]
- 50.Neeves KB, Sawyer AJ, Foley CP, Saltzman WM, Olbricht WL. Brain Res. 2007;1180:121. doi: 10.1016/j.brainres.2007.08.050. [DOI] [PMC free article] [PubMed] [Google Scholar]
- 51.Chen MY, Lonser RR, Morrison PF, Governale LS, Oldfield EH. J Neurosurg. 1999;90:315. doi: 10.3171/jns.1999.90.2.0315. [DOI] [PubMed] [Google Scholar]
- 52.Nguyen TT, Pannu YS, Sung C, Dedrick RL, Walbridge S, Brechbiel MW, Garmestani K, Beitzel M, Yordanov AT, Oldfield EH. J Neurosurg. 2003;98:584. doi: 10.3171/jns.2003.98.3.0584. [DOI] [PubMed] [Google Scholar]
- 53.Casanova F, Carney PR, Sarntinoranont M. PLoS One. 2014;9:e94919. doi: 10.1371/journal.pone.0094919. [DOI] [PMC free article] [PubMed] [Google Scholar]
- 54.Bernal GM, LaRiviere MJ, Mansour N, Pytel P, Cahill KE, Voce DJ, Kang S, Spretz R, Welp U, Noriega SE, Nunez L, Larsen G, Weichselbaum RR, Yamini B. Nanomedicine. 2014;10:149. doi: 10.1016/j.nano.2013.07.003. [DOI] [PMC free article] [PubMed] [Google Scholar]
- 55.Chen MY, Hoffer A, Morrison PF, Hamilton JF, Hughes J, Schlageter KS, Lee J, Kelly BR, Oldfield EH. J Neurosurg. 2005;103:311. doi: 10.3171/jns.2005.103.2.0311. [DOI] [PubMed] [Google Scholar]
- 56.Amoozgar Z, Yeo Y. Wiley Interdiscip Rev Nanomed Nanobiotechnol. 2012;4:219. doi: 10.1002/wnan.1157. [DOI] [PMC free article] [PubMed] [Google Scholar]
- 57.Ogris M, Steinlein P, Carotta S, Brunner S, Wagner E. AAPS PharmSci. 2001;3:E21. doi: 10.1208/ps030321. [DOI] [PMC free article] [PubMed] [Google Scholar]
- 58.Sonawane ND, Szoka FC, Jr, Verkman AS. Journal of Biological Chemistry. 2003;278:44826. doi: 10.1074/jbc.M308643200. [DOI] [PubMed] [Google Scholar]
- 59.Davies LA, McLachlan G, Sumner-Jones SG, Ferguson D, Baker A, Tennant P, Gordon C, Vrettou C, Baker E, Zhu J, Alton EW, Collie DD, Porteous DJ, Hyde SC, Gill DR. Mol Ther. 2008;16:1283. doi: 10.1038/mt.2008.96. [DOI] [PubMed] [Google Scholar]
- 60.Beyerle A, Merkel O, Stoeger T, Kissel T. Toxicol Appl Pharmacol. 2010;242:146–54. doi: 10.1016/j.taap.2009.10.001. [DOI] [PubMed] [Google Scholar]
- 61.Ziady AG, Gedeon CR, Muhammad O, Stillwell V, Oette SM, Fink TL, Quan W, Kowalczyk TH, Hyatt SL, Payne J, Peischl A, Seng JE, Moen RC, Cooper MJ, Davis PB. Mol Ther. 2003;8:948. doi: 10.1016/j.ymthe.2003.09.002. [DOI] [PubMed] [Google Scholar]
- 62.Ziady AG, Gedeon CR, Miller T, Quan W, Payne JM, Hyatt SL, Fink TL, Muhammad O, Oette S, Kowalczyk T, Pasumarthy MK, Moen RC, Cooper MJ, Davis PB. Mol Ther. 2003;8:936. doi: 10.1016/j.ymthe.2003.07.007. [DOI] [PubMed] [Google Scholar]
- 63.Hosmane S, Tegenge MA, Rajbhandari L, Uapinyoying P, Kumar NG, Thakor N, Venkatesan A. Journal of Neuroscience. 2012;32:7745. doi: 10.1523/JNEUROSCI.0203-12.2012. [DOI] [PMC free article] [PubMed] [Google Scholar]
- 64.Schuster BS, Suk JS, Woodworth GF, Hanes J. Biomaterials. 2013;34:3439–46. doi: 10.1016/j.biomaterials.2013.01.064. [DOI] [PMC free article] [PubMed] [Google Scholar]
- 65.Savin T, Doyle PS. Biophys J. 2005;88:623. doi: 10.1529/biophysj.104.042457. [DOI] [PMC free article] [PubMed] [Google Scholar]
- 66.Liu Y, Liggitt HD, Dow S, Handumrongkul C, Heath TD, Debs RJ. Journal of Biological Chemistry. 2002;277:4966. doi: 10.1074/jbc.M110285200. [DOI] [PubMed] [Google Scholar]
- 67.Recinos VR, Tyler BM, Bekelis K, Sunshine SB, Vellimana A, Li KW, Brem H. Neurosurgery. 2010;66:530. doi: 10.1227/01.NEU.0000365263.14725.39. [DOI] [PubMed] [Google Scholar]
Associated Data
This section collects any data citations, data availability statements, or supplementary materials included in this article.