Abstract
Objective
To investigate the repeatability of the quantitative magnetic resonance imaging (MRI) metric (apparent diffusion coefficient (ADC)) derived from reduced field-of-view diffusion-weighted (rFOV DWI) on thyroid glands in a clinical setting.
Materials and Methods
Ten healthy human volunteers were enrolled in MRI studies performed on a 3T MRI scanner. Each volunteer was designed to undergo 3 longitudinal exams (2 weeks apart) with 2 repetitive sessions within each exam, which included rFOV and conventional full field-of-view (fFOV) DWI scans. DWI images were assessed and scored based on image characteristics. ADC values of thyroid glands from all subjects were calculated based on regions of interest. Repeatability analysis was performed based on the framework proposed by the Quantitative Imaging Biomarker Alliance (QIBA), generating four repeatability metrics: within-subject variance (σw2), repeatability coefficients (RC), intraclass correlation coefficient (ICC) and within-subject coefficient of variation (wCV). Student t test was employed to compare the performance difference between rFOV and fFOV DWI.
Results
The overall image quality from rFOV DWI was significantly higher than that from fFOV DWI (p=0.04). The ADC values calculated from rFOV DWI were significantly lower than corresponding values from fFOV DWI (p<0.001). There was no significant difference in ADC values across sessions and exams in either rFOV or fFOV DWI (p>0.05). rFOV DWI had lower values of σw2, RC, and wCV and a higher value of ICC compared to fFOV DWI either across sessions and exams.
Conclusion
This study demonstrated that rFOV DWI produced more superior quality DWI images and more repeatable ADC measurements compared to fFOV DWI, thus providing a feasible quantitative imaging tool for investigating thyroid glands in clinical settings.
Keywords: reduced field-of-view diffusion-weighted imaging, repeatability, thyroid glands
INTRODUCTION
Diffusion-weighted imaging (DWI) is a specialized magnetic resonance imaging (MRI) technique that allows for characterization of the tissues and their physiologic processes because it reflects the random motion of water protons, which are disturbed by intracellular organelles and macromolecules located in the tissues1–3. Apparent diffusion coefficient (ADC) is a derived quantitative imaging metric from DWI and measures water molecular diffusivity4. Initial studies have shown ADC as a novel quantitative imaging biomarker (QIB) in clinical applications ranging from detection of tumor to differentiation between benign and malignant thyroid tissue in patients 5–11. However, severe geometric distortion and ghosting artifacts which is usually suffered from the conventinal full field-of-view (fFOV) DWI images in the region of thyroid glands impact heavily on the performance of the fFOV DWI technique and influence significantly its applicability in quantitative investigation 8, 12–14. Therefore, there is a clinical need for a technique to replace the fFOV DWI that minimizes these artifacts and provides higher quality images for thyroid glands. The reduced field-of-view (rFOV) DWI technique using two-dimensional spatially selective excitation, which excites only the region of interest (ROI), has shown its effectiveness in providing high quality images with less artifacts, and therefore supplying more reliable QIBs 15–19. This technique has been assessed previously in several human organs, such as spinal cords 15, 16, 19, pancreas18 and breasts 17, 20, 21. In order to translate the technique into clinical application and quantitative investigation in thyroid glands, a comprehensive evaluation of its repeatability is imperative. Repeatability which investigates the underlying variation between test-retest MRI scans tells us the sources of within-subject measurement variability 22, which is critical in quantitative imaging for evaluating and determining the performance of QIBs in clinical settings. Recently the Quantitative Imaging Biomarker Alliance (QIBA) of the Radiological Society of North America established a framework for conducting and evaluating the performance of QIBs23, 24. In this framework, a set of technical performance analysis method, metrics, and study design that provide terminology, metrics, and methods consistent with widely accepted metrological standards was proposed 23, 24. The purpose of this study was to investigate the repeatability of the ADC metric derived from rFOV DWI on thyroid glands in a clinical setting following the QIBA proposed framework.
MATERIALS AND METHODS
Phantom
A sphere phantom consisting of a 1% sodium azide solution was used to test the protocol.
Subjects
Ten healthy human volunteers (age, 23–50 years; male/female, 5/5) were enrolled in this prospective study, which was approved by the local institutional review board. All volunteers provided written informed consents.
MRI data acquisition
The phantom and all human subjects underwent magnetic resonance imaging (MRI) studies on a GE 3T Discovery MR750 scanner with an 8-channel neurovascular phased-array coil. The phantom was scanned at room temperature. The repeatability study was designed to consist of 3 longitudinal exams (2 weeks apart) with 2 repetitive sessions in each MRI exam. The 2nd session in the two repetitive sessions within each exam was performed after the volunteers took a short break and were repositioned at the scanner. For each subject, the settings of the MRI protocol were identical. The MRI protocol included rFOV and fFOV DWI scans, which were performed after localizer and T2-weighted imageswith a 2D fast spin-echo sequence, with repetition time (TR) = 4000 ms and time (TE) = 100 ms. The acquisition parameters of fFOV DWI scans with the single-shot spin-echo echo-planar imaging (SS-SE-EPI) sequence were: FOV = 200–260mm, slices = 6–10, thickness = 4–8mm, TR = 6000 ms, TE= minimum, b = 500 s/mm2, matrix=160 × 160, Number of Excitation (NEX)=8, and ASSET=2. rFOV DWI scans were set with the same acquisition parameters as fFOV DWI, except matrix=160 × 64, phase FOV factor=0.4, and NEX=12.
Radiologic assessment
rFOV and fFOV images were assessed by an experienced neuroradiologist based on the following image characteristics: anatomic detail, lack of susceptibility-induced artifacts, perceived signal-to-noise ratio (SNR), and perceived clinical utility 16. T2 images were used as a standard for image quality evaluation. Scoring was based on a 5-point scale as follows: 1- nondiagnostic, 2 - poor, 3- satisfactory, 4 -good, and 5 - excellent.
ADC measurement
ROIs for ADC measurement were prescribed on the phantom and human subjects with a fixed circle area (diameter = 8mm). For the phantom, ROIs were placed around the center of the sphere; for human subjects, ROIs were prescribed on the lobes of thyroid glands by an experienced neuroradiologist. Single ROI was placed on the axial DWI (b=0) image per subject. The ADC for the ROI was calculated using a monoexponential function with a noise correction scheme 25.
Repeatability analysis
Repeatability of the ADC measurements was assessed across sessions or exams by using the QIBA proposed statistical metrics23, 24:
-
Within-subject variance (σw2):
σw2 is the variance of within-suject which is estimated as sw2=SSε/dfε by using the Analysis of Variance (ANOVA) method, where the degree of freedoms dfε= n(k−1), n is the number of patients and k is the number of repetitive measurements; SSε is the within-subject sum of squares.
-
Repeatability coefficients (RC):
RC is defined as the least siginificant difference between two repeated measurements at a two-sided significance of α=0.05: .
-
Intraclass correlation coefficient (ICC):
ICC is a measure of repeated measures consistence relative to the total variability in the population which is defined as , where is the between subject variance.
-
Within-subject coefficient of variation (wCV,%):
wCV is defined as 100×σw/μ, where μ is the overall mean of the ADC measurements.
Statistical analysis
Statistical measures such as mean and standard deviation of radiologic scores and ADC measurements across sessions and exams were calculated. Student’s t test was performed to compare the difference of radiologic scores and ADC measurement across sessions and exams between rFOV and fFOV DWI techniques. A p value of less than 0.05 indicated statistical significance.
All computation and analysis were performed by an analysis software written in Matlab R2008a and run on a Microsoft Windows workstation.
RESULTS
Phantom
The ROI (fixed diameter = 8mm) for calculating ADC values was placed on on the central slice of the sphere phantom (Figure 1). There is no significant difference of ADC values between rFOV and fFOV DWI (p>0.05) (Table 1). No significant difference of ADC values was also found between the two sessions either from rFOV or fFOV DWI. Only repeatability analysis across sessions was performed on phantom data, showing that rFOV DWI has lower values of σw2 (1.08E-04 vs 1.17E-04) RC (0.0288 vs 0.0300), and wCV (0.51 vs 0.54) and a higher value of ICC (0.9869 vs 0.8926) than fFOV DWI (Table 1).
Figure 1.
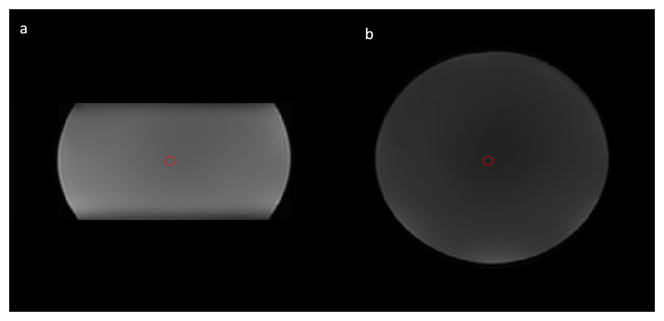
rFOV and fFOV DWI images from the phantom. (a) a rFOV DWI image at b=0 s/mm2; (b) a fFOV DWI image at b=0 s/mm2. Red circles (d=8mm) are the regions of interest for ADC calculation.
Table 1.
The repeatability analysis of ADC measurement with rFOV and fFOV DWI in the phantom
| Measurements | rFOV DWI | fFOV DWI | p value |
|---|---|---|---|
| ADC value (×10−3 mm2/s) (mean±std) | 2.05±0.06 | 2.01±0.02 | P>0.05 |
| ADC value (×10−3 mm2/s) (across sessions) (mean±std) | 2.05±0.06 vs 2.06±0.07 (p>0.05) | 2.01±0.01 vs 2.01±0.03 (p>0.05) | |
| Within-subject variance (σw2) (×10−3 mm2/s)2 | 1.08E-04 | 1.17E-04 | |
| Repeatability coefficients (RC) (×10−3 mm2/s) | 0.0288 | 0.0300 | |
| Intraclass correlation coefficient (ICC) | 0.9869 | 0.8926 | |
| Within-subject coefficient of variation (wCV,%) | 0.51 | 0.54 |
Subjects
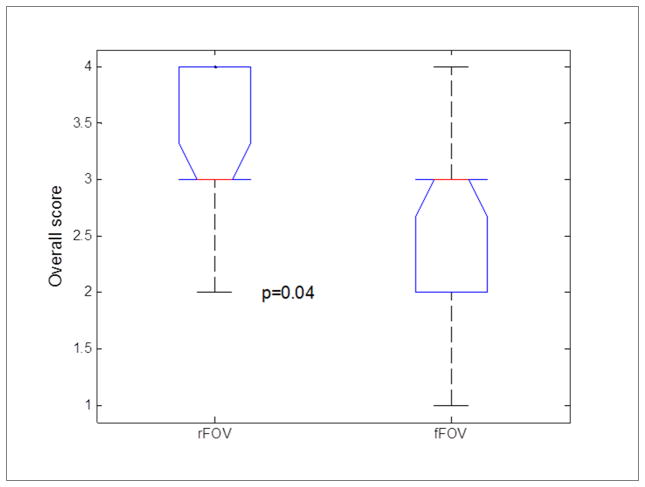
The images of rFOV DWI from a representative volunteer (28 years old, male) is less distorted compared to fFOV DWI (Figure 2). Image quality evaluation was performed on the 1st session images of each exam only since there was no obvious difference in image quality between two sessions according to the reviews from the experienced radiologist. 23 MRI exams were finally employed for image quality evaluation because the first volunteer had incomplete first exam and no follow up MRIs (n=3) and 4 volunteers (n=4) did not show up for the 3rd repeat MRI exam. Analyses of the datasets showed that the overall image quality from rFOV DWI was significantly higher than fFOV DWI (3.21±0.67 vs 2.73±0.86; p=0.04; see Table 2 and Figure 3).
Figure 2.

The comparison of rFOV and fFOV DWI images from a representative human subject (28 years old, male). (a) a T2 weighted image; (b) a rFOV DWI image at b=0 s/mm2; (c) a fFOV DWI image at b=0 s/mm2. ROIs for calculating ADC values are shown as red circles.
Table 2.
The radiologic assessment of rFOV and fFOV DWI in thyroid glands
| Radiologic scores (mean±std) | rFOV DWI | fFOV DWI | p value |
|---|---|---|---|
| Anatomic detail | 3.21±0.67 | 2.82±0.88 | |
| Susceptibility | 3.08±0.59 | 2.60±0.78 | p=0.02* |
| SNR | 3.13±0.62 | 2.95±1.02 | |
| Clinical utility | 3.21±0.67 | 2.78±0.90 | |
| Overall quality | 3.21±0.65 | 2.73±0.85 | p=0.04* |
denotes p value <0.05
Figure 3.
Boxplot comparing radiologic scores between rFOV and fFOV DWI. On each box, the central mark (red line) is the median, the edges of the box are the 25th and 75th percentiles, and the whiskers extend to the most extreme data points.
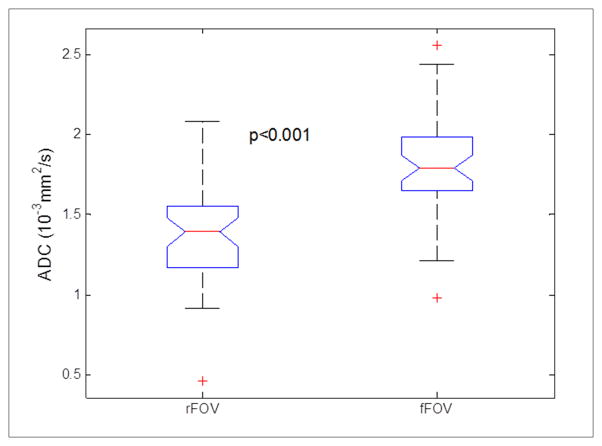
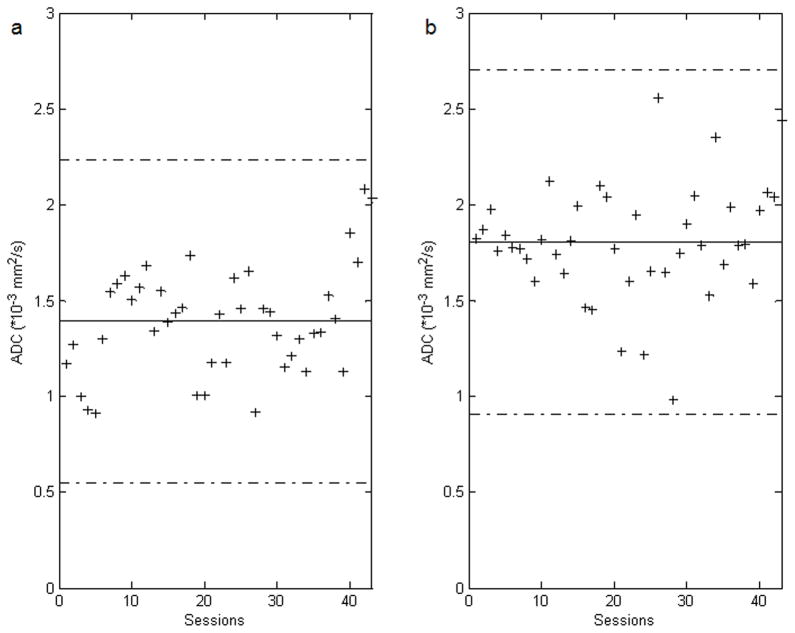
Figure 4 exhibits the ADC maps of rFOV and fFOV DWI from a volunteer (26 years old, female). The ADC values calculated from the ROIs for the thyroid tissue were 1.54×10⁻³ mm2/s (for rFOV DWI) vs 1.99×10⁻³ mm2/s (for fFOV DWI), respectively. After image quality evaluation of the 23 MRI exams (46 sessions (23×2)), 43 MRI sessions were suitable for ADC calculation and repeatibilty analysis. Three repeated sessions were excluded due to poor image quality. On analysis, the ADC values from rFOV DWI were significantly lower than the corresponding values from fFOV DWI (p<0.001, Table 3, Figure 5 and 6). There was no significant difference in ADC values across sessions or exams either from rFOV DWI or fFOV DWI (p>0.05 for both, Table 3). The first exam of each subject was employed for repeatability analysis across sessions; The first session of each exam was employed for repeatability analysis across exams. The repeatability analysis shows that rFOV DWI has lower values of σw2 and RC, and a higher value of ICC than the corresponding values from fFOV DWI, across either sessions or exams (Table 3). The wCV of ADC values across sessions and exams from rFOV DWI was 4.86% and 9.88%, respectively which is lower than from fFOV DWI.
Figure 4.
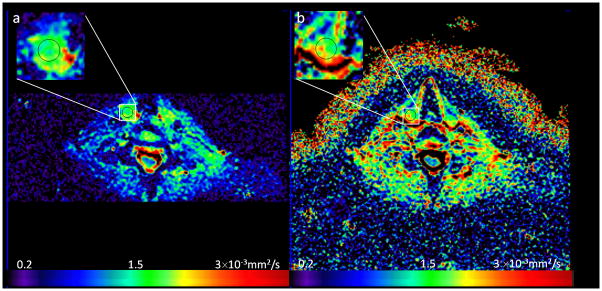
ADC maps of rFOV (a) and fFOV (b) DWI images from a representative human subject (26 years old, female). For both (a) and (b), the upper left icon are zoomed images of prescribed ROIs. The color bar depicts the range of ADC values.
Table 3.
The repeatability analysis of ADC measurement with rFOV and fFOV DWI in thyroid glands
| Measurements | rFOV DWI | fFOV DWI | p value |
|---|---|---|---|
| ADC value (×10−3 mm2/s) (for all sessions) (mean±std) | 1.37±0.31 | 1.80±0.29 | p<0.001* |
| Across sessions | |||
| ADC value (×10−3 mm2/s) (mean±std) | 1.39±0.27 vs 1.34±0.34 (p>0.05) | 1.84±0.18 vs 1.76±0.38 (p>0.05) | |
| Within-subject variance (σw2) (×10−3 mm2/s)2 | 0.0046 | 0.0921 | |
| Repeatability coefficients (RC) (×10−3 mm2/s) | 0.1877 | 0.8412 | |
| Intraclass correlation coefficient (ICC) | 0.9755 | 0.5148 | |
| Within-subject coefficient of variation (wCV,%) | 4.86 | 17.30 | |
| Across exams | |||
| ADC value (×10−3 mm2/s) (mean±std) | 1.36±0.27 vs 1.37±0.35 vs 1.27±0.22 (p>0.05) | 1.84±0.33 vs 1.74±0.27 vs 1.74±0.23 (p>0.05) | |
| Within-subject variance (σw2) | 0.0147 | 0.0351 | |
| Repeatability coefficients (RC) | 0.3355 | 0.5192 | |
| Intraclass correlation coefficient (ICC) | 0.9273 | 0.5175 | |
| Within-subject coefficient of variation (wCV,%) | 9.88 | 10.33 | |
denotes p value <0.05
Figure 5.
Boxplot comparing ADC values between rFOV and fFOV DWI. On each box, the central mark (red line) is the median, the edges of the box are the 25th and 75th percentiles, and the whiskers extend to the most extreme data points.
Figure 6.
Bland-Altman plots for depicting the ADC values of all sessions against their overall mean of rFOV DWI (a) and fFOV DWI (b). The solid lines indicate the overall means of the ADC values and the dashed lines show the 95% confidence intervals of the ADC values.
DISCUSSION
This study demonstrated that the rFOV DWI technique produced higher quality images and higher repeatablility in ADC measurement compared to the fFOV DWI when applied to imaging thyroid glands.
The thyroid gland is a very small organ near the air-tissue boundary, which is well-suited to the reduced field-of-view approach. The 2D RF pulse sequence excites only the ROI obviating the need to spatially encode the entire object extent in the phase encode direction, resulting in shorter total readout time and consequently, a reduction in image artifacts caused by subject motion and susceptibility differences. It was demonstrated in our results that the overall image quality from rFOV DWI was significantly higher than that from fFOV DWI. The susceptibility artifacts were dramatically decreased in rFOV DWI images. Similar findings have been reported that recommend a strong preference for rFOV DWI on the basis of reduction of susceptibility artifacts 16, 19.
The rFOV DWI technique was originally applied in spinal cord diffusion imaging 16, 19 and then extended to other anatomies 20 . In order to translate the technique into clinical and quantitative investigation on thyroid patients, a comprehensive evaluation of its repeatability is warranted. Our study is the first to investigate the repeatability of the ADC measurement using rFOV DWI in thyroid glands. According to the documents proposed by the QIBA, the reproducibility and repeatability studies are crucial in quantitative imaging for evaluating the performance of QIBs since they can reveal and identify sources of measurement error or variation underlying the experiments, which is influenced by many factors such as scanner reliability, protocol consistency, subject physiology, among others 22, 26, 27. In contrast with reproducibility, which reveals the agreement between independent results obtained with the same method on identical test materials under different conditions of measurement, repeatability study specificly investigates the agreement between independent results obtained with the same method on identical test materials under the same conditions of measurement, which will reveal the variability of within-subject 22–24. In our repeatability study, we performed all studies on the same MRI scanner using the same protocol and analyzed the MRI data with the same processing algorithm. The low values of σw2, RC, and wCV, and a high value of ICC reveal that the within-subject variability of rFOV DWI is quitely lower and the technique is more repeatable within subject, compared to fFOV DWI.
The ADC values of thyroid glands calculated based on the rFOV DWI images in our study were significantly lower than those calculated based on fFOV DWI images, unlike some previous studies in the spine that did not find a significant difference in ADC values between the rFOV and fFOV DWI techniques 16, 19. However, in a study of pretreatment DWI of breast cancer, significantly lower values of the 15th-percentile tumor ADC (p=0.03) were found in rFOV DWI 20. The lower ADC values from rFOV DWI may reveal underlying true diffusivity in thyroid glands. The reasons may be due to different physiologies of thyroid glands and unique features of rFOV DWI with its inherent fat saturation, outer volume suppression and image artifact reduction. Because there are only a few reports published 16, 18–20, further evaluation of ADC measurement of rFOV DWI in other organs is needed.
Our study had few limitations such as its small subject population. However, the low number of volunteers was due to the study design that focused on feasibility and repeatability of ADC for the first time using rFOV in thyroid glands. We were unable to compare rFOV DWI with other techniques such as multishot interleaved EPI, or other outer volume suppression methods. In order to incorporate this technique into routine imaging protocols in clinics, studies in patients with clinical pathologies such as thyroid cancer are warranted.
Conclusion
This study demonstrated that rFOV DWI produced images with more superior quality and quantified ADC values with higher repeatablility compared to fFOV DWI when imaging thyroid glands in clinical environments. rFOV DWI is a feasible quantitative imaging tool for investigating thyroid glands in clinics.
Acknowledgments
Grant support: Supported by the National Cancer Institute/National Institutes of Health (grant number 1R21CA176660-01A1)
The authors would like to thank the MRI technologists, especially Mr. Gregory Nyman, for performing the examinations and Ms. Dara Srisaranard for her kind contribution to volunteer enrollment and data management. We are also thankful to Ms. Sandhya George for editing the manuscript.
ABBREVIATION KEY
- ADC
Apparent Diffusion Coefficient
- DWI
Diffusion Weighted Imaging
- fFOV
Full Field-Of-View
- ICC
Intraclass Correlation Coefficient
- MRI
Magnetic Resonance Imaging
- NEX
Number of Excitation
- QIB
Quantitative Imaging Biomarker
- QIBA
Quantitative Imaging Biomarker Alliance
- rFOV
Reduced Field-Of-View
- RC
Repeatability Coefficients
- ROI
Region Of Interest
- SS-EPI
Single Shot Echo Planar Imaging
- STD
Standard Deviation
- TR
Repetition Time
- TE
Echo Time
- wCV
within-subject Coefficient of Variation
Footnotes
All authors have no conflicts of interest with regard to this manuscript.
References
- 1.Le Bihan D, Turner R, Douek P, et al. Diffusion MR imaging: clinical applications. AJR Am J Roentgenol. 1992;159:591–9. doi: 10.2214/ajr.159.3.1503032. [DOI] [PubMed] [Google Scholar]
- 2.Padhani AR, Koh DM. Diffusion MR imaging for monitoring of treatment response. Magn Reson Imaging Clin N Am. 2011;19:181–209. doi: 10.1016/j.mric.2010.10.004. [DOI] [PubMed] [Google Scholar]
- 3.Bonekamp S, Corona-Villalobos CP, Kamel IR. Oncologic applications of diffusion-weighted MRI in the body. J Magn Reson Imaging. 2012;35:257–79. doi: 10.1002/jmri.22786. [DOI] [PubMed] [Google Scholar]
- 4.Le Bihan D. Molecular diffusion, tissue microdynamics and microstructure. NMR Biomed. 1995;8:375–86. doi: 10.1002/nbm.1940080711. [DOI] [PubMed] [Google Scholar]
- 5.Erdem G, Erdem T, Muammer H, et al. Diffusion-weighted images differentiate benign from malignant thyroid nodules. J Magn Reson Imaging. 2010;31:94–100. doi: 10.1002/jmri.22000. [DOI] [PubMed] [Google Scholar]
- 6.Schueller-Weidekamm C, Kaserer K, Schueller G, et al. Can quantitative diffusion-weighted MR imaging differentiate benign and malignant cold thyroid nodules? Initial results in 25 patients. AJNR Am J Neuroradiol. 2009;30:417–22. doi: 10.3174/ajnr.A1338. [DOI] [PMC free article] [PubMed] [Google Scholar]
- 7.Tezuka M, Murata Y, Ishida R, et al. MR imaging of the thyroid: correlation between apparent diffusion coefficient and thyroid gland scintigraphy. J Magn Reson Imaging. 2003;17:163–9. doi: 10.1002/jmri.10247. [DOI] [PubMed] [Google Scholar]
- 8.Bozgeyik Z, Coskun S, Dagli AF, et al. Diffusion-weighted MR imaging of thyroid nodules. Neuroradiology. 2009;51:193–8. doi: 10.1007/s00234-008-0494-3. [DOI] [PubMed] [Google Scholar]
- 9.Wu LM, Chen XX, Li YL, et al. On the utility of quantitative diffusion-weighted MR imaging as a tool in differentiation between malignant and benign thyroid nodules. Acad Radiol. 2014;21:355–63. doi: 10.1016/j.acra.2013.10.008. [DOI] [PubMed] [Google Scholar]
- 10.Taha MS, Hassan O, Amir M, et al. Diffusion-weighted MRI in diagnosing thyroid cartilage invasion in laryngeal carcinoma. Eur Arch Otorhinolaryngol. 2014;271:2511–6. doi: 10.1007/s00405-013-2782-8. [DOI] [PubMed] [Google Scholar]
- 11.Shi HF, Feng Q, Qiang JW, et al. Utility of diffusion-weighted imaging in differentiating malignant from benign thyroid nodules with magnetic resonance imaging and pathologic correlation. J Comput Assist Tomogr. 2013;37:505–10. doi: 10.1097/RCT.0b013e31828d28f0. [DOI] [PubMed] [Google Scholar]
- 12.Chawla S, Kim S, Wang S, et al. Diffusion-weighted imaging in head and neck cancers. Future Oncol. 2009;5:959–75. doi: 10.2217/fon.09.77. [DOI] [PMC free article] [PubMed] [Google Scholar]
- 13.Taviani V, Nagala S, Priest AN, et al. 3T diffusion-weighted MRI of the thyroid gland with reduced distortion: preliminary results. Br J Radiol. 2013;86:20130022. doi: 10.1259/bjr.20130022. [DOI] [PMC free article] [PubMed] [Google Scholar]
- 14.Le Bihan D, Poupon C, Amadon A, et al. Artifacts and pitfalls in diffusion MRI. J Magn Reson Imaging. 2006;24:478–88. doi: 10.1002/jmri.20683. [DOI] [PubMed] [Google Scholar]
- 15.Saritas EU, Cunningham CH, Lee JH, et al. DWI of the spinal cord with reduced FOV single-shot EPI. Magn Reson Med. 2008;60:468–73. doi: 10.1002/mrm.21640. [DOI] [PubMed] [Google Scholar]
- 16.Zaharchuk G, Saritas EU, Andre JB, et al. Reduced field-of-view diffusion imaging of the human spinal cord: comparison with conventional single-shot echo-planar imaging. AJNR Am J Neuroradiol. 2011;32:813–20. doi: 10.3174/ajnr.A2418. [DOI] [PMC free article] [PubMed] [Google Scholar]
- 17.Dong H, Li Y, Li H, et al. Study of the reduced field-of-view diffusion-weighted imaging of the breast. Clin Breast Cancer. 2014;14:265–71. doi: 10.1016/j.clbc.2013.12.001. [DOI] [PubMed] [Google Scholar]
- 18.Ma C, Li YJ, Pan CS, et al. High resolution diffusion weighted magnetic resonance imaging of the pancreas using reduced field of view single-shot echo-planar imaging at 3 T. Magn Reson Imaging. 2014;32:125–31. doi: 10.1016/j.mri.2013.10.005. [DOI] [PubMed] [Google Scholar]
- 19.Andre JB, Zaharchuk G, Saritas E, et al. Clinical evaluation of reduced field-of-view diffusion-weighted imaging of the cervical and thoracic spine and spinal cord. AJNR Am J Neuroradiol. 2012;33:1860–6. doi: 10.3174/ajnr.A3134. [DOI] [PMC free article] [PubMed] [Google Scholar]
- 20.Wilmes LJ, McLaughlin RL, Newitt DC, et al. High-resolution diffusion-weighted imaging for monitoring breast cancer treatment response. Acad Radiol. 2013;20:581–9. doi: 10.1016/j.acra.2013.01.009. [DOI] [PMC free article] [PubMed] [Google Scholar]
- 21.Singer L, Wilmes LJ, Saritas EU, et al. High-resolution diffusion-weighted magnetic resonance imaging in patients with locally advanced breast cancer. Acad Radiol. 2012;19:526–34. doi: 10.1016/j.acra.2011.11.003. [DOI] [PMC free article] [PubMed] [Google Scholar]
- 22.Madelin G, Babb JS, Xia D, et al. Reproducibility and repeatability of quantitative sodium magnetic resonance imaging in vivo in articular cartilage at 3 T and 7 T. Magn Reson Med. 2012;68:841–9. doi: 10.1002/mrm.23307. [DOI] [PMC free article] [PubMed] [Google Scholar]
- 23.Raunig DL, McShane LM, Pennello G, et al. Quantitative imaging biomarkers: A review of statistical methods for technical performance assessment. Stat Methods Med Res. 2014 doi: 10.1177/0962280214537344. [DOI] [PMC free article] [PubMed] [Google Scholar]
- 24.Kessler LG, Barnhart HX, Buckler AJ, et al. The emerging science of quantitative imaging biomarkers terminology and definitions for scientific studies and regulatory submissions. Stat Methods Med Res. 2014 doi: 10.1177/0962280214537333. [DOI] [PubMed] [Google Scholar]
- 25.Lu Y, Jansen JF, Mazaheri Y, et al. Extension of the intravoxel incoherent motion model to non-gaussian diffusion in head and neck cancer. J Magn Reson Imaging. 2012;36:1088–96. doi: 10.1002/jmri.23770. [DOI] [PMC free article] [PubMed] [Google Scholar]
- 26.Malyarenko D, Galban CJ, Londy FJ, et al. Multi-system repeatability and reproducibility of apparent diffusion coefficient measurement using an ice-water phantom. J Magn Reson Imaging. 2013;37:1238–46. doi: 10.1002/jmri.23825. [DOI] [PMC free article] [PubMed] [Google Scholar]
- 27.Chenevert TL, Galban CJ, Ivancevic MK, et al. Diffusion coefficient measurement using a temperature-controlled fluid for quality control in multicenter studies. J Magn Reson Imaging. 2011;34:983–7. doi: 10.1002/jmri.22363. [DOI] [PMC free article] [PubMed] [Google Scholar]


