Abstract
The segmentation of diffusion tensor imaging (DTI) data is a challenging problem due to the high variation and overlap of the distributions induced by individual DTI measures (e.g., fractional anisotropy). Accurate tissue segmentation from DTI data is important for characterizing the microstructural properties of white matter (WM) in a subsequent analysis. This step may also be useful for generating a mask to constrain the results of WM tractography. In this study, a graph-cuts segmentation method was applied to the problem of extracting WM, gray matter (GM) and cerebral spinal fluid (CSF) from brain DTI data. A two-phase segmentation method was adopted by first segmenting CSF signal from the DTI data using the third eigenvalue (λ3) maps, and then extracting WM regions from the fractional anisotropy (FA) maps. The algorithm was evaluated on ten real DTI data sets obtained from in vivo human brains and the results were compared against manual segmentation by an expert. Overall, the graph cuts method performed well, giving an average segmentation accuracy of about 0.90, 0.77 and 0.88 for WM, GM and CSF respectively in terms of volume overlap(VO).
I. INTRODUCTION
Segmentation is a necessary first step for quantitative analysis of region and tissue specific image measures in neuroimaging. Manual segmentation by experts is typically considered the gold standard, but there is substantial performance variability between experts and even within indications by the same expert. Further, manual segmentation is very time consuming and an ineffective method for quantitative analyses [1]. Therefore, automatic segmentation approaches are clearly desirable to generate reproducible and effective results for objective segmentation without human intervention. Image segmentation remains a challenging problem in neuroimaging [2], [3]. Recently, graph cuts [4], [5], [6] based methods have emerged as a popular technique for automatic image segmentation (with minimal intervention) in computer vision. This is the method of choice in this paper.
Diffusion tensor imaging (DTI) is a relatively new method for non-invasively characterizing the microstructural features of biological tissues in vivo [7], [8], [9]. DTI has rich information on diffusion anisotropy and diffusivity. Diffusion anisotropy measures such as FA and relative anisotropy (RA) can be calculated using standard formulas [10]. Such diffusion anisotropy measures are high in WM. Therefore, we can use these measures to segment WM/non-WM regions. The three eigenvalues (λ1, λ2, λ3) of diffusion tensors and mean diffusivity (MD) can be used for characterizing the diffusion of water [7], [9]. It is known that the diffusivity value of CSF is more than twice that of the GM and WM regions [11]. Therefore, eigenvalues and MD are suitable to segment CSF/non-CSF regions. It seems plausible that the segmentation of WM/non-WM and CSF/non-CSF can be combined into a complete WM/GM/CSF segmentation in the same DTI space without requiring a registration step. A potential problem here is that DTI is highly sensitive to changes in the brain tissue microstructure from disease, injury, development and/or aging [12], [13], [14], [15]. The analysis of DTI is difficult due to the high level of variation of DTI measures like FA or RA across cerebral WM. For example, there is considerable overlap between the RA distributions of GM and WM, such that a simple binary thresholding method (which is commonly done) is not adequate [9]. Segmentation may be performed by co-registering DTI maps to a structural MR image and segmenting the DTI maps [16], [17]. However, misregistration will lead to errors in the DTI segmentation. Consequently, methods are necessary for segmenting DTI maps into specific tissue regions for both global and local characterization. In this paper, a 3D graph cuts algorithm was applied to automatically segment WM/GM/CSF tissue regions from DTI maps.
A two-phase segmentation approach was employed. First, CSF was segmented by a graph cuts algorithm and CSF was masked from the DTI maps. The initial segmentation of CSF was important to remove voxels with significant CSF contamination and corresponding high MD values. Then, the graph cuts algorithm was applied to segment the WM/GM from the FA maps. The method was applied to 40 images from DTI brain scans of 10 human subjects and the results were compared against manual segmentation by an expert of brain anatomy. In the next section, we briefly describe the methodology and then present the results of our experimental evaluations.
II. 3D SEGMENTATION WITH GRAPH CUTS
In the graph-cuts framework, the image segmentation is formulated as a discrete labeling problem where the objective is to assign the set of pixels in the image to a smaller set of labels. Typically, each label represents a distinct region (e.g., WM, CSF) desired in the final segmentation. The determination of the optimal labeling for an image is expressed as a Markov Random Field (MRF) energy function. The key advantage of such an approach is that the MRF energy can be optimized efficiently using maximum flow algorithms on a graph [4], known as graph cuts algorithms. The segmentation function has the form of
| (1) |
The first term is called the data term and measures how well a label fp fits a pixel p. The second term is the smoothness term, and considers similarity between neighbors (in terms of the labels assigned to them), see [4]. In this paper, an estimate of the labels is calculated using a k-means clustering algorithm. The centers from this clustering method are used as the labels. The weights for the terms in (1) are calculated using a radial basis function (with user specified width parameter σ). The smoothness term is calculated as
| (2) |
where common choice for , Iq and Iq are intensities for pixel p and q respectively, and λ = k for fp ≠ fq, otherwise 0. To segment DTI images using the graph cuts algorithms from [4], the volume of DTI images is represented as a 3D graph. The empirical performance of the algorithm depends on parameter selection (automatic parameter selection continues to be a topic of research [18], [19], [20]). In order to ensure the best possible segmentation, settings that led to the best overall performance on our data set were chosen (automatic selection was not used). Our experiments made use of the FA and λ3 maps for segmentation. We adopted a 10-neighborhood system for the 3D graph construction. We set k = 1, , and for WM segmentation with FA images, while k = 1, , and were chosen for CSF segmentation with the λ3 maps (where σd and σs correspond to the data and smoothness terms respectively). Since λ3 has high contrast between the CSF and other regions[9], we selected λ3 to segment CSF/non-CSF regions. Conversely, FA was used for the WM/non-WM segmentation.
The segmentation procedure using the graph cuts was performed in two steps in Fig.1. First, CSF/non-CSF regions were segmented using the λ3 maps. The determined CSF regions were then masked from FA maps. In the second phase, GM and WM were segmented using the FA maps. We note that α-expansion type methods may be directly applied for three class segmentation. However, the DTI application permits two-step two class segmentation (i.e., CSF/non-CSF and WM/non-WM), which can be solved optimally in an efficient manner, and we adopted this strategy. The execution time of our two-phase segmentation was 100 − 105s for each 128 × 128 × 62 sized DTI data set at the platform of Pentium D 2.8GHz processor with 2 GB memory. Finally, we calculated the accuracy of the segmented WM,GM and CSF regions, as described next.
Fig. 1.
An overview of the segmentation pipeline adopted in our study.
III. SEGMENTATION EVALUATION
The segmentation was evaluated on brain DTI data from 10 subjects in all. The DTI data were collected at 3.0T using an 8-channel receiver coil, DW-EPI with SENSE under-sampling of 2, b = 1000s/mm2, 12 encoding directions, a b=0 reference image, 3 averages, 2×2×2.5 mm voxels, and 50 contiguous axial slices. Informed consent was obtained from each subject in compliance with the guidelines for human subjects research. Head motion and eddy current distortions were corrected before our analysis. Maps of the λ3 and FA were generated for image segmentation.
In this study, gold standard CSF and WM maps were manually segmented from FA and λ3 maps in each of the data sets by a brain anatomy expert with Brainmaker[21]. Manual segmentation was performed on a combination of the FA and λ3 maps (CSF appears hyperintense and WM appears hypointense on λ3 maps) and a co-registered (although not perfectly) T1-W map was used as a rough guide. The expert was blinded to the graph cuts segmentation results. Four randomly chosen slices from each subject were segmented – a total of 40 images from 10 subjects.
The segmentation evaluation was done by measuring volume overlap [16], which is defined by
| (3) |
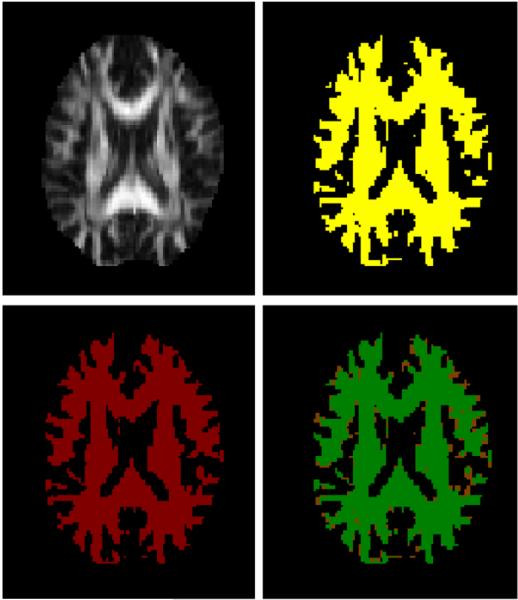
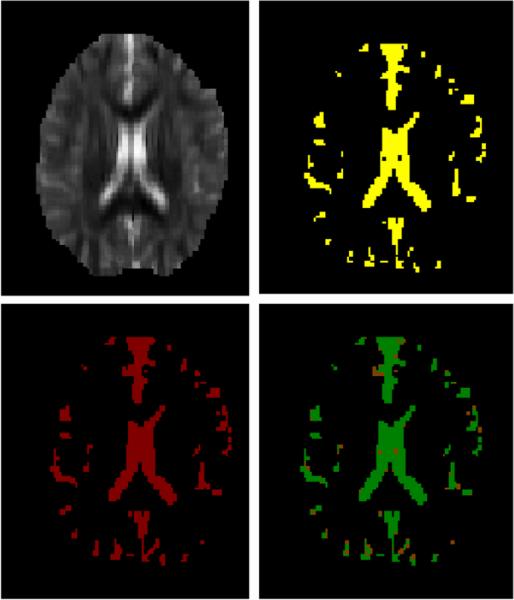
where Ti is segmentation map by the graph cuts and Tj is manual segmentation map. V (·) is the volume of the tissue map. Table I shows the results of segmentation. The volume overlap from the graph cuts was roughly 0.90 in case of WM, 0.77 for GM and 0.88 for CSF. These values are slightly higher than the results using the mFAST (FSL -Oxford) segmentation algorithm in table I. A segmentation using a simple binary thresholding method (CSF: λ3 > 0.0009mm2/s; WM: FA>0.2) was also compared. Although the volume overlaps were similar for thresholding and the graph cuts, the sensitivity of the WM segmentation was higher and the WM volumes had fewer ’holes’ for the graph cuts. These volume overlaps are also relatively higher compared with 0.67, 0.65 and 0.43 respectively reported in [16] and 0.68, 0.64, and 0.63 respectively reported in [17]. We note, however, that direct comparison of these values may not be meaningful since the segmentation frameworks (as well as the data) are different. Nonetheless, because the final goal of segmentation is to match to gold standard as well as possible, the graph-cuts method shows superior performance in terms of volume overlap for each WM, GM and CSF. Example segmentations shown in Figs. 2–4 demonstrate generally good correspondence between the manual and graph cuts segmentations for each case.
TABLE I.
A table of the accuracy of the segmentation results using an expert segmentation as gold standard(sensitivity=true positive rate, specificity=true negative rate).
| Volume overlap | Sensitivity | Specificity | ||
|---|---|---|---|---|
| WM | GC | 0.90 (±0.03) | 0.94 (±0.03) | 0.92 (±0.04) |
| FAST | 0.87 (±0.03) | 0.84 (±0.05) | 0.95 (±0.03) | |
| Thresholding | 0.90 (±0.03) | 0.86 (±0.05) | 0.97 (±0.01) | |
| GM | GC | 0.77 (±0.06) | 0.73 (±0.12) | 0.93 (±0.03) |
| FAST | 0.77 (±0.06) | 0.85 (±0.06) | 0.84 (±0.06) | |
| Thresholding | 0.80 (±0.06) | 0.93 (±0.04) | 0.82 (±0.06) | |
| CSF | GC | 0.88 (±0.09) | 0.93 (±0.08) | 0.98 (±0.03) |
| FAST | 0.71 (±0.09) | 0.66 (±0.15) | 0.97 (±0.02) | |
| Thresholding | 0.71 (±0.10) | 0.56 (±0.1l) | 0.99 (±0.00) | |
Fig. 2.
An example of WM segmentation (top left: FA map, top right: graph cuts segmentation, bottom left: manual segmentation, and bottom right: volume overlap (green/0.95).
Fig. 4.
An example of CSF segmentation (top left: λ3 map, top right: graph cuts segmentation, bottom left: manual segmentation, and bottom right: volume overlap (green/0.95).
IV. DISCUSSIONS AND FUTURE WORK
We have evaluated 3D automatic segmentation using a graph cuts for DTI image segmentation. The results showed good performance in terms of volume overlap, up to 0.90 for WM, 0.77 for GM, and 0.88 for CSF segmentation compared with previous works with the same data set [22], simple thresholding method, and segmentation with other algorithms with different data sets [16], [17]. The lower classification accuracy in [16] and [17] might come from misalignment between the DTI images and spoiled gradient recalled (SPGR) images, due to geometric distortion in DTI imaging, the partial volume effect, the reslicing and interpolation of DTI data, and the co-registration error [17]. We note that such misalignment can impact segmentation performance seriously when voxel-based comparison like volume overlap is performed. We believe that these highly volume overlapped WM segmentations can be used for further application like changes in the brain tissue microstructure from disease, injury, development and/or aging [12], [13], [14], [15].
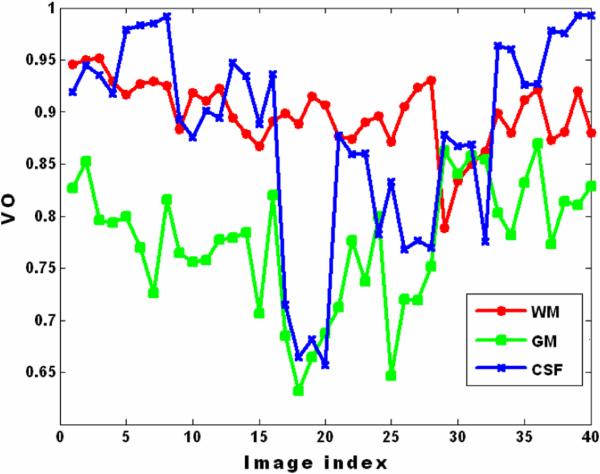
CSF segmentation is simpler because of the large contrast in the diffusivity maps - particularly λ3 and MD maps. Our performance in WM segmentation is better in part because we were seeking to target this tissue more than GM. Also, the WM is actually more contiguous so the graph cuts should work better in extended tissue regions. Our experiments highlight some limitations of the methods. Primarily, the performance of segmentation by the graph cuts depends on the selection of parameters in the energy function equation. As Fig. 5 shows, the volume overlap in CSF and GM segmentation has relatively high variation. If we can adapt the parameters according to each image, we may be able to obtain improved segmentations. A natural extension of this work (in terms of a comprehensive experimental analysis) would be to use multiple DTI images such as FA and λ3 images which can be fed into graph cuts at the same time to improve the segmentation performance. Our preliminary investigation did not show any significant empirical benefit of using multispectral methods for segmentation.
Fig. 5.
A plot of the volume overlap of each WM, GM and CSF.
V. CONCLUSIONS
Brain tissue segmentation based on DTI data set was performed on 40 images from 10 subjects using an automatic 3D graph cuts algorithm. There were two steps for segmentation. First, CSF/non-CSF regions were segmented using λ3 map, and CSF masked FA map was used for WM/non-WM segmentation. Our results showed promising high measures of volume overlap for WM/GM/CSF segmentation.
Fig. 3.
An example of GM segmentation (top left: λ3 map, top right: graph cuts segmentation, bottom left: manual segmentation, and bottom right: volume overlap (green/0.85).
ACKNOWLEDGMENTS
This work was supported by NIH Mental Retardation/Developmental Disabilities Research Center (MRDDRC Waisman Center), NIMH 62015 (ALA), NIMH MH080826 (JEL) and NICHD HD35476 (Univ. of Utah CPEA), Wisconsin Comprehensive Memory Program and through a UW ICTR CTSA grant 1UL1 RR025011. N. Adluru is supported by the UW-CIBM program and Morgridge Institute for Research at the UW-Madison.
REFERENCES
- 1.Cercignani M, Inglese M, Siger-Zajdel M, et al. Segmenting brain white matter, gray matter and cerebro-spinal fluid using diffusion tensor-MRI derived indices. Magnetic Resonance Imaging. 2001;19(9):1167–1172. doi: 10.1016/s0730-725x(01)00457-x. [DOI] [PubMed] [Google Scholar]
- 2.Clarke LP, Velthuizena RP, Camachoa MA, et al. MRI segmentation: methods and applications. Magnetic Resonance Imaging. 1995;13(3):343–368. doi: 10.1016/0730-725x(94)00124-l. [DOI] [PubMed] [Google Scholar]
- 3.Withey D, Koles Z. Medical image segmentation: Methods and software. NFSI & ICFBI. 2007:140–143. [Google Scholar]
- 4.Boykov Y, Veksler O, Zabih R. Efficient approximate energy minimization via graph cuts. IEEE Trans. on Pattern Analysis and Machine Intelligence. 2001 Nov;20(12):1222–1239. [Google Scholar]
- 5.Kolmogorov V, Zabih R. What energy functions can be minimized via graph cuts? IEEE Trans. on Pattern Analysis and Machine Intelligence. 2004 Feb;26(2):147–159. doi: 10.1109/TPAMI.2004.1262177. [DOI] [PubMed] [Google Scholar]
- 6.Boykov Y, Kolmogorov V. An experimental comparison of mincut/max-flow algorithms for energy minimization in vision. IEEE Trans. on Pattern Analysis and Machine Intelligence. 2004 Sep;26(9):1124–1137. doi: 10.1109/TPAMI.2004.60. [DOI] [PubMed] [Google Scholar]
- 7.Mori S, Zhang J. Principles of diffusion tensor imaging and its applications to basic neuroscience research. Neuron. 2006 Sep;51(5):527–539. doi: 10.1016/j.neuron.2006.08.012. [DOI] [PubMed] [Google Scholar]
- 8.Bihan DL, Mangin J-F, Poupon C, et al. Diffusion tensor imaging: Concepts and applications. Journal of Magnetic Resonance Imaging. 2001 Mar;13(4):534–546. doi: 10.1002/jmri.1076. [DOI] [PubMed] [Google Scholar]
- 9.Pierpaoli C, Jezzard P, Basser PJ, Barnett A, Chiro GD. Diffusion tensor MR imaging of the human brain. Radiology. 1996;201:637–648. doi: 10.1148/radiology.201.3.8939209. [DOI] [PubMed] [Google Scholar]
- 10.Bammer R. Basic principles of diffusion-weighted imaging. European Journal of Radiology. 2003 Apr;45(3):169–184. doi: 10.1016/s0720-048x(02)00303-0. [DOI] [PubMed] [Google Scholar]
- 11.Sundgren PC, Dong Q, Gómez-Hassan D, et al. Diffusion tensor imaging of the brain: review of clinical applications. Neuroradiology. 2004 Apr;46:339–350. doi: 10.1007/s00234-003-1114-x. [DOI] [PubMed] [Google Scholar]
- 12.Alexander AL, Lee JE, Lazar M, et al. Diffusion tensor imaging of the corpus callosum in autism. NeuroImage. 2007;34:61–73. doi: 10.1016/j.neuroimage.2006.08.032. [DOI] [PubMed] [Google Scholar]
- 13.Bonekamp D, Nagae LM, Degaonkar M, et al. Diffusion tensor imaging in children and adolescents: Reproducibility, hemispheric, and age-related differences. NeuroImage. 2007 Jan;34(2):733–742. doi: 10.1016/j.neuroimage.2006.09.020. [DOI] [PMC free article] [PubMed] [Google Scholar]
- 14.Foong J, et al. Investigating regional white matter in schizophrenia using diffusion tensor imaging. Neuroreport. 2002;13:333–336. doi: 10.1097/00001756-200203040-00017. [DOI] [PubMed] [Google Scholar]
- 15.Xie S, et al. Evaluation of bilateral cingulum with tractography in patients with alzheimer's disease. Neuroreport. 2005;16:1275–1278. doi: 10.1097/01.wnr.0000174061.41897.ee. [DOI] [PubMed] [Google Scholar]
- 16.Liu T, Young G, Huang L, et al. 76-space analysis of grey matter diffusivity: methods and applications. NeuroImage. 2006 May;31(1):51–65. doi: 10.1016/j.neuroimage.2005.11.041. [DOI] [PubMed] [Google Scholar]
- 17.Liu T, Li H, Wong K, et al. Brain tissue segmentation based on DTI data. NeuroImage. 2007;38(1):114–123. doi: 10.1016/j.neuroimage.2007.07.002. [DOI] [PMC free article] [PubMed] [Google Scholar]
- 18.Peng B, Veksler O. Parameter selection for graph cut based image segmentation. British Machine Vision Conference. 2008 [Google Scholar]
- 19.Hower D, Singh V, Johnson SC. Label set perturbation for mrf based neuroimaging segmentation. International Conference on Computer Vision. 2009 [Google Scholar]
- 20.Lempitsky V, Blake A, Rother C. Image segmentation by branch-and-mincut. European Conference on Computer Vision. 2008 [Google Scholar]
- 21.Oakes T. The spamalize package. [Online] 2009 Available: http://brainimaging.waisman.wisc.edu/~oakes/spam/spam frames.htm.
- 22.Zakszewski E, Lee JE, Han D, et al. Comparison of brain segmentation results using automated fsl-fast with dti channel inputs. Proceedings 17th Annual Meeting of ISMRM; 2009. [Google Scholar]


