

Abstract
GATA-1low/low mice have an increase in megakaryocytes (MKs) and trabecular bone. The latter is thought to result from MKs directly stimulating osteoblastic bone formation while simultaneously inhibiting osteoclastogenesis. Osteoprotegerin (OPG) is known to inhibit osteoclastogenesis and OPG−/− mice have reduced trabecular and cortical bone due to increased osteoclastogenesis. Interestingly, GATA-1low/low mice have increased OPG levels. Here we sought to determine whether GATA-1 knockdown in OPG−/− mice could rescue the observed osteoporotic bone phenotype. GATA-1low/low mice were bred with OPG−/− mice and bone phenotype assessed. GATA-1low/low X OPG−/− mice have increased cortical bone porosity, similar to OPG−/− mice. Both OPG−/− and GATA-1low/low X OPG−/− mice, were found to have increased osteoclasts localized to cortical bone, possibly producing the observed elevated porosity. Biomechanical assessment indicates that OPG−/− and GATA-1low/low X OPG−/− femurs are weaker and less stiff than C57BL/6 or GATA-1low/low femurs. Notably, GATA-1low/low X OPG−/− mice had trabecular bone parameters that were not different from C57BL/6 values, suggesting that GATA-1 deficiency can partially rescue the trabecular bone loss observed with OPG deficiency. The fact that GATA-1 deficiency appears to be able to partially rescue the trabecular, but not the cortical bone phenotype suggests that MKs can locally enhance trabecular bone volume, but that MK secreted factors cannot access cortical bone sufficiently to inhibit osteoclastogenesis or that OPG itself is required to inhibit osteoclastogenesis in cortical bone.
Keywords: GATA-1, OPG, Megakaryocytes, Trabecular bone, Cortical bone, Femoral strength, Stiffness
Introduction
A growing body of evidence suggests that MKs and/or their growth factors play a role in regulating skeletal homeostasis. Our group and others have previously demonstrated that mice with increased numbers of MKs lead to amplified osteoblast (OB) proliferation and a high bone mass phenotype (Kacena, et al., 2004, Kacena, et al., 2005, Miao, et al., 2004).
Various mouse models have been described in which MK numbers are significantly increased and a high bone mass phenotype is observed. Mice deficient in GATA-1 or NF-E2, transcription factors necessary for normal MK differentiation, exhibit a striking increase in immature abnormal MKs as well as a 3-fold increase in trabecular bone mineral density (Kacena, et al., 2004, Shivdasani, et al., 1995, Shivdasani, et al., 1997a). Mice overexpressing thrombopoietin (TPO), the major MK growth factor, exhibit a four-fold increase of MKs and an osteosclerotic bone phenotype (Villeval, et al., 1997, Yan, et al., 1996). A mouse model of platelet-type von Willebrand disease has also been shown to yield increased numbers of MKs and a high bone mass phenotype (Suva, et al., 2008). Taken together, these findings suggest a role for MKs in regulation of bone mass.
Importantly, MKs can influence regulation of bone mass by secretion of various bone matrix proteins and growth factors important in bone remodeling (Thiede, et al., 1994, Kelm, et al., 1992, Breton-Gorius, et al., 1992, Sipe, et al., 2004, Vannucchi, et al., 2002, Wickenhauser, et al., 1995). In vitro, MKs regulate osteoblastogenesis via a direct cell-to-cell contact mechanism, showing a 3–6 fold increase in OB proliferation (Kacena, et al., 2004, Miao, et al., 2004). In addition to altering OB proliferation, MKs have the ability to regulate osteoclastogenesis both directly and indirectly. In vitro, osteoclast (OC) formation is inhibited up to 10-fold by MKs or MK conditioned medium. The MK conditioned medium contained OPG, although at levels well below those used to inhibit OC development, suggesting a yet unknown soluble factor is responsible for the OC inhibitory effect (Kacena, et al., 2006, Beeton, et al., 2006). In addition to this direct inhibitory effect, MKs can also indirectly inhibit OC development by increasing expression of OPG in OBs (Bord, et al., 2005, Kacena, et al., 2006).
OPG acts as a decoy receptor for RANKL by blocking its interaction with RANK, therefore inhibiting OC development. OPG−/− mice have a striking increase in OC number and a concomitant osteoporotic bone phenotype (Simonet, et al., 1997). Here we show that introducing a GATA-1 deficiency into OPG−/− mice can rescue the low trabecular bone mass phenotype observed in OPG deficiency but not the low cortical bone mass phenotype.
Materials and Methods
Mice
For these studies 5 month-old female GATA-1low/low, C57BL/6, OPG−/−, and GATA-1low/low X OPG−/− mice were utilized. OPG−/− mice were kindly provided by Amgen. Generation and breeding of mutant mice with selective loss of MK-expressed GATA-1 were described previously (Villeval, et al., 1997, McDevitt, et al., 1997, Shivdasani, et al., 1997b). In brief, a DNAse 1-hypersensitive region (HS) was identified upstream of the GATA-1 promoter and was subsequently knocked out by insertion of a neomycin-resistant cassette. This resulted in mice with reduced levels of GATA-1 mRNA and protein (3–5 fold reduction in protein), a functional knockdown. These mice have been backcrossed more than 11 generations have been maintained on the C57BL/6 background, and were kindly provided by Dr. Stuart Orkin. GATA-1low/low and OPG−/− mice were crossed to produce GATA-1low/low X OPG−/− mice. C57BL/6 mice were obtained from Jackson Laboratories. All procedures were approved by the Institutional Animal Care and Use Committee (IACUC) of the Indiana University School of Medicine and followed NIH guidelines.
Serum OPG Measurements
Whole blood from C57BL/6 and GATA-1low/low mice was collected at euthanasia, serum separated, and serum concentration of total OPG was determined by using the mouse OPG Quantikine ELISA kit from R&D Systems according to the manufacturer’s recommendations.
Preparation of Neonatal Calvarial Cells (OB)
Neonatal murine calvarial OB cells were prepared as previously described (Horowitz, et al., 1994) from C57BL/6, GATA-1low/low, OPG−/−, and GATA-1low/low X OPG−/− mice. Our technique was a modification of the basic method described by Wong (Wong and Cohn, 1975). Briefly, calvaria were dissected from neonatal mice and then treated with EDTA in PBS for 30 min. Calvaria were then subjected to sequential collagenase digestions (200U/mL). Fractions 3–5 (digestions incubated at 37°C for 20–35, 35–50, and 50–65 min, respectively) were collected and used as the OB starting population. These cells were ~90% OB or OB precursors based on previously reported established criteria (Horowitz, et al., 1994, Simmons, et al., 1982, Jilka and Cohn, 1981). OBs were seeded at 2×10⁴ cells/ml (optimal pre-tested). OB in culture were maintained in αMEM supplemented with 10% fetal bovine serum and were further supplemented with ascorbic acid (50 mg/ml added on day 0 and day 3). β-glycerophosphate (5mM) is normally added starting on day 7 and all subsequent feedings, but for these studies cells were collected at day 7 prior to feeding.
Preparation of Fetal Liver Derived MKs
Murine MKs were prepared as previously described (Kacena, et al., 2004, Kacena, et al., 2006). In short, fetuses were dissected from pregnant WT C57BL/6, GATA-1low/low, OPG−/−, and GATA-1low/low X OPG−/− mice at E13–15. The livers were removed and single cell suspensions were made, washed, and seeded in 100 ml culture dishes, in Dulbecco modified eagle medium (DMEM) supplemented with 10% FCS and 1% murine TPO (Villeval, et al., 1997). After ~5 days, MKs were obtained by separating them from the lymphocytes and other cells using a one-step albumin gradient to obtain a 90–95% pure MK population (Drachman, et al., 1997).
Histomorphometry
The C57BL/6, GATA-1low/low, OPG−/−, and GATA-1low/low X OPG−/− mice were administered an intraperitioneal injection of the fluorochrome calcein (30mg/kg) 13 and 3 days prior to sacrifice to label actively forming bone surfaces. At sacrifice the right femur was removed and stored in 10% neutral buffered formalin (NBF) for 48 hours, and then transferred to 70% ethanol (EtOH) for storage prior to processing. Static and dynamic histomorphometric analysis of trabecular bone was completed on the distal femur as previously described (Feher, et al., 2010, Warden, et al., 2008). Tartrate resistant acid phosphatase staining was used to identify osteoclasts in the distal femur as detailed previously (Feher, et al., 2010, Warden, et al., 2008). Histological measurements were made with a semiautomatic analysis system (Bioquant OSTEO 7.20.10, Bioquant Image Analysis Co.) attached to a microscope with an ultraviolet light source (Nikon Optiphot 2 microscope, Nikon). Measurements were done on one von Kossa/McNeal’s stained (static) and one unstained (dynamic) section for each animal. All analyses were performed blinded to treatment group.
Micro-Computed Tomography (μCT)
A desktop micro-computed tomography machine (μCT, Skyscan 1172) was used to acquire images of cortical and trabecular bone parameters of the right femur as previously detailed (Feher, et al., 2010, Warden, et al., 2008, Weatherholt, et al., 2013). μCT scanning was performed on the femur sequestered for histology. In brief, images were acquired at an isotropic voxel size of 60 μm, with an energy level of 60kV, and an aluminum 0.5 mm filter. After images were acquired, data was reconstructed using NRecon reconstruction software (skyscan), and then converted to three-dimensional images. For the trabecular bone properties, a 1-mm-thick region of interest was analyzed beginning 0.5 mm distal to the growth plate. The following parameters were derived from the distal femur: trabecular bone volume fraction (BV/TV, %), trabecular number (Tb.N, 1/mm), trabecular thickness (Tb.Th, mm), and trabecular separation (Tb.Sp, mm). For cortical bone properties, a 0.5-mm tick region of interest of the femoral mid-shaft was used to calculate polar moment of inertia (Ip, mm4)
Biomechanics
Relative bone strength was determined by performing three-point bending of the left femur with a materials testing device (MTS Systems Corporation; Eden Prairie, MN) as previously detailed (Warden, et al., 2008, Feher, et al., 2010, Weatherholt, et al., 2013). In brief, at sacrifice the removed femur was wrapped in a saline-soaked guaze and stored at −20°C until evaluation. Femurs were then thawed to room temperature in a saline bath for two hours, completed μCT as detailed above, and then immediately each femur was tested in the anterior-posterior direction with a span width of 10 mm and stabilized with a static preload of 1 N before being loaded to failure in three-point bending with a crosshead speed of 10 mm/min. Force versus displacement data was gathered at 100 Hz, and the ultimate force (N), stiffness (N/mm), polar moment of inertia, ultimate stress (MPa), modulus (MPa), and toughness (MJ/m3) were obtained/derived.
Quantitative Real-Time PCR
Total RNA was isolated using Trizol Reagent as directed by the manufacturer (Invitrogen Corporation). 1ug of RNA isolated using Trizol Reagent was used to generate cDNA by reverse transcription according to the manufacturer’s instructions (First Strand cDNA Synthesis Kit for RT-PCR; Roche Applied Science). Quantitative Real-Time PCR (qRT-PCR) reactions were performed in an ABI Prism 7900HT sequence detection system (Applied Biosystems) using Power SYBR Green PCR Master Mix reagent following the manufacturer’s instructions for relative quantification (Applied Biosystems).
For each gene analyzed, a calibration curve was performed and all the oligonucleotides were tested to ensure specificity and sensitivity. For each sample, relative mRNA expression of the target genes were derived using the 2−ΔΔCT calculation. GAPDH was used as an internal control. For each target gene, the corresponding WT sample was used as the calibrator for relative expression. Primer pair sequences used are:
| GATA-1 forward primer: | 5′ CAGCATCTTCTTCCACTTCC |
| GATA-1 reverse primer: | 5′ AGGCATAAGATGGCTGACAG |
| OPG forward primer: | 5′ CCGAGTGTGTGAGTGTGAGG |
| OPG reverse primer: | 5′ CCAGCTTGCACCACTCCAA |
| GAPDH forward primer: | 5′ CGTGGGGCTGCCCAGAACAT |
| GAPDH reverse primer: | 5′ TCTCCAGGCGGCACGTCAGA |
Statistics
Unless otherwise stated, all data are presented as the Mean ± 1 SD. All cell experiments were performed at least three times with duplicate or triplicate samples in each experiment. For in vivo studies, the sample size is presented in the corresponding figure legends. Student’s t-test were performed when only two groups were compared. As male and female mouse bones exhibited virtually identical properties, for ease of reporting and to increase the sample size, data from male and female mice were combined for all of the in vivo data analysis. One-way factorial analyses of variances with LSD were used to make multiple group comparisons. All analyses were performed with the Statistical Package for Social Sciences (IBM SPSS 19; SPSS Inc., Armonk, NY) software and were two tailed with a level of significance set at 0.05.
Results
Generation and Validation of Mice deficient in OPG and GATA-1
GATA-1low/low and OPG−/− mice, both on C57BL/6 background, were crossed to generate mice with GATA-1low/low X OPG−/−. Generation was performed by crossing over 11 generations. Genotyping was used to confirm GATA-1low/low X OPG−/− mice. These mice exhibited normal body weight, litter size, fertility, and normal mendellian distribution compared to controls (data not shown). RT-PCR of isolated OBs and MKs confirms GATA-1 and OPG mRNA expression levels, summarized in Figure 1. Specifically, as GATA-1 is expressed in MK lineage cells but not OB lineage cells (Kacena, et al., 2004), we examined GATA-1 expression in MKs generated from the 4 types of mice. As would be expected, GATA-1low/low and GATA-1low/low X OPG−/− mice had low levels of GATA-1 expression compared to the levels of GATA-1 observed in C57BL/6 and OPG−/− mice. On the other hand, OB lineage cells are known to express OPG, therefore we examined OPG expression in OBs generated from the 4 types of mice. As expected, OPG was not detected with 35 cycles in OBs derived from mice lacking OPG (OPG−/− and GATA-1low/low X OPG−/− mice).
Figure 1.
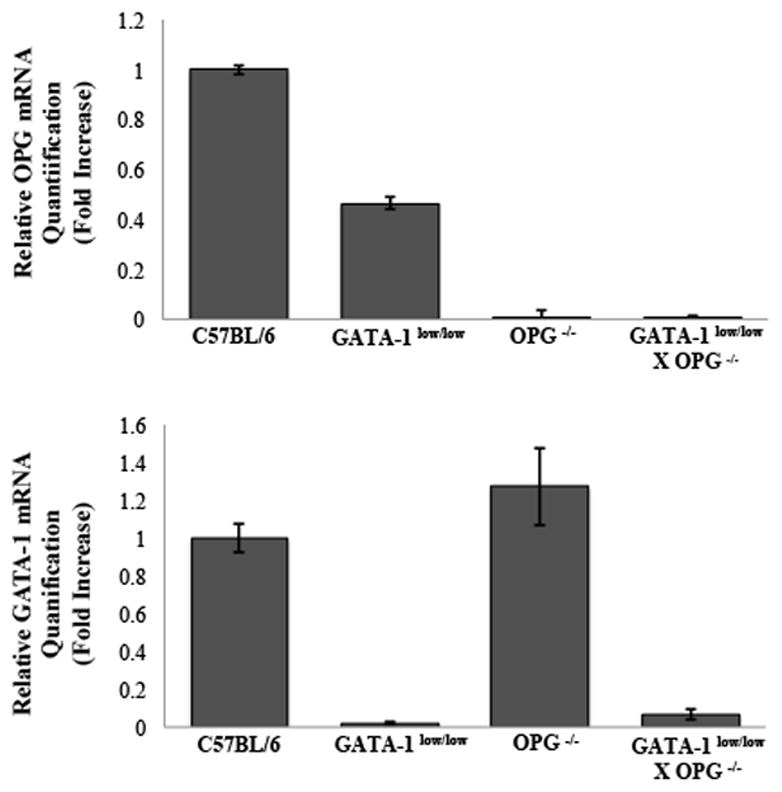
mRNA expression in C57BL/6, GATA-1low/low, OPG−/−, and GATAlow/low X OPG−/− MKs (A) and OBs (B). MKs were obtained by separating them from other cells after culturing for 5 days with TPO stimulation. OBs were cultured under osteogenic conditions as detailed above for 7 days. Real-time PCR was used to determine mRNA expression of GATA-1 and OPG, respectively. GAPDH was used to normalize the amount of the investigated transcript. Expression levels for both GATA-1 in MKs and and OPG in OBs confirms mouse genotyping.
Trabecular Bone Properties in GATA-1 low/low X OPG−/− and Control Mice
As OPG−/− mice have a low trabecular bone phenotype (Simonet, et al., 1997) and GATA-1low/low mice have an increased trabecular bone phenotype (Kacena, et al., 2004, Kacena, et al., 2013), we hypothesized that GATA-1 deficiency may be able to rescue the low trabecular bone mass phenotype observed in OPG−/− mice. This hypothesis was further supported by data shown in Figure 2, whereby serum OPG levels are markedly elevated in GATA-1low/low mice (2908pg/ml±322pg/ml) compared to their littermate C57BL/6 control mice (2048pg/ml±208pg/ml). Therefore, to test this possibility we used microCT and histomorphopemtric analyses and examined the femurs from all 4 groups of mice, Table 1 summarizes the findings.
Figure 2.

OPG serum concentration was measured in 5-month-old, GATA-1low/low and littermate, C57BL/6 control mice. OPG levels are significantly increased in GATA-1low/low mice compared to WT littermate controls (n=5/group,*p=0.001).
Table 1.
Trabecular Bone Properties in GATA-1low/low X OPG−/− and C57BL/6 Mice
| Micro CT | Histology | ||||||||
|---|---|---|---|---|---|---|---|---|---|
|
| |||||||||
| Mice | n | BV/TV (%) | BS/TV (1/mm) | Tb.Th (mm) | Tb.N (1/mm) | Tb.Sp (mm) | BV/TV (%) | N.Ob/T.Ar | N.Oc/T.Ar |
| C57BL/6 | 24 | 3.9±0.3a,b | 3.8±0.2a,b | 0.047±0.002b | 0.81±0.04a,b | 0.303±0.004b,c | 3.6±0.3a | 33±4a,b | 24±2a,b |
| GATA-1 low/low | 9 | 10.5±2.6a,d,e | 7.9±1.8a,d,e | 0.049±0.003d | 2.06±0.50a,d,e | 0.308±0.025d,e | 14.1±2.7a,d,e | 86±11a,d,e | 53±5a,d,e |
| OPG−/− | 6 | 0.4±0.2b,d | 2.1±0.3b,d | 0.033±0.005b,d,f | 0.13±0.06b,d | 0.437±0.011b,d,f | 0.8±0.4d | 8±4b,d | 8±4b,d |
| GATA-1 low/low X OPGA | 12 | 2.9±1.0e | 2.5±0.8e | 0.047±0.002f | 0.58±0.19e | 0.389±0.024c,e,f | 1.1±0.4e | 12±4e | 12±4e |
Abbreviations: BV/TV, bone volume/total volume; BS/TV, bone surface/total volume; Tb.Th, trabecular thickness; Tb.N, trabecular number; Tb.Sp, trabecular spacing; N.Ob/T.Ar, number of osteoblasts/tissue area; N.Oc/T.Ar, number of osteoclasts/tissue area.
Results are presented as mean ± SEM
GATA-1low/low, p < 0.05 compared with C57BL/6
OPG−/−, p < 0.05 compared with C57BL/6
GATA-1low/low x OPG−/−, p < 0.05 compared with C57BL/6
OPG−/−, p < 0.05 compared with GATA-1low/low
GATA-1low/low X OPG−/− p < 0.05 compared with GATA-1low/low
GATA-1low/low X OPG−/−, p < 0.05 compared with OPG−/−
First, we confirmed our previous reports (Kacena, et al., 2004, Kacena, et al., 2013) and demonstrated using microCT the distal femur of GATA-1low/low mice to have significantly more bone volume (BV/TV: 10.5%±2.6%), increased bone surfaces (BS/TV: 7.9/mm±1.8/mm), and increased numbers of trabeculae (Tb.N: 2.06/mm±0.50/mm) compared to C57BL/6 mice (BV/TV: 3.9%±0.3%, BS/TV: 3.8/mm±0.2/mm, and Tb.N: 0.81/mm±0.04/mm, respectively). Consistent with the microCT findings, histomorphometric analyses also confirmed our previous reports (Kacena, et al., 2004, Kacena, et al., 2013) that bone volume (BV/TV: 14.1%±2.7%) was significantly elevated in the distal femurs of GATA-1low/low mice due to a high bone turnover state with a significant 2.6 fold increase in number of OBs (N.Ob/T.Ar: 86±11) and a 2.2 fold increase in number of OCs (N.Oc/T.Ar: 53±5) compared to that measured in C57BL/6 mice (BV/TV: 3.6%±0.3%, N.Ob/T.Ar: 33±4, and N.Oc/T.Ar: 24±2, respectively). Figure 3, depicts representative TRAP stained histological sections of the distal femur for all groups of mice.
Figure 3.

Tartrate resistant acid phosphatase (TRAP) staining of longitudinal sections taken from the distal femur of 5 month-old, female C57BL/6 (A), GATA-1low/low (B), OPG−/− (C) and GATAlow/low X OPG−/− (D) mice. Examination of the cortical bone from these mice shows that numerous OCs are present in the cortical bone of OPG−/− and GATA-low/low X OPG−/− mice. No OCs were observed in the cortical bone of C57BL/6 (A) or GATA-1low/low mice. Original magnification, 20X.
Second, we confirmed previous reports regarding the low bone mass phenotype observed in OPG−/− mice (Simonet, et al., 1997). With respect to microCT analyses, as shown in Table 1, the distal femur of OPG−/− mice have significantly reduced bone volume (BV/TV: 0.4%±0.2%), bone surfaces (BS/TV: 2.1/mm±0.3/mm), and trabeculae number (Tb.N: 0.13/mm±0.06/mm) than do C57BL/6 mice (3.9%±0.3%, 3.8/mm±0.2/mm, and 0.81/mm±0.04/mm, respectively). With regard to histomorphometric analyses, as displayed in Table 1, and shown in Figure 3, OPG−/− femurs have significantly reduced bone volume (BV/TV: 0.8%±0.4%) with reduced numbers of both OBs (8±4) and OCs (8±4) compared to C57BL/6 mice (3.6%±0.3%, 33±4, and 24±2, respectively).
Next, we examined the contribution of GATA-1 knockdown in OPG−/− mice (GATA-1low/low X OPG−/−) on trabecular bone phenotype. The data are summarized in Table 1. As assessed by microCT, although GATA-1low/low mice had significantly elevated bone volume (BV/TV: 10.5%±2.6%), increased bone surfaces (BS/TV: 7.9/mm±1.8/mm), and increased numbers of trabeculae (Tb.N: 2.06/mm±0.50/mm) compared to GATA-1low/low X OPG−/− (BV/TV: 2.9%±1.0%, BS/TV: 2.5/mm±0.8/mm, and Tb.N: 0.58/mm±0.19/mm, respectively), OPG−/− (BV/TV:0.4%±0.2%, BS/TV: 2.1/mm±0.3/mm, and Tb.N: 0.13/mm±0.06/mm, respectively), and C57BL/6 (BV/TV:3.9%±0.3%, BS/TV: 3.8/mm±0.2/mm, and Tb.N: 0.81/mm±0.04/mm, respectively) mice; significant differences in bone volume, bone surface, and trabecular number were not found between GATA-1low/low X OPG−/− and OPG−/− or C57BL/6 mice.
However, the values observed in GATA-1low/low X OPG−/− femurs were closer in value to that observed in C57BL/6 mice as compared to OPG−/− femurs, suggesting a partial rescue of the trabecular phenotype. Indeed, significant differences were observed between C57BL/6 and OPG−/− femurs, whereas GATA-1low/low X OPG−/− femurs were not statistically different from C57BL/6 mice. Similar trends were observed when femurs were examined histomorphometrically, including that changes in OB and OC numbers. Interestingly, both OB and OC numbers while dramatically reduced 2–3 fold with OPG deficiency (OPG−/− and GATA-1low/low X OPG−/− mice) compared to C57BL/6 mice, GATA-1low/low X OPG−/− mice had 50% more OBs and OCs than did OPG−/− mice, again suggesting a partial rescue in trabecular bone phenotype. Of interest, TRAP staining (see Figure 3) demonstrated that numerous OCs were localized to the cortical bone, which was not observed in C57BL/6 or GATA-1low/low mice. This latter observations suggests difference is cortical bone properties.
Cortical Bone Properties in GATA-1 low/low X OPG−/− and Control Mice
Cortical bone properties derived histologically were examined and are detailed in Table 2. GATA-1low/low X OPG−/− mice have a significantly larger cross sectional area (2.15μm2±0.11μm2) compared to GATA-1low/low (1.46μm2±0.05μm2), OPG−/− (1.56μm2±0.16μm2), and C57BL/6 control (1.64μm2±0.01μm2) mice. OPG−/− mice have a significantly lower bone area (0.57μm2±0.04μm2) compared to GATA-1low/low (0.85μm2±0.35μm2) and C57BL/6 mice (0.76μm2±0.07μm2). Bone area was significantly elevated (0.80μm2±0.03μm2) in GATA-1low/low X OPG−/− mice compared to OPG−/− mice, and comparable to C57BL/6 and GATA-1low/low mice. Porosity was increased significantly in OPG−/− mice (8.24%±1.61%) compared to GATA-1low/low (0.23%±0.09%) and C57BL6 mice (0.13%±0.03%). Additionally, the cortical porosity in GATA-1low/low X OPG−/− mice (14.80%±1.73%) was significantly elevated (1.8-fold higher) compared to that observed in the OPG−/− mice (8.24%±1.61%), and was also significantly higher than that measured in both the GATA-1low/low and C57BL/6 mice. These results are illustrated by the microCT images of each respective genotype shown in Figure 4. Increased porosity in GATA-1low/low X OPG−/− cortical bone is also evident in calcein labeled sections, shown in Figure 5. As alterations in cortical bone were observed, it is likely that biomechanical and/or biomaterial properties would also be altered.
Table 2.
Cortical Histomorphometric Bone Properties in GATA-1low/low X OPG−/− and C57BL/6 Mice
| Mice | n | Cross Sectional Area (μm2) | Bone Area (μm2) | Porosity (%) |
|---|---|---|---|---|
| C57BL/6 | 24 | 1.64±0.01c | 0.76±0.07b | 0.13±0.03b,c |
| GATA-1low/low | 9 | 1.46±0.05e | 0.85±0.35d | 0.23±0.09d,e |
| OPG−/− | 6 | 1.56±0.16f | 0.57±0.04b,d,f | 8.24±1.61b,d,f |
| GATA-1low/low X OPG−/− | 12 | 2.15±0.11c,e,f | 0.80±0.03f | 14.80±1.73c,e,f |
Results are presented as mean ± SEM.
GATA-1low/low, p < 0.05 compared with C57BL/6
OPG−/−, p < 0.05 compared with C57BL/6
GATA-1low/low x OPG−/−, p < 0.05 compared with C57BL/6
OPG−/−, p < 0.05 compared with GATA-1low/low
GATA-1low/low X OPG−/−, p < 0.05 compared with GATA-1low/low
GATA-1low/low X OPG−/−, p < 0.05 compared with OPG−/−
Figure 4.

MicroCT imaging of 5 month-old, female C57BL/6 (A), GATA-1low/low (B), OPG−/− (C), and GATA-1low/low X OPG−/− (D) mice. These images illustrate increased porosity observed in OPG deficient mice, which remained in mice deficient in both GATA-1 and OPG.
Figure 5.

5 month-old, female C57BL/6 (A), GATA-1low/low (B), OPG−/− (C), and GATA-1low/low X OPG−/− (D) mice were injected with the fluorochrome calcein 13 and 3 days prior to euthanasia to calculate dynamic histological indicies of bone formation. Cross-sections were obtained at the femur midshaft. These images depict increased bone formation on the endocortical surface in GATA-1low/low (B), OPG−/− (C), and GATA-1low/low X OPG−/− (D) mice as compared to C57BL/6 control mice (A). The increased cortical porosity in OPG−/− and GATA-1low/low X OPG−/− is also clearly evident by the excessive amount of calcein found through the cortical bone. Original magnification, 5X.
Biomechanical and Biomaterial Properties in GATA-1 low/low X OPG−/− and Control Mice
Table 3 summarizes the bone biomechanical and material properties in GATA-1low/low X OPG−/−, OPG−/−, GATA-1low/low and C57BL/6 femurs. Of all of the properties measured, only the polar moment of inertia was significantly different between GATA-1low/low X OPG−/− and OPG−/− femurs (elevated in GATA-1low/low X OPG−/−mice). This is consistent with the increase in cross sectional area observed in GATA-1low/low X OPG−/− mice (Table 2). However, GATA-1low/low X OPG−/− and OPG−/− femurs exhibited significant reductions in stiffness, ultimate failure, load at peak, modulus, and energy to ultimate failure compared to C57BL/6 and GATA-1low/low femurs. Specifically, GATA-1low/low X OPG−/− femurs showed a significant decrease in stiffness (41.1N/mm±3.7N/mm) compared to C57BL/6 (129.7N/mm±3.6N/mm) and GATA-1low/low (135.3N/mm±6.7N/mm) femurs. Additionally, GATA-1low/low X OPG−/− femurs showed a decreased load at peak (6.6N±1.1N) compared to C57BL/6 (22.5N±0.1N) and GATA-1low/low (25.7N±0.7N) femurs. Assessment of biomechanical properties indicates that OPG−/− and GATA-1low/low X OPG−/− femurs are weaker and less stiff, as demonstrated by low stiffness, ultimate failure, and load at peak, compared to the corresponding biomechanical properties of C57BL/6 or GATA-1low/low femurs.
Table 3.
Mechanical and Biomaterial Properties in GATA-1low/low X OPG−/− and C57BL/6 Mice
| Mice | n | Stiffness (N/mm) | Polar Moment of Inertia (mm4) | Ultimate Failure (MPa) | Load at Peak (N) | Modulus (GPa) | Toughness (MJ/m3) | Energy to Ultimate Force (mJ) |
|---|---|---|---|---|---|---|---|---|
| C57BL/6 | 24 | 129.7±3.6b,c | 0.34±0.07a,b,c | 244±5b,c | 22.5±0.1a,b,c | 47±1a,b,c | 3.3±0.1c | 9.9±0.3a,b,c |
| GATA-1low/low | 9 | 135.3±6.7e | 0.27±0.02a,e | 269±45d,e | 25.7±0.7a,d,e | 58±3a,d,e | 2.9±0.2 | 7.2±0.6a,d |
| OPG−/− | 6 | 21.7±5.3b,d | 0.25±0.02b,f | 106±26b,d | 9.6±0.7b,d | 11±3b,d | 2.7±0.8 | 4.6±1.2b,d |
| GATA-1low/low X OPG−/− | 12 | 41.1±3.7c,e | 0.46±0.06c,e,f | 90±8c,e | 6.6±1.1c,e | 13±2c,e | 1.9±0.3c | 6.2±0.6c |
Results are presented as mean ± SEM.
GATA-1low/low, p < 0.05 compared with C57BL/6
OPG X OPG−/−, p < 0.05 compared with C57BL/6
GATA-1low/low x OPG−/−, p < 0.05 compared with C57BL/6
OPG−/−, p < 0.05 compared with GATA-1low/low
GATA-1low/low X OPG−/−, p < 0.05 compared with GATA-1low/,ow
GATA-1low/low X OPG−/−, p < 0.05 compared with OPG−/−
Discussion
GATA-1low/low mice exhibit a striking increase in trabecular bone and increased levels of immature abnormal MKs (Kacena, et al., 2004, Shivdasani, et al., 1995, Shivdasani, et al., 1997a). MKs have been shown to stimulate OB proliferation via a direct cell-to-cell contact mechanism (Kacena, et al., 2004, Kacena, et al., 2005, Miao, et al., 2004) and are also able to stimulate OBs to increase secretion of OPG to inhibit OCs (Bord, et al., 2005, Kacena, et al., 2006). Additionally, MKs and MK conditioned media have been shown to decrease OC formation by up to 10-fold due to a yet unidentified secreted inhibitory molecule. OPG−/− mice exhibit a drastic increase in number of OCs, which leads to a severe osteoporotic bone phenotype (Kacena, et al., 2006, Beeton, et al., 2006). A GATA-1 knockdown was crossed into OPG−/− mice (GATA-1low/low X OPG−/−) to determine whether the osteoporotic bone phenotype observed in OPG−/− mice could be reversed through a MK-mediated mechanism.
As detailed in Table 2 and shown in Figures 4 and 5, GATA-1low/low X OPG−/− mouse cortical bone resembled that seen in OPG−/− mice. The increased porosity observed in OPG deficient mice remained in mice deficient in both OPG and GATA-1. Although the cortical bone phenotype was not rescued in GATA-1low/low X OPG−/− mice, changes in trabecular bone properties were observed in femurs of mice deficient in both OPG and GATA-1. GATA-1low/low X OPG−/− femurs showed significant increases in trabecular thickness along with an expected decrease in trabecular separation, detailed in Table 2. GATA-1low/low mice have significantly greater trabecular bone volume than C57BL/6, OPG−/−, and GATA-1low/low x OPG−/− mice. C57BL/6 and GATA-1low/low x OPG−/− mice have similar amounts of trabecular bone volume, with OPG−/− mice having the least amount of trabecular bone volume. These results indicate a partial rescue of trabecular, but not cortical bone in mice deficient in both OPG and GATA-1.
Interestingly, mice deficient in OPG (OPG−/− and GATA-1low/low X OPG−/−) were found to have OCs localized to the cortical bone of femurs. OCs were not found in cortical bone of GATA-1low/low or C57BL/6 femurs (Figure 2). Increased cortical porosity observed through histomorphometric analyses in mice lacking OPG is likely due to the increased number of OCs in cortical bone.
With regard to biomechanical properties, detailed in Table 3, femurs from GATA-1low/low X OPG−/− were weaker and less stiff compared to C57BL/6 mice despite having an increase in bone size. Given that cortical bone is a primary contributor to biomechanical bone properties and as GATA-1 deficiency was unable to resolve the increase in porosity observed in GATA-1low/low X OPG−/− mice, it was expected that the femurs of GATA-1low/low x OPG−/− and OPG−/− would not be as stiff nor strong as those measured in C57BL/6 and GATA-1low/low mice.
In conclusion, we have shown that GATA-1 deficiency is able to partially rescue trabecular bone but not cortical bone in OPG−/− mice. While it remains unclear as to why trabecular bone is partially rescued while cortical bone is not, we speculate that MKs have more opportunity for direct interactions in trabecular bone. Additionally, MK secreted factors may not be able to efficiently produce the expected inhibition of osteoclasts in cortical bone due to physical barrier. Alternatively, as GATA-1low/low mice have increased levels of OPG, it is possible that the rescue of the cortical phenotype is dependent on OPG. More work remains to understand how megakaryocyte-mediated interactions regulate the repair of trabecular and cortical bone.
Acknowledgments
Contract grant sponsor: NIH/NIAMS; Contract grant number: R01 AR47342
Contract grant sponsor: NIH/NIAMS; Contract grant number: R03 AR055269
Contract grant sponsor: NIH/NIAMS; Contract grant number: R01 AR060332
Contract grant sponsor: NIH/NIAMS; Contract grant number: P01 AR46032
We wish to thank Amgen for providing us with the OPG deficient mice and Dr. Stuart Orkin for providing us with the GATA-1 deficient mice. This work was supported by the Indiana - Clinical and Translational Sciences Institute funded, in part by NIH grants RR025760 and RR025761 (MAK), by NIH/NIAMS grant R01 AR47342 (MCH), R03 AR055269 (MAK), and R01 AR060332 (MAK), and by a Pilot and Feasibility Award from the Yale Core Center for Musculoskeletal Disorders AR46032 (MAK).
Footnotes
The authors have no conflicts of interest to disclose.
The content in this manuscript is solely the responsibility of the authors and does not necessarily represent the official views of the NIH.
References
- Beeton CA, Bord S, Ireland D, Compston JE. Osteoclast formation and bone resorption are inhibited by megakaryocytes. Bone. 2006;39:985–990. doi: 10.1016/j.bone.2006.06.004. [DOI] [PubMed] [Google Scholar]
- Bord S, Frith E, Ireland DC, Scott MA, Craig JI, Compston JE. Megakaryocytes modulate osteoblast synthesis of type-l collagen, osteoprotegerin, and RANKL. Bone. 2005;36:812–819. doi: 10.1016/j.bone.2004.12.006. [DOI] [PubMed] [Google Scholar]
- Breton-Gorius J, Clezardin P, Guichard J, Debili N, Malaval L, Vainchenker W, Cramer EM, Delmas PD. Localization of platelet osteonectin at the internal face of the alpha-granule membranes in platelets and megakaryocytes. Blood. 1992;79:936–941. [PubMed] [Google Scholar]
- Drachman JG, Sabath DF, Fox NE, Kaushansky K. Thrombopoietin signal transduction in purified murine megakaryocytes. Blood. 1997;89:483–492. [PubMed] [Google Scholar]
- Feher A, Koivunemi A, Koivunemi M, Fuchs RK, Burr DB, Phipps RJ, Reinwald S, Allen MR. Bisphosphonates do not inhibit periosteal bone formation in estrogen deficient animals and allow enhanced bone modeling in response to mechanical loading. Bone. 2010;46:203–207. doi: 10.1016/j.bone.2009.10.023. [DOI] [PubMed] [Google Scholar]
- Horowitz MC, Fields A, DeMeo D, Qian HY, Bothwell AL, Trepman E. Expression and regulation of Ly-6 differentiation antigens by murine osteoblasts. Endocrinology. 1994;135:1032–1043. doi: 10.1210/endo.135.3.7520861. [DOI] [PubMed] [Google Scholar]
- Jilka RL, Cohn DV. Role of phosphodiesterase in the parathormone-stimulated adenosine 3′,5′-monophosphate response in bone cell populations enriched in osteoclasts and osteoblasts. Endocrinology. 1981;109:743–747. doi: 10.1210/endo-109-3-743. [DOI] [PubMed] [Google Scholar]
- Kacena MA, Shivdasani RA, Wilson K, Xi Y, Troiano N, Nazarian A, Gundberg CM, Bouxsein ML, Lorenzo JA, Horowitz MC. Megakaryocyte-osteoblast interaction revealed in mice deficient in transcription factors GATA-1 and NF-E2. J Bone Miner Res. 2004;19:652–660. doi: 10.1359/JBMR.0301254. [DOI] [PubMed] [Google Scholar]
- Kacena MA, Gundberg CM, Nelson T, Horowitz MC. Loss of the transcription factor p45 NF-E2 results in a developmental arrest of megakaryocyte differentiation and the onset of a high bone mass phenotype. Bone. 2005;36:215–223. doi: 10.1016/j.bone.2004.09.024. [DOI] [PubMed] [Google Scholar]
- Kacena MA, Nelson T, Clough ME, Lee SK, Lorenzo JA, Gundberg CM, Horowitz MC. Megakaryocyte-mediated inhibition of osteoclast development. Bone. 2006;39:991–999. doi: 10.1016/j.bone.2006.05.004. [DOI] [PubMed] [Google Scholar]
- Kacena MA, Gundberg CM, Kacena WJ, 3rd, Landis WJ, Boskey AL, Bouxsein ML, Horowitz MC. The effects of GATA-1 and NF-E2 deficiency on bone biomechanical, biochemical, and mineral properties. J Cell Physiol. 2013 doi: 10.1002/jcp.24322. [DOI] [PMC free article] [PubMed] [Google Scholar]
- Kelm RJ, Jr, Hair GA, Mann KG, Grant BW. Characterization of human osteoblast and megakaryocyte-derived osteonectin (SPARC) Blood. 1992;80:3112–3119. [PubMed] [Google Scholar]
- McDevitt MA, Shivdasani RA, Fujiwara Y, Yang H, Orkin SH. A “knockdown” mutation created by cis-element gene targeting reveals the dependence of erythroid cell maturation on the level of transcription factor GATA-1. Proc Natl Acad Sci U S A. 1997;94:6781–6785. doi: 10.1073/pnas.94.13.6781. [DOI] [PMC free article] [PubMed] [Google Scholar]
- Miao D, Murant S, Scutt N, Genever P, Scutt A. Megakaryocyte-bone marrow stromal cell aggregates demonstrate increased colony formation and alkaline phosphatase expression in vitro. Tissue Eng. 2004;10:807–817. doi: 10.1089/1076327041348473. [DOI] [PubMed] [Google Scholar]
- Shivdasani RA, Rosenblatt MF, Zucker-Franklin D, Jackson CW, Hunt P, Saris CJ, Orkin SH. Transcription factor NF-E2 is required for platelet formation independent of the actions of thrombopoietin/MGDF in megakaryocyte development. Cell. 1995;81:695–704. doi: 10.1016/0092-8674(95)90531-6. [DOI] [PubMed] [Google Scholar]
- Shivdasani RA, Fielder P, Keller GA, Orkin SH, de Sauvage FJ. Regulation of the serum concentration of thrombopoietin in thrombocytopenic NF-E2 knockout mice. Blood. 1997a;90:1821–1827. [PubMed] [Google Scholar]
- Shivdasani RA, Fujiwara Y, McDevitt MA, Orkin SH. A lineage-selective knockout establishes the critical role of transcription factor GATA-1 in megakaryocyte growth and platelet development. EMBO J. 1997b;16:3965–3973. doi: 10.1093/emboj/16.13.3965. [DOI] [PMC free article] [PubMed] [Google Scholar]
- Simmons DJ, Kent GN, Jilka RL, Scott DM, Fallon M, Cohn DV. Formation of bone by isolated, cultured osteoblasts in millipore diffusion chambers. Calcif Tissue Int. 1982;34:291–294. doi: 10.1007/BF02411253. [DOI] [PubMed] [Google Scholar]
- Simonet WS, Lacey DL, Dunstan CR, Kelley M, Chang MS, Luthy R, Nguyen HQ, Wooden S, Bennett L, Boone T, Shimamoto G, DeRose M, Elliott R, Colombero A, Tan HL, Trail G, Sullivan J, Davy E, Bucay N, Renshaw-Gegg L, Hughes TM, Hill D, Pattison W, Campbell P, Sander S, Van G, Tarpley J, Derby P, Lee R, Boyle WJ. Osteoprotegerin: a novel secreted protein involved in the regulation of bone density. Cell. 1997;89:309–319. doi: 10.1016/s0092-8674(00)80209-3. [DOI] [PubMed] [Google Scholar]
- Sipe JB, Zhang J, Waits C, Skikne B, Garimella R, Anderson HC. Localization of bone morphogenetic proteins (BMPs)-2, -4, and -6 within megakaryocytes and platelets. Bone. 2004;35:1316–1322. doi: 10.1016/j.bone.2004.08.020. [DOI] [PubMed] [Google Scholar]
- Suva LJ, Hartman E, Dilley JD, Russell S, Akel NS, Skinner RA, Hogue WR, Budde U, Varughese KI, Kanaji T, Ware J. Platelet dysfunction and a high bone mass phenotype in a murine model of platelet-type von Willebrand disease. Am J Pathol. 2008;172:430–439. doi: 10.2353/ajpath.2008.070417. [DOI] [PMC free article] [PubMed] [Google Scholar]
- Thiede MA, Smock SL, Petersen DN, Grasser WA, Thompson DD, Nishimoto SK. Presence of messenger ribonucleic acid encoding osteocalcin, a marker of bone turnover, in bone marrow megakaryocytes and peripheral blood platelets. Endocrinology. 1994;135:929–937. doi: 10.1210/endo.135.3.8070388. [DOI] [PubMed] [Google Scholar]
- Vannucchi AM, Bianchi L, Cellai C, Paoletti F, Rana RA, Lorenzini R, Migliaccio G, Migliaccio AR. Development of myelofibrosis in mice genetically impaired for GATA-1 expression (GATA-1(low) mice) Blood. 2002;100:1123–1132. doi: 10.1182/blood-2002-06-1913. [DOI] [PubMed] [Google Scholar]
- Villeval JL, Cohen-Solal K, Tulliez M, Giraudier S, Guichard J, Burstein SA, Cramer EM, Vainchenker W, Wendling F. High thrombopoietin production by hematopoietic cells induces a fatal myeloproliferative syndrome in mice. Blood. 1997;90:4369–4383. [PubMed] [Google Scholar]
- Warden SJ, Nelson IR, Fuchs RK, Bliziotes MM, Turner CH. Serotonin (5-hydroxytryptamine) transporter inhibition causes bone loss in adult mice independently of estrogen deficiency. Menopause. 2008;15:1176–1183. doi: 10.1097/gme.0b013e318173566b. [DOI] [PubMed] [Google Scholar]
- Weatherholt AM, Fuchs RK, Warden SJ. Cortical and trabecular bone adaptation to incremental load magnitudes using the mouse tibial axial compression loading model. Bone. 2013;52:372–379. doi: 10.1016/j.bone.2012.10.026. [DOI] [PMC free article] [PubMed] [Google Scholar]
- Wickenhauser C, Lorenzen J, Thiele J, Hillienhof A, Jungheim K, Schmitz B, Hansmann ML, Fischer R. Secretion of cytokines (interleukins-1 alpha, -3, and -6 and granulocyte-macrophage colony-stimulating factor) by normal human bone marrow megakaryocytes. Blood. 1995;85:685–691. [PubMed] [Google Scholar]
- Wong GL, Cohn DV. Target cells in bone for parathormone and calcitonin are different: enrichment for each cell type by sequential digestion of mouse calvaria and selective adhesion to polymeric surfaces. Proc Natl Acad Sci U S A. 1975;72:3167–3171. doi: 10.1073/pnas.72.8.3167. [DOI] [PMC free article] [PubMed] [Google Scholar]
- Yan XQ, Lacey D, Hill D, Chen Y, Fletcher F, Hawley RG, McNiece IK. A model of myelofibrosis and osteosclerosis in mice induced by overexpressing thrombopoietin (mpl ligand): reversal of disease by bone marrow transplantation. Blood. 1996;88:402–409. [PubMed] [Google Scholar]