

Abstract
Previous studies, predominantly in experimental animals, have suggested the presence of a differentiation of function across the hippocampal formation. In rodents, ventral regions are thought to be involved in emotional behavior while dorsal regions mediate cognitive or spatial processes. Using a combination of modeling the co-occurrence of significant activations across thousands of neuroimaging experiments and subsequent data-driven clustering of these data we were able to provide evidence of distinct subregions within a region corresponding to the human subiculum, a critical hub within the hippocampal formation. This connectivity-based model consists of a bilateral anterior region, as well as separate posterior and intermediate regions on each hemisphere. Functional connectivity assessed both by meta-analytic and resting fMRI approaches revealed that more anterior regions were more strongly connected to the default mode network, and more posterior regions were more strongly connected to ‘task positive’ regions. In addition, our analysis revealed that the anterior subregion was functionally connected to the ventral striatum, midbrain and amygdala, a circuit that is central to models of stress and motivated behavior. Analysis of a behavioral taxonomy provided evidence for a role for each subregion in mnemonic processing, as well as implication of the anterior subregion in emotional and visual processing and the right posterior subregion in reward processing. These findings lend support to models which posit anterior-posterior differentiation of function within the human hippocampal formation and complement other early steps toward a comparative (cross-species) model of the region.
Keywords: fMRI, subiculum, meta analytic connectivity modeling, resting fMRI, k-means clustering
1. Introduction
The hippocampal formation is crucial for mnemonic and spatial representation, and is also implicated in emotional and stress-related processes. The region is made up of several independent subregions, but functional specialization within the structure remains an area of ongoing experimental and theoretical concern. A variety of evidence supports the presence of functional specialization across a dorso-ventral gradient in rodents (Fanselow and Dong, 2010). Shaped as a cashew in these animals, the longitudinal axis extends in a dorsoventral (and septotemporal) direction. Broadly, ventral regions of the hippocampal formation are often considered to play a role in emotional behavior such as anxiety, whereas dorsal regions are thought to play a role in cognitive factors such as spatial and mnemonic processes (Bannerman et al., 2014). In primates, the hippocampal formation is shaped as a ram’s horn, extending in the posterioanterior direction. Consequently, the rodent ventral hippocampus is thought to correspond to the anterior hippocampus in humans, whereas the rodent dorsal hippocampus is located posterior in humans (Strange et al., 2014).
Similar evidence for differentiation of function across the region in humans is perhaps sparser (Poppenk et al., 2013), partly due to the technical challenges associated with experimental manipulations, neurophysiological recordings or neuroimaging of the region. Nevertheless, several fMRI studies have reported distinct patterns of activation across anterior and posterior regions of the hippocampus (e.g. (Baumann and Mattingley, 2013; Hirshhorn et al., 2012; Kuhn and Gallinat, 2014; Nadel et al., 2013; Strange et al., 1999; Voets et al., 2014). Another promising approach has been to examine patterns of resting functional connectivity with other structures, using for example, resting state fMRI (rsfMRI). These methods have proven to be a powerful way to investigate the communication of information across the human brain (Van Dijk et al., 2010), yielding patterns of connectivity that appear to correspond well to known neural circuits, and may reflect underlying anatomical connections (Baria et al., 2013; Damoiseaux and Greicius, 2009) and functional networks. A recent resting state fMRI study described the functional connectivity of the hippocampus with perirhinal and parahippocampal regions as following an antero-posterior gradient: most posterior regions were connected to parahippocampal compared with perirhinal cortex, whereas the reverse pattern was observed in anterior regions (Libby et al., 2012). An intermediate region demonstrated no preferential connectivity. This study implied that zones of differential functional connectivity within the hippocampus may reflect the presence of different functional properties of the more anterior and more posterior portions of the region, and accorded well with anatomical properties of the region as primarily known from animal models. Another recent study identified a gradient of connectivity across the structure with respect to connectivity with ventral striatum and midbrain (Kahn and Shohamy, 2013).While resting fMRI methods infer differential functional connectivity by comparing BOLD variations across time in a single brain state, such networks have the drawback that they lack a functional or neuropsychological context. Resting fMRI studies also tend to focus on particular frequency bands and stationary association, an approach which has proved highly robust but may only reflect a limited range of inter-regional information transmission.
Further characterization of functional connectivity may be obtained by alternative approaches, including meta-analytic connectivity modeling (MACM). In the MACM approach, the inference of functional interactions is based on the co-occurrence of significant activations across studies. While in practice, networks identified by MACM appear to correspond well to those identified by direct covariance using fMRI, discrepancies have also been noted (cf. Clos et al., 2013; Eickhoff et al., 2014; Jakobs et al., 2012). In general, a good corroboration of MACM-based or similar approaches with well-established brain functional connectivity patterns is seen (Clos et al., 2014; Crossley et al., 2013; Di et al., 2013). Nevertheless, distinct properties of MACM-estimated functional connectivity on large scale connectivity networks have been identified, which may reflect, at first approximation, the influence of a general task set (Crossley et al., 2013; Di et al., 2013). Neurofunctional context may be particularly relevant for understanding the functional connectivity of the hippocampal formation, as information transmission to and from the region can be modulated both by behavioral context and input from a third region (e.g. (Belujon and Grace, 2008; Gill and Grace, 2013). A recent development for functional mapping has been to examine patterns of differential connections via clustering algorithms to demonstrate distinct subregions with internally coherent connectivity within large anatomical structures (‘connectivity-based parcellation’). In particular, data driven clustering based on MACM maps has been employed to demonstrate distinct subregions of the amygdala (Bzdok et al., 2013), supplementary motor area (Eickhoff et al., 2011), temporo-parietal junction (Bzdok et al., 2013) and dorsolateral prefrontal cortex (Cieslik et al., 2013).
To our knowledge, a data-driven parcellation of the hippocampal formation using MACM maps has not been conducted (but see Bonnici et al., 2012). However, given the complexity of the hippocampal formation, with respect to its geometry, anatomical differentiation and connectivity, we focused on the subiculum rather than the entire region. Continuous with the CA1 region of the hippocampus, but located within the parahippocampal gyrus in humans (Duvernoy, 2005), the subiculum provides a central role in the integration of information within the hippocampus (Naber et al., 2000) as well as its transmission to other brain regions (Witter, 2006). The subiculum has also gained attention in the context of pathophysiological models for a variety of psychiatric conditions, in particular those with a component reflecting maladaptive responses to stress (Herman and Mueller, 2006), including schizophrenia, addiction and mood disorders (Belujon and Grace, 2014; Grace, 2010). Consistent with the presence of functional differentiation across the structure, distinct behavioral consequences of dorsal and ventral subiculum manipulations have been observed in rodents (Andrzejewski et al., 2006; Caine et al., 2001). The dorsal-most regions of the subiculum are known to contain place cells which encode location within the spatial domain (O’Mara, 2006). However, as one moves ventrally, this location information is overlaid with limbic inputs. Thus, ventral regions are able to encode the emotional salience of a location, consistent with a contextual signal (Grace, 2012). This functional segregation is mirrored by distinct patterns of anatomical connectivity across the rodent subiculum. The entire structure is connected to the septum, thalamus, mammillary bodies and retrosplenial cortex, although each region receives topographically organized projections. In addition, the ventral subiculum is connected to orbital and medial prefrontal cortex, nucleus accumbens (Aggleton, 2012; Groenewegen et al., 1987; Witter, 2006), and shows bidirectional connectivity with the amygdala (French et al., 2003). Anterior cingulate and prelimbic regions of the rodent prefrontal cortex receive input from the dorsal subiculum, whereas infralimbic regions receive input from ventral subiculum (Witter, 2006). Finally, some investigations have hinted at the presence of an intermediate region with mixed anatomical connectivity (Groenewegen et al., 1987; Strange et al., 2014; Wright et al., 2013).
Although the small size of the subregion and the resolution of imaging studies within the BrainMap database provides an upper limit on our ability to distinguish the subiculum per se from other nearby regions, this region was chosen as a seed for our analyses for two principal reasons: first, as the subiculum is generally considered to be an important output node through which the hippocampus proper communicates with downstream regions, estimates of functional connectivity are likely to be interpretable in terms of the pattern of known efferent connections from the region. Moreover, a prevailing interpretation of local BOLD signals (e.g. Bartels et al., 2008) might suggest that regions which receive synaptic input directly from the hippocampus should provide a promising place for initial focus. Second, the region, as defined by the cytoarchitectonic work of Amunts and colleagues (Amunts et al., 2005) is a relatively long, thin structure which traverses the entire anterior/posterior axis of the hippocampal formation. Although this limited resolution in the medial-lateral dimension, it provided a potential for discrimination in the dimension of interest. We were therefore optimistic that a data-driven parcellation of the region would reflect the functional differentiation across the anterior/posterior axis of the hippocampal formation.
In the present study, we aimed to map the subiculum based on regional patterns of functional connectivity using whole brain maps describing the co-occurrence of significant activations across studies. These maps were generated using the BrainMap database for each voxel within the subiculum. The cross-correlation of whole-brain co-occurrence of significant activations between each pair of seed voxels within the subiculum was computed. Clusters of seed voxels with similar patterns of connectivity were determined. The obtained clusters were cross-validated using multivariate clustering methods (Clos et al., 2013). We also aimed to map the (specific) whole-brain interaction pattern of the identified subregions using both task (using MACM) and resting state (examining variation in low frequency resting state BOLD) functional connectivity analyses. We investigated the extent to which the MACM and resting fMRI signals overlapped by using activation loci defined by the former to mask the latter, as well as performing whole brain analyses of each. A final aim was to characterize the functions of the resulting sub-regions with reference to the behavioral taxonomy information in the BrainMap database. We performed a functional characterization of the region via statistical forward and reverse inference, aiming to understand more precisely the region’s role in mnemonic (Carr et al., 2013), spatial (Suthana et al., 2011), motivational (Andrzejewski et al., 2006) and other cognitive processes.
Specific hypotheses regarding connectivity were tested with reference to aforementioned models of the hippocampal formation which emphasize long-axis functional differentiation (e.g. Strange et al., 2014): for example, the ventral/anterior subiculum has important input into the ventral striatum (Voorn et al., 2004) and influences context-related dopamine-dependent behavior (Andrzejewski et al., 2006; Caine et al., 2001; Lodge and Grace, 2008, 2011; Valenti et al., 2011). In addition, the subiculum has a bidirectional relationship with the basolateral amygdala (French et al., 2003) which may modulate the interaction with the ventral striatum (Gill and Grace, 2011, 2013). Consequently, we anticipated that the anterior subiculum would show strong connectivity with the amygdala and ventral striatum. We also anticipated that the subiculum would be functionally connected to regions within the default mode network (DMN), given that the hippocampal formation is considered part of the DMN (Andrews-Hanna et al., 2010b; Lu et al., 2012), and regions such as the retrosplenial cortex and nearby posterior cingulate cortex show consistent patterns of anatomical connectivity across the whole subiculum (Aggleton et al., 2012). It is important to emphasize that, due to the interconnectivity of different hippocampal subregions and the level of effective resolution afforded by the BrainMap database, the obtained parcellation structure is likely to reflect the organizational structure of the hippocampal formation as a whole, rather than reflecting the subiculum per se. In this light, a subsequent parcellation was performed on a Cornu Ammonis/Dentate Gyrus region of interest (Amunts et al., 2005).
2. Methods
2.1. Definition of the Region of interest
The volume of interest (VOI) that formed the basis of our investigation was derived from a histological definition of the subiculum using the SPM Anatomy Toolbox (Eickhoff et al., 2005). The bilateral subiculum, along with adjacent medial temporal lobe (MTL) structures, have previously been cytoarchitectonically mapped in 10 human postmortem brains, 3D reconstructed, and registered to MNI (Montreal Neurological Institute) reference space (Amunts et al., 2005). The overlap of these as well as histological information on the surrounding structures were used to generate a “maximum probability map” (MPM) of the hippocampal formation. This MPM reflects the most likely cortical fields at each brain voxel, and provides a discrete representation of microanatomically defined brain areas in standard space. The seed region for the current analysis was thus defined by the MPM representation of the human subiculum (Amunts et al., 2005), a VOI defined to include voxels where the subiculum had been more likely to be found than any other MTL structure in histological examination of the 10 individuals. A follow up analysis was conducted using a combined Cornu Ammonis / Dentate Gyrus region of interest, which had also been defined using the same method (Amunts et al., 2005).
2.2 Meta-analytic Connectivity Mapping (MACM)
The co-occurrence of significant activations across studies within each voxel within the subiculum VOI were computed, using data from the BrainMap database (www.brainmap.org; (Fox and Lancaster, 2002; Laird et al., 2011)). From this database, studies reporting fMRI and PET experiments in stereotaxic space from “normal mapping” studies in healthy participants, without interventions or group comparisons, were included. Approximately 7200 functional neuroimaging experiments that satisfied these criteria were considered for the current analysis. The co-ordinates from these maps are all registered within MNI space. The MACM analysis is based on the identification of all of the BrainMap experiments where a given seed voxel is activated. However, often the voxelwise activation is too sparse for subsequent integration of activation loci. To increase the reliability of connectivity estimates, BrainMap experiments were pooled which reported activation in the vicinity of each seed voxel. The width of the spatial filter used to identify the experiments was systematically varied by including the 20 to 200 experiments which are closest to a given seed voxel in steps of five (i.e. 20, 25, 30, 35,…, 200 experiments). Proximity was assessed by calculating the Euclidian distances between a given seed voxel and any activation reported in BrainMap, and sorting the experiments on this basis. Next, the n-nearest activation foci were selected, where n is the size of the spatial filter. As expected, this procedure successfully provided activation foci proximal to seed voxel. Specifically, the average distance between the seed voxel and activation foci included for that voxel varied from 4.09 mm (i.e. ~2 voxels) when the closest 20 experiments were included to 8.72 mm (i.e. ~4 voxels) when 200 experiments were included. The standard deviation across voxels likewise increased with increasing filter size from 0.720 mm (20 experiments) to 0.9 mm (200 experiments).
Subsequently, a coordinate-based meta-analysis was performed on the retrieved experiments, generating a brain-wide co-occurrence of activation profile of a given seed voxel, for each of the 37 filter sizes. The brain-wide pattern of co-occurrence for each individual seed voxel was computed by activation likelihood estimation (ALE: (Eickhoff et al., 2012; Eickhoff et al., 2009; Turkeltaub et al., 2002) meta-analysis over the experiments that were associated with that particular voxel by the pooling procedure outlined above. The key idea behind ALE is to treat the foci reported in the associated experiments not as single points, but as centers for 3D Gaussian probability distributions that reflect the spatial uncertainty associated with neuroimaging results. For each experiment, the probability distributions of all reported foci were then combined into a modeled activation (MA) map for that particular experiment (Turkeltaub et al., 2012). The voxel-wise union of these values (across all experiments associated with a particular seed voxel) then yielded an ALE score for each voxel of the brain that describes the co-occurrence probability of each particular location in the brain with the current seed voxel. The ALE scores of all voxels within the gray matter (based on 10% probability according to the ICBM (International Consortium on Brain Mapping) tissue probability maps) were then recorded before moving to the next voxel of the seed region. In contrast to conventional applications of ALE, no thresholding was performed at this stage as no inference was sought. Instead, we aimed to create a whole-brain map of co-occurrence probabilities for each seed voxel, and use this profile as a basis for parcellation of the VOI. Highest convergence is evidently found at the location of the seed, as experiments are pooled on the basis of their proximity to the seed. However, significant convergence at more distal locations is evidence of reproducible co-occurrence of activations across experiments.
2.3. Connectivity-based parcellation
The unthresholded brain-wide co-occurrence profiles for all seed voxels were then combined into a NS x NT co-occurrence matrix, where NS denotes the number of seed voxels in the subiculum (1509 voxels at 2×2×2 mm3 resolution) and NT the number of target voxels in the reference brain volume at 2 × 2 × 2 mm3 resolution (approximately 30,000 gray matter voxels at a resolution of 4 × 4 × 4 mm3). 4 × 4 × 4 mm3 was the resolution used for the co-occurrence map (NT) dimension, to reduce matrix redundancy and for computational expediency. K-means clustering (Matlab, Mathworks, USA) was used to parcellate the subiculum VOI with K = 2, 3, …, 9. K-means clustering is a non-hierarchical clustering method that uses an iterative algorithm to separate the seed region into a previously selected number of K non-overlapping clusters (Hartigan and Wong, 1979). K-means aims at minimizing the variance within clusters and maximizing the variance between clusters by first computing the centroid of each cluster and subsequently reassigning voxels to the clusters such that their difference from the centroid is minimal. The distance measure used was one minus the correlation between the co-occurrence patterns of seed voxels defined above (correlation distance). Importantly, maps of co-occurrence of activations were computed for each of the 37 different spatial filter sizes (see above), and the K-means parcellation was performed for each filter size independently, yielding 8 (K number of clusters) × 37 (filter size) independent cluster solutions (Clos et al., 2013). To avoid local minima, optimal solutions were determined from 25 replications of each parcellation, using random initial conditions (centroids).
2.4. Selection of optimal filter range
Following previous work on the inferior frontal gyrus (Clos et al., 2013), our approach to selecting the optimal solution of K-means clustering from the 8 (K clusters) by 37 (filter sizes) solutions was to examine the properties of these various solutions and establish the most stable range of filter sizes. This prevented a combinatorial expansion of possible solutions, and avoided the requirement of averaging across filter sizes (Bzdok et al., 2013; Cieslik et al., 2013). We implemented a two-step procedure that involved a decision on those filter-sizes (from the broad range of processed ones) to be included in the final analysis and subsequently a decision on the optimal cluster-solution. In the first step, we examined the consistency of the cluster assignment for the individual voxels across the cluster solutions of the co-occurrence maps performed at different filter sizes. We selected a filter range with the lowest number of deviants, i.e., number of voxels that were assigned differently compared with the solution from the majority of filters. In other words, we identified those filter sizes which produced solutions most similar to the consensus-solution across all filter sizes. The proportion of deviants (normalized within each cluster-solution K), illustrated in Supplemental Figure 2, indicates that most deviants were present in parcellations based on small filter sizes. As previously described (Clos et al., 2013), we chose the borders of the filter range (85 to 200) based on the z-scores of the number of deviants (Supplemental Figure 2), and this restricted range was used in all subsequent steps.
2.5. Selection of the optimal number of clusters
The second step was to determine the optimal solution of K within the restricted filter range of filter sizes. We considered three criteria representing the characteristics of the cluster solutions, reflecting topological, information-theoretic and cluster separation properties (see Supplemental Figure 2). First, misclassified voxels (deviants) represent an important topological criterion, as they indirectly reflect the amount of noise and local variance. We thus employed a criterion which addressed the across-filter stability: using the most frequent (mode) assignment of these voxels across all filter sizes as a reference point, the percentage of deviants for each filter-size that were assigned to a different cluster were computed. Optimal K parcellations were those where the percentage of deviants was not significantly increased compared to the K−1 solution, and in particular, those where the subsequent K+1 solution also lead to a significantly higher percentage of deviants.
Second, the similarity of cluster assignments for each filter size between the current solution and the neighbouring (K−1 and K+1) solutions was employed as an information theoretic criterion. We used the variation of information (VI) metric (Meila, 2007), which has also been employed in previous neuroimaging studies (Kahnt et al., 2012). For each filter size the VI metric was computed between a given K solution and the subsequent K+1 solution. Solutions were considered stable if there was a significant increase in VI between the subsequent set of solutions (primary criterion) or if there was a significant decrease from the previous to the current clustering step (secondary criterion).
Third, as a cluster separation criterion, the silhouette value averaged across voxels for each filter size was considered. The silhouette value is a measure of how similar that voxel is to voxels in its own cluster compared to voxels in other clusters, and ranges from −1 to +1. Good solutions are those with a significantly higher silhouette value compared to the K−1 solution (primary criterion) or whose silhouette value is at least not significantly decreased compared to the previous K−1 solution (secondary criterion).
2.6. Visualization of the best cluster solution
A five cluster solution was identified as the most stable parcellation (see Supplemental Figure 1). Only voxels located in the gray matter and hierarchically and spatially consistent were considered for subsequent analyses, resulting in 1373 out of the originally 1509 subiculum voxels in the identified subregions. Multidimensional scaling (MDS) was used to visualize the 2-dimensional cluster separation. We computed the NS × NS correlation distance matrix (see section 2.3) for each of the 24 filter sizes. Next, MDS was performed on the eigenimage of the 24 correlation distance matrixes. Sammon’s nonlinear mapping was used as the goodness-of-fit criterion. Finally, the locations of the five clusters were mapped back on the brain, taking the mode across filter sizes. The resulting clusters were individually median-filtered to create smooth, continuous structures. These filtered subregions were used for subsequent functional connectivity and BrainMap analyses.
2.7. Task-dependent connectivity: co-occurrence of significant activations across studies
The functional connectivity of the subregions was first assessed using meta-analytic connectivity modelling (MACM). For this, all experiments in the BrainMap database that featured at least one focus of activation in a particular subregion were compiled. In contrast to the MACM underlying the co-occurrence based parcellation, where ALE maps were not thresholded to retain the complete pattern of likelihoods of co-occurrence, statistical inference was now performed. Inference was performed with reference to a null-distribution reflecting a random spatial association between experiments with a fixed within-experiment distribution of foci (Eickhoff et al., 2009). This random-effects inference assesses above-chance convergence between experiments, not clustering of foci within a particular experiment. The observed ALE scores from the actual meta-analysis of experiments activating within a particular cluster were then tested against the ALE scores obtained under a null-distribution reflecting random spatial association, yielding a p-value based on the proportion of equal or higher random values (Eickhoff et al., 2012). The resulting non-parametric p-values were transformed into Z-scores and thresholded at a cluster-level Family Wise Error (FWE) rate-corrected threshold of p < 0.05 (cluster-forming threshold at voxel-level p<0.001).
We computed the overlap between the brain-wide co-occurrence patterns of the five connectivity-derived clusters using a minimum-statistic conjunction, i.e., by computing the intersection of the thresholded ALE-maps (Caspers et al., 2010). Next, we tested for differences in co-occurrence patterns between all pairs of clusters by performing MACM separately on the experiments associated with either cluster and computing the voxel-wise difference between the ensuing ALE maps. All experiments contributing to either analysis were then pooled and randomly divided into two groups of the same size as the two original sets of experiments defined by activation in the first or second cluster (Eickhoff et al., 2011). ALE-scores for these two randomly assembled groups were calculated and the difference between these ALE-scores was recorded for each voxel in the brain. Repeating this process 10,000 times then yielded a null-distribution of differences in ALE-scores between the MACM analyses of the two clusters. The ‘true’ difference in ALE scores was then tested against this null-distribution yielding a posterior probability that the true difference was not due to random noise in an exchangeable set of labels based on the proportion of lower differences in the random exchange. The resulting probability values were then thresholded at p > 0.95 (95% chance for true difference) and inclusively masked by the respective main effects, i.e., the significant effects in the MACM for the particular cluster.
In addition, we examined the MACM maps of the clusters at each level of parcellation, up to the most stable 5 cluster solution. We always compared the newly emerged child cluster with its remaining parent cluster at the same level of K. Thus, we report the MACM analyses associated with cluster 1 vs. 2 at the level of K = 2, cluster 3 vs. 2 at K = 3, cluster 4 vs. 1 at K = 4, and cluster 5 vs. 3 at K = 5.
2.8. Task-independent connectivity: “resting state”
In addition, we also delineated the task independent resting-state functional connectivity pattern of each cluster. Resting state fMRI images of 153 healthy volunteers (mean age 41.1 ± 18.0 years; 92 males) from the NKI/Rockland sample were obtained through the 1000 Functional Connectomes Project (www.nitrc.org/projects/fcon_1000/). During the resting state scans subjects were instructed to keep their eyes closed and to think about nothing in particular but not to fall asleep (which was confirmed by post-scan debriefing). For each subject 260 resting state EPI images were acquired on a Siemens TimTrio 3T scanner using blood-oxygen-level-dependent (BOLD) contrast (gradient-echo EPI pulse sequence, TR = 2.5s, TE = 30ms, flip angle = 80°, in plane resolution = 3.0 × 3.0mm2, 38 axial slices (3.0 mm thickness) covering the entire brain). The first four scans were excluded from further processing analysis using SPM8 to allow for magnet saturation. The remaining EPI images were first corrected for movement artifacts by affine registration using a two pass procedure in which the images were first aligned to the initial volumes and subsequently to the mean after the first pass. The obtained mean EPI of each subject was then spatially normalized to the MNI single subject template using the ‘unified segmentation’ approach (Ashburner and Friston, 2005). The ensuing deformation was applied to the individual EPI volumes. To improve signal-to-noise ratio and compensate for residual anatomical variations images were smoothed with a 5-mm Full Width Half Maximum (FWHM) Gaussian kernel.
In line with conventional methods of rsfMRI analysis, the time-series data of each voxel were corrected for the following nuisance variables (cf. Jakobs et al., 2012; Satterthwaite et al., 2012): the six motion parameters derived from the realignment step, and their first derivative; timeseries reflecting mean gray matter, white matter and cerebrospinal fluid, obtained by averaging across voxels assigned to the respective tissue classes by the SPM8 segmentation step. After regressing out these variables, the resulting residual timeseries were band pass filtered between 0.01 and 0.08Hz, as the majority of the power of the rsfMRI BOLD signal is present at these frequencies (Baria et al., 2013).
We used the five CBP-derived clusters as seeds for the resting state analysis. Linear (Pearson) correlation coefficients between the time series of the seed regions and all other gray matter voxels in the brain were computed to quantify rsfMRI connectivity. These voxel-wise correlation coefficients were then transformed into Fisher’s Z-scores and tested for consistency in a flexible factorial model across subjects. The main effect of connectivity for each cluster as well as planned contrasts between the clusters were tested using the standard SPM8 implementations with the appropriate non-sphericity correction. These analyses were thresholded at p<0.05 (FWE cluster-corrected; cluster-forming threshold at voxel-level p<0.001). A second analysis was performed to investigate the similarity between the MACM and resting state analyses: rsfMRI Z-score maps were masked using the thresholded maps from the MACM analysis: inference was performed only within the regions identified as co-activated by a MACM analysis using the corresponding subregion as a seed. A cluster was reported as significant in Table 2 if a FWE-corrected voxelwise threshold of p<0.05 was reached (corrected for voxels within the MACM mask rather than the whole brain).
Table 2.
Functional properties of subiculum subregions derived from analysis of the BrainMap database. Activation given domain or paradigm reflects domains or paradigms which show above chance probability of activating the region (FDR corrected). Domain or paradigm given activation reflects reverse inference, the probability of correctly inferring a domain or paradigm from an activation (FDR corrected).
| Activation/domain | Domain/activation | Activation/paradigm | Paradigm/activation | |
|---|---|---|---|---|
| Anterior | Explicit Memory; Fear | Explicit Memory | Face monitoring/discrimination; Film viewing | Face monitoring/discrimination; Film viewing; Encoding |
| A > RP | ||||
| A > LI | Film viewing | |||
| A > LP | Face monitoring/discrimination | |||
| A > RI | Semantics Speech | |||
| Right Intermediate | Explicit Memory | Explicit Memory | Cued Explicit Recognition; Encoding; Imagined objects/scenes; Passive viewing | Encoding; Imagined objects; Passive viewing; Cued Explicit Recognition |
| RI > RP | Imagined objects/scenes | |||
| RI > A | Visual Perception | |||
| RI > LI | ||||
| RI > LP | ||||
| Left Intermediate | Explicit Memory | Explicit Memory | Cued Explicit Recognition; Episodic Recall; Encoding; Paired Associates recall | Cued Explicit Recognition; Episodic Recall; Encoding; Paired Associates recall |
| LI > RP | Explicit Memory | Explicit Memory | ||
| LI > A | Explicit Memory | Explicit Memory | Episodic Recall | |
| LI > LP | ||||
| LI > RI | Semantics | Episodic Recall | ||
| Right Posterior | Explicit Memory | Explicit Memory | Encoding | Encoding |
| RP > A | Visual Distractor / attention; Go/NoGo | |||
| RP > LI | Working Memory | |||
| RP > LP | Reward Task | |||
| RP > RI | Semantics; Action Execution; Speech | Spatial Location Discrimination | ||
| Left Posterior | Explicit Memory | Explicit Memory | Cued Explicit Recognition; Encoding | Cued Explicit Recognition; Encoding |
| LP > RP | ||||
| LP > A | Visual Perception | Visual Distractor / attention | ||
| LP > LI | Working Memory; Visual Perception | Film viewing | ||
| LP > RI | Semantics |
Rows marked with the name of the subregion show the overall effects within the subregion, while rows marked with the regions’ initials show contrasts of the regions (A = anterior; RI/LI = right/left intermediate; RP/LP=right/left posterior; region A > region B = region A shows a significantly greater likelihood of paradigm/domain-related activation than B, FDR corrected).
2.9. Functional characterization: meta-data
The functional characterization of the CBP-derived clusters was based on the ‘Behavioral Domain’ and ‘Paradigm Class’ meta-data categories available for each neuroimaging experiment included in the BrainMap database. Behavioral domains include the main categories cognition, action, perception, emotion, and interoception, as well as their related sub-categories. Paradigm classes categorize the specific task employed (see http://brainmap.org/scribe/ for the complete BrainMap taxonomy).
In a first step, we determined the individual functional profile of the five CBP derived clusters by using forward and reverse inference (Bzdok et al., 2013; Cieslik et al., 2013; Rottschy et al., 2013). Forward inference is the probability of observing activity in a brain region given knowledge of the psychological process, whereas reverse inference is the probability of a psychological process being present given knowledge of activation in a particular brain region. In the forward inference approach, a cluster’s functional profile was determined by identifying taxonomic labels, for which the probability of finding activation in the respective cluster was significantly higher than the overall chance (across the entire database) of finding activation in that particular cluster. Significance was established using a binomial test (p < .05, corrected for multiple comparisons with reference to the False Discovery Rate (FDR)). Thus we tested whether the conditional probability of activation given a particular label (P(Activation|Task)) was higher than the base rate probability of activating a given subregion per se (P(Activation)). In the reverse inference approach, a cluster’s functional profile was determined by identifying the most likely behavioral domains and paradigm classes given activation in a particular subregion. This likelihood P(Task|Activation) can be derived from P(Activation|Task) as well as P(Task) and P(Activation) using Bayes’ rule. Significance was then assessed by means of a chi-square test (p < .05, FDR corrected).
3. Results
3.1. Subicular parcellation based on co-occurrence of significant activations across studies
As already noted in the methods, our identification of the optimal level for the K-means clustering of the subiculum VOI yielded a best solution at k = 5 (Figure 1). This solution indicated a bilateral anterior region, and distinct left and right posterior and intermediate regions (Figure 2). Notably, there was no a priori bias towards the identification of bilateral or unilateral regions in this analysis, and indeed running the same algorithm with unilateral subiculum regions yielded a similar pattern of three clusters per hemisphere. The derived clusters were of similar sizes, and there was no obvious asymmetry in the location of the posterior and intermediate subregions across the hemispheres.
Figure 1.

Visualization of properties of the best cluster solution (K = 5). Colour coding: Green = bilateral anterior; cyan = right intermediate; blue = left intermediate; red = right posterior; yellow = left posterior. Top left: Visualization of the 5-cluster solution by multidimensional scaling. Points (voxels) which are closer together have more similar co-occurrence maps. Top right: Cluster assignment and splitting of clusters across levels of K. Bottom left: Similarity matrix of the seed voxels in the original data. Bottom right: Similarity matrix of the seed voxels reordered in terms of the K-means clustering parcellation. Data obtained from BrainMap database.
Figure 2.

Initial parcellation of subiculum (green = bilateral anterior; cyan = right intermediate; blue = left intermediate; red = right posterior; yellow = left posterior). Data obtained from BrainMap database.
Although some voxels from outside of the subiculum ROI (e.g. entorhinal cortex) were included in the initial parcellation, these represented a tiny minority of each cluster, and were caused by downsampling the subiculum mask for the cluster analysis. Moreover, these were mostly removed by the filtering, leaving final clusters that were almost entirely restricted to the subiculum ROI alone. Only the anterior subregion (left hemisphere 96.2% and right hemisphere 99.3% of voxels within ROI) and the right intermediate subregion (98.2% within) had any voxels outside of the original subiculum ROI.
To test the specificity of this parcellation to the subiculum, we performed a follow-up analysis of a combined Cornu Ammonis / Dentate Gyrus (CA/DG) region of interest using the same methodological approach. A very similar pattern of parcellation provided the best fit, including a single bilateral anterior region, and separate left- and right-focused intermediate and posterior regions (see Figure 3). A slight difference was that the right posterior subregion was coupled with a smaller cluster on the left hand side (i.e. was partially bilateral). Parcellation fit metrics are included in the supplementary information (Supplemental Figure 3).
Figure 3.
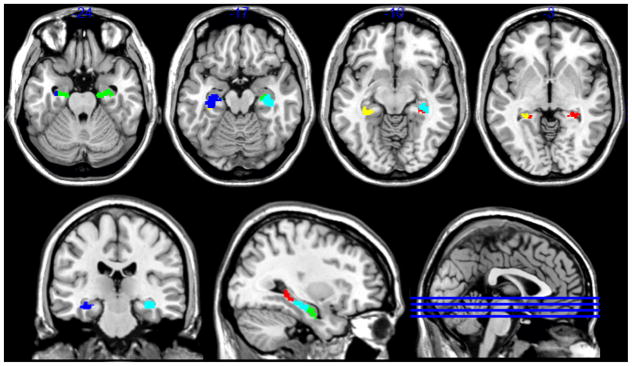
Parcellation of CA/DG region of interest (green = bilateral anterior; cyan = right intermediate; blue = left intermediate; red = right posterior; yellow = left posterior). Data obtained from BrainMap database.
3.2. MACM analyses of subicular subregions
Individual MACM analyses for each subregion revealed that, in spite of several common aspects, the main effect of each subregion was also associated with distinct patterns of co-occurrence of significant activations across studies (Table 1; Figure 4). The anterior cluster was associated with a cluster within the ventromedial prefrontal cortex (vmPFC). The intermediate and posterior subregions were more similar and generally associated with activation in a dorsomedial frontal location, at the nexus between dorsal and mid anterior cingulate cortex (ACC) and the supplementary motor area (SMA). Co-occurrence of activations was also observed in the left lateral prefrontal cortex, although the distribution of resulting clusters differed between the seed subregions. The intermediate and posterior subregions were also commonly associated with discrete activations in posterior regions such as the fusiform and calcarine gyri. The right posterior subicular subregion showed a unique pattern of activation in the bilateral putamen and anterior insula. Both posterior subregions showed thalamic activation. Direct comparison of the MACM connectivity maps largely revealed significant differences in regional connectivity in the regions identified by the initial subregion analysis (Table 1): so if a region was identified as being co-activated with a particular subiculum subregion, this region would usually show greater activation than any of the other subiculum subregions, at least within part of the co-occurrence cluster. In parallel with this finding, conjunction analyses revealed only minor convergent activations outside of the hippocampal complex: conjunctions across two subregions were restricted to co-occurrence within some intermediate and posterior regions within the SMA (Table 1).
Table 1.
Table denoting regions associated with MACM analysis, for each subregion (wholebrain FWE corrected threshold). “Resting fMRI correlation” denotes the presence of a significant (small volume corrected) positive or negative correlation of low frequency BOLD of the corresponding subiculum subregion in a given MACM cluster (‘convergent connectivity’).
| Cluster 1 (Right Posterior) | Peak Voxel (X Y Z) | Size (voxels) | rsfMRI correlation | MACM contrast (voxels) |
|---|---|---|---|---|
| Left Hippocampus (SUB) Left Amygdala (SF) Left Thalamus (Parietal) Left Pallidum Left Anterior Insula |
−18 −32 −8 | 1730 | Positive (1047) | > Ant (subiculum/thalamus 868; pallidum/insula 348) = Ant (392) > LI (subiculum/thalamus 340; insula 206; pallidum 68) = LI (655) > LP (insula 127; amygdala 63) > RI (subiculum/thalamus 423; pallidum 79) |
| Right Hippocampus (SUB/CA) Right Thalamus (Parietal/Temporal) |
18 −32 −8 | 1128 | Positive (1069) | > Ant (1028) > LI (869) = LI (491) > LP (953) > RI (862) |
| Supplementary Motor Area, mid cingulate cortex | −2 20 48 | 500 | Negative (137) | > Ant (422) > LI (53) = LI (237) > LP (38) > RI (229) |
| Left Fusiform Gyrus Left Cerebellum (Lobules V, VI, VIIa) |
−42 −62 −20 | 406 | Positive (68) | > Ant (343) > LI (Fusiform/VIIa 319; VI 78) > LP (VI 68; VIIa 40) > RI (VI/VII 189; V/VI 103) |
| Right Anterior Insula, Inferior Frontal Gyrus | 42 20 −6 | 363 | Positive (43) | > Ant (304) > LI (128) > LP (189) > RI (202) |
| Lingual, Calcarine Gyrus | 4 −70 2 | 335 | Positive (58) | > Ant (259) > LI (208) > LP (144) > RI (152; 39) |
| Right Pallidum, Putamen | 16 2 2 | 199 | None | > Ant (192) > LI (126) > LP (158) > RI (109) |
| Cluster 2 (Bilateral Anterior) | ||||
| Left Hippocampus (SUB/CA/EC) Left Amygdala (LB) |
−22 −14 −24 | 1503 | Positive (1284) | > RP (1028) = RP (392) > LI (838) = LI (728) > LP (1043) = LP (265) > RI (848) = RI (595) |
| Right Hippocampus (CA/EC/SUB) Right Amygdala (LB) |
20 −8 −22 | 1249 | Positive (1096) | > RP (1064) > LI (848) = LI (348) > LP (968) = LP (50) > RI (656) = RI (576) |
| Medial Orbitofrontal Cortex | 4 52 −14 | 445 | Positive (427) | > RP (418) > LI (anterior 169; medial 62; posterior 36) > LP (anterior 148; posterior 162) > RI (110) |
| Cluster 3 (Left Intermediate) | ||||
| Left Hippocampus (SUB/CA/FD) Left Amygdala (SF) |
−22 −24 −16 | 1471 | Positive (1239) | > LP (961) = LP (655) > Ant (1025) > LP (872) = LP (590) > RI (787) = RI (976) |
| Right Hippocampus (SUB/CA) Right Amygdala (SF/LB) |
22 −22 −16 | 961 | Positive (858) | > RP (355) = RP (491) > Ant (506) > LP (382) = LP (333) > RI (99) = RI (802) |
| Left Inferior Frontal, Precentral Gyrus | −42 6 50 | 805 | Negative (Precentral 170) | > RP (Precentral 87; IFG 36, 20) > Ant (500) > LP (Precentral 66; IFG 61) = LP (145) > RI (IFG 69; Precentral 24) = RI (151) |
| Supplementary Motor Area | −2 14 54 | 404 | Negative (173) | > RP (61) = RP (237) > Ant (375) = LP (188) = RI (105) |
| Left Precuneus / Retrosplenial, Calcarine Gyrus | −6 −56 8 | 280 | Positive (111) | > RP (114) > Ant 184) > LP (anterior 33; posterior 25) > RI (176) |
| Cluster 4 (Left Posterior) | ||||
| Left Hippocampus (SUB) Left Hippocampus (CA) Left Thalamus (Prefrontal/Temporal) Left Calcarine Gyrus |
−18 −32 −6 | 1469 | Positive (1292) | > RP (812) = RP (subiculum 757; thalamus 103) > Ant (1223) > LI (915) = LI (590) > RI (subiculum 989; calcarine 30) = RI (533) |
| Right Hippocampus (SUB) Right Hippocampus (CA) Right Hippocampus (FD) Right Thalamus (Temporal) |
20 −32 −6 | 544 | Positive (516; 33) | = RP (483) > Ant (439) = Ant (265) > LI (222) = LI (333) > RI (287) = RI (267) |
| Supplementary motor area / mid cingulate cortex | 2 18 40 | 308 | Negative (22) | = RP (167) > Ant (261) > LI (18) = LI (188) > RI (62) = RI (69) |
| Left Fusiform, Inferior Temporal/Occiptial Gyrus | −42 −62 −20 | 286 | None | > RP (61) = RP (159) > Ant (218) > LI (175) > RI (124) |
| Left Inferior Frontal, Precentral Gyrus | −42 8 30 | 225 | Negative (187) | > RP (85) > Ant (216) > RI (97) |
| Left Calcarine, Middle Occipital Gyrus | −8 −88 2 | 165 | Positive (129) | > RP (100) > Ant (134) > LI (lateral 43; medial 18) > RI (69) |
| Cluster 5 (Right Intermediate) | ||||
| Right Hippocampus (SUB/CA)/Amygdala (LB/SF) | 24 −22 −16 | 1403 | Positive (1389) | > RP (1040) = RP (371) > Ant (957) = Ant (576) > LI (CA/subiculum 998; Fusiform 119) = LI (802) > LP (1154) = LP (533) |
| Left Hippocampus (SUB/CA) / Amygdala (LB/SF) | −22 −24 −16 | 1044 | Positive (977) | > RP (452) = RP (559) > Ant (548) = Ant (595) > LI (16) = LI (976) > LP (330) = LP (267) |
| Left Precentral, Middle Frontal Gyrus | −44 2 40 | 184 | Negative (172) | > RP (61) > Ant (181) |
| Right Fusiform Gyrus | 44 56 −18 | 123 | None | > RP (17) > Ant (54) |
| Supplementary motor area | −2 18 46 | 110 | Negative (98) | > Ant (100) > LP (105) = LP (69) = LI (105) |
Cluster size, provided in parentheses, is determined using a cluster forming threshold of p<0.001 uncorrected. “MACM contrast” denotes the presence of a significant difference in the modeled activation scores, in terms of contrasts (>: modeled activation in region A is greater than B) and conjunctions (=: region A and B both coactivate the cluster) of different subregions (minimum cluster size reported 15 voxels). Ant = anterior; LI = left intermediate; RI = right intermediate; LP = left posterior; RP = right posterior; SUB = subiculum; CA = cornu ammonis; EC = entorhinal cortex; FD = fascia dentata; SF = superficial nucleus; LB = laterobasal nucleus.
Figure 4.
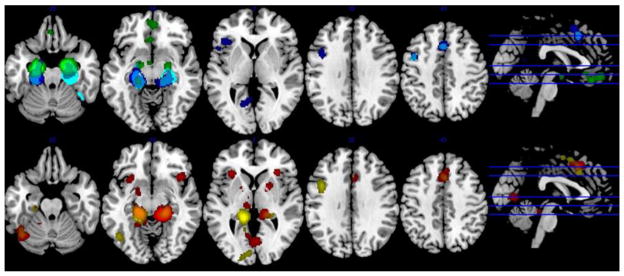
Meta-analytic connectivity mapping (MACM) of each of the five subiculum subregions: Top row: bilateral anterior (green); right intermediate (cyan); left intermediate (blue); Bottom row: right posterior (red); left posterior (yellow). Data obtained from BrainMap database.
Examination of the MACM connectivity associated with sub-optimal cluster solutions lower than 5 suggested that the initial separation of clusters was in terms of an anterior vs. middle/posterior divide (Supplemental Figure 4). At the point of the first separation, the anterior cluster was uniquely identified by its association with two DMN structures, a region of ventromedial PFC and posterior cingulate cortex (PCC), while the posterior region was better associated cortical structures with subcortical structures (lateral putamen, thalamus) and posterior cortical activation. However, both subregions were co-activated with supplementary motor area and left lateral PFC. These latter structures were the point of divergence at the next separation, with an anterior region co-activated with the vmPFC (but no longer PCC) separating from an intermediate region co-activated with SMA and left lateral PFC. The next split was between left and right posterior subiculum, where the right posterior region remained associated with the putamen and anterior insula, whereas the left posterior region was associated with a large co-occurrence cluster in left lateral prefrontal cortex and a distinct cluster in left occipital cortex. The final split was between left and right intermediate subregions: again, the left hemisphere region was associated with a substantial left lateral prefrontal cluster, whereas the right was distinguished by cluster in the right fusiform gyrus.
3.3. Functional connectivity of subicular subregions using rsfMRI
In order to complement the above findings, we also examined the resting-state functional connectivity of each of the five subregions, again using each as seed regions. First, we examined the positive and negative correlations with each region, masked by the MACM findings for the respective subregion (Table 1: SVC voxel wise corrected p<0.05). These analyses showed that, in general, regions identified by the MACM analysis also showed voxels with positive resting correlations with the corresponding subiculum subregion. There were a few exceptions: most importantly that regions of the SMA and left PFC, previously identified by the MACM analysis to be co-activated with intermediate and posterior regions, showed negative associations (anti-correlation) with resting bold in the corresponding subiculum subregion.
We also examined the unmasked main effects (Supplemental Table 1: Figure 5) and systematically performed planned comparisons between the five subregions (Supplemental Table 2; Figure 6) across the whole brain (FWE clusterwise correction p<0.05). Individual analysis of each seed region revealed that, in general, all subregions were functionally connected with the medial PFC, PCC/retrosplenial cortex, precuneus, as well as the inferior parietal/angular gyrus (PGp) and anterior temporal regions in anterior and intermediate subregions. Likewise, all subregions were negatively coupled with ‘task positive’ regions such as the dorsolateral and inferior PFC, superior parietal lobule (SPL 7A), inferior parietal cortex (PF/PFm; hIP3), dorsal ACC/SMA, anterior insula or visual regions (Supplemental Table 1). Taken together, the whole brain and MACM-masked analyses gave contrasting pictures of subiculum functional connectivity. Put simply, aside from the anterior subiculum, regions such as the PCC or medial PFC which were strongly functionally coupled to the subiculum in the rsfMRI analysis were not identified in the MACM analysis. Moreover, regions identified in the MACM analysis – the left lateral PFC and SMA - were negatively coupled with the subiculum in the rsfMRI analysis. Thus, regions outside the hippocampus which showed both MACM clusters and rsfMRI positive connectivity were present but somewhat sparse: the anterior subiculum seed showed such a conjunction in the vmPFC; bilateral posterior seeds co-activated in discrete sectors of the occipital cortex; left intermediate seed showed a conjunction in the retrosplenial/precuneus; and right posterior seed showed a conjunction in the right insula.
Figure 5.

Regions positively (red) and negatively (blue) connected with each subiculum subregion. Row A: Anterior; Row B: Right Intermediate; Row C: Left Intermediate; Row D: Right Posterior; Row E: Left Posterior. Threshold used for display: voxelwise p<0.001 uncorrected, k=60. Data obtained from NKI/Rockland rsfMRI dataset.
Figure 6.
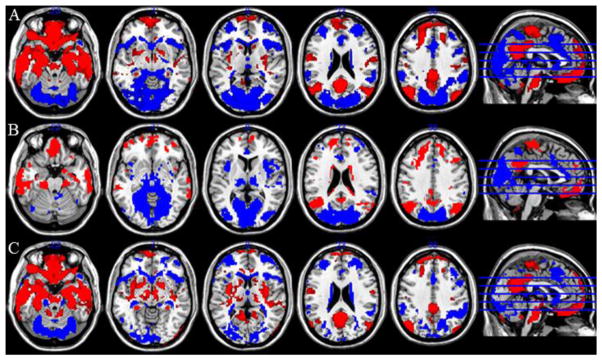
Contrast between subiculum subregions. Row A: Contrast of Anterior and Intermediate (left and right collapsed). Blue: Intermediate > Anterior; Red: Anterior > Intermediate. Row B: Contrast of Posterior and Intermediate (left and right collapsed). Blue: Posterior > Intermediate; Red: Intermediate > Posterior. Row C: Contrast of Posterior and Anterior (left and right collapsed). Blue: Posterior > Anterior; Red: Anterior > Posterior. Threshold used for display: voxelwise p<0.001 uncorrected, k=60. Data obtained from NKI/Rockland rsfMRI dataset.
We also performed pairwise contrasts between anterior, bilateral intermediate (left and right combined) and bilateral posterior seeds (Supplemental Table 2, Figure 6). We observed that anterior regions were more strongly functionally connected to several regions of medial PFC – extending through the orbitofrontal cortex, rostromedial PFC and dorsomedial PFC (although generally not including the ventral ACC), as well as the PCC and inferior parietal/angular gyrus, while intermediate and posterior regions were better associated with regions such as the dorsal ACC/SMA, anterior insula, bilateral dorsolateral PFC, dorsal striatum, medial thalamus, the fusiform gyrus and inferior (PF) and superior parietal (SPL).
In addition to identifying a relationship between the subiculum and cortical brain networks, the subiculum was functionally connected with specific subcortical regions, broadly consistent with our hypotheses (Supplemental Table 2; Figure 5). In particular, the amygdala showed strong rsfMRI connectivity with all subiculum subregions. In addition, more anterior regions showed stronger coupling than more posterior regions. Ventral regions of the striatum, particularly medial, were positively associated with anterior subiculum activity. On the other hand, dorsal and middle regions of the anterior striatum were negatively associated with anterior subiculum activity. In other words, activation in the anterior subiculum was associated with greater differential activation of ventral and dorsal striatum, compared to intermediate and posterior regions. Connectivity with the thalamus appeared to correspond to known anatomical connectivity, insofar as regions of the thalamus defined as connecting to the temporal lobe (on the basis of DTI connectivity (Behrens et al., 2003)) were positively associated with subiculum activity.
We were also able to investigate laterality effects in intermediate and posterior regions (Supplemental Table 2; Supplemental Figure 5) by contrasting rsfMRI activations of the corresponding left and right subregions. In general, differential activation was observed in the ipsilateral hemisphere. However, this was sometimes seen in regions negatively correlated with the corresponding region, suggesting a reduction of anticorrelation (e.g. left dorsolateral prefrontal and inferior parietal lobule (PF/PFm): left > right intermediate). On the other hand, prominent increases were seen in the visual cortex (left > right: posterior), and ventromedial PFC and striatum (right > left: intermediate): regions, which were already positively coupled with subicular activation.
3.4. Functional characterization of subiculum subregions
Examination of the functional properties of the BrainMap database revealed that mnemonic tasks were the most reliable task to activate all subicular regions (Table 2). Among cognitive domains, explicit memory tasks activated all of the 5 subregions, and a reverse inference analysis revealed that there was a significant (above chance) probability that an explicit memory task had been administered if the subiculum was activated. Analysis of the paradigms that might be responsible revealed that cued explicit recognition paradigms, paired associates recall, episodic recall and encoding paradigms all featured larger than chance probability of activation, although not all were significant for all subregions. Reverse inference revealed that for all subregions, the presence of a subiculum activation led to a significantly increased likelihood that an encoding task had been administered. While there was little decisive evidence of mnemonic specialization within the subiculum, some variation across the region was observed. In particular, the left intermediate region generally showed the greatest likelihood of mnemonic-related activation (explicit memory and episodic recall), and was significantly more reliably associated with explicit memory than two of the four other subregions.
Activation of the subiculum was not limited to mnemonic tasks. Fear paradigms activated the anterior subiculum. There was also evidence for perceptual functions based in the subiculum: a variety of paradigms which depend on visual processing were likely to activate the region, including face monitoring and discrimination, film viewing and passive viewing. These tended to be located in anterior or intermediate regions of the subiculum compared with the posterior regions. The region, particularly the right intermediate subregion, was also engaged by the related construct of object or scene imagination.
4. Discussion
In the present work, we analyzed maps describing co-occurrence of significant activations across fMRI studies and used data-driven clustering to define regions with distinct patterns of co-occurring activation within the subiculum. Our K-means clustering algorithm grouped the anterior subicula from both hemispheres into one cluster. The intermediate and posterior subicula from both hemispheres were represented by distinct subregions within the left and right hemisphere, respectively. Thus, unlike the anterior region, the intermediate and posterior subiculum showed a distinct pattern of hemispheric differentiation. Altogether, we found a robust parcellation of the human subiculum consisting of five separate, functionally distinct modules, which are distributed along its antero-posterior axis. We examined two additional aspects of the subicular subregions to characterize the parcellation in greater detail. First, the functional connectivity of these five regions using resting fMRI and meta-analytic connectivity modeling (MACM) was investigated. In many cases, these patterns of connectivity or co-occurrence were compatible with anatomical relationships between the subiculum and other cortical regions described in translational studies as discussed below. Second, investigation of the functional properties of the region revealed that the subiculum was predominantly activated by mnemonic paradigms. This corroborates the established role for the region in memory, and in particular the high resolution fMRI studies that have been optimized to provide evidence of this sort (Carr et al., 2010; Suthana et al., 2011). However, there was also some evidence for a role for the region in other cognitive challenges, such as fear or perceptual paradigms. The implications of these findings for neurofunctional theories of the subiculum are likewise discussed in detail below.
The human subiculum is a relatively small structure, given the spatial resolution of fMRI, and the parcellation of the region reflected information from voxels outside of the region. Nevertheless, the subregion ROIs that resulted from the clustering analysis were restricted, almost entirely, to the subiculum ROI defined by Amunts and colleagues (Amunts et al., 2005). Although this was not the focus of the present work, application of the same clustering method to the CA/DG region of the hippocampus proper yielded a very similar, but not identical, five cluster solution to that seen within the subiculum. Our interpretation of these findings is as follows: first, the CA/DG parcellation largely corroborates both the subiculum parcellation, as well as translational perspectives regarding long-axis specialization within the hippocampal formation (Bach et al., 2014; Poppenk et al., 2013; Strange et al., 2014) and provide further validation of the dorso-ventral dichotomy suggested on the basis of animal research (Fanselow and Dong, 2010). Second, regardless of the findings, resolution limitations – which are particularly acute across the medial/lateral dimension – would prohibit strong conclusions regarding separable subicular and hippocampal parcellations. Nevertheless, such limitations do not apply to considering hemispheric differences, nor are as severe across the axis of interest (anterior/posterior). We conclude therefore that the five cluster solution may reflect a reproducible functional motif within the hippocampal formation as a whole. Of course, different methodologies may reveal different patterning, as the degree of functional differentiation may depend on the type of physiological dimension investigated (Strange et al., 2014). As far as fMRI is concerned, high resolution methods are likely to be better suited to extending our conclusion, perhaps to confirm the presence of a similar motif across hippocampal subregions (see also (Bonnici et al., 2012)).
4.1. Large Scale Brain Networks: Default Mode and Task Positive Networks
The default mode network (DMN) is a central motif of correlated, low frequency brain networks during rest (Raichle et al., 2001), and often reduces its activation during task-related, executive cognition (Schilbach et al., 2012). Neural activity measured with fMRI within the hippocampal formation is positively associated with activation of this network in both rodents and humans (Lu et al., 2012). Accordingly, we observed that resting signal fluctuations within all five subregions of the subiculum were positively correlated with those of regions attributed to the DMN including the rostral ACC, medial PFC (both ventral and dorsal), PCC and inferior parietal, and negatively correlated with those of ‘task positive’ regions associated with general cognitive task performance. Regions included in the latter category included regions associated with executive control such as the dorsolateral PFC (Duncan and Owen, 2000) and intraparietal sulcus (Champod and Petrides, 2007), and regions associated with sustained task performance such as the dorsal ACC, SMA and anterior insula (Dosenbach et al., 2006). Moreover, the anterior region of the subiculum was more strongly associated with the DMN, both in resting fMRI and MACM, while posterior and intermediate regions were comparatively more strongly associated with task positive regions listed above. Put another way, a more obvious anti-correlation between DMN and task positive networks was observed using more anterior rather than more posterior seeds. Given that this type of reciprocal relationship is arguably a characteristic of rsfMRI (Uddin et al., 2009), the pattern of differential connectivity in more anterior regions of the subiculum is therefore consistent for the most part with a better coupling to coherent, ongoing activation in the DMN. MACM provided a similar pattern of data insofar as the anterior subiculum was co-activated with the vmPFC, whereas intermediate and posterior regions were co-activated with left lateral PFC, SMA and anterior insula, for example. Thus, however, there was an overall bias towards co-occurrence of significant activations across studies with task positive regions, rather than a reduction of anticorrelation, as was seen in the rsfMRI data. It should be emphasized that the MACM analysis is not biased toward regions associated with the performance of difficult or sustained cognition because is based on data from group contrast co-ordinate maps: regions associated with the DMN show clear ‘task’-related activation, provided the correct cognitive domain is examined (Schilbach et al., 2012). Rather, the evidence more clearly supports the notion that functional connectivity of the subiculum with the left lateral PFC and SMA, though not a variety of other regions (see Table 1), is changing substantially between task and resting states (Di et al., 2013; Mennes et al., 2013; Messe et al., 2014). While we should acknowledge that there are potentially other interpretations of this discrepancy which do not relate directly to functional connectivity as conventionally defined (e.g. perhaps relating to task confounds), this proposed task-dependent relationship between regions is eminently testable using controlled task contexts, alternative neuroimaging methodologies, and statistical approaches such as dynamic causal modelling (Bernal-Casas et al., 2013) or psychophysiological interaction (Fornito et al., 2012). Indeed, we would argue that a multi-modal approach to connectivity is inevitably required to provide an adequate characterization of the functional connectivity of these regions, particularly as the MTL and PFC may communicate via distinct frequency bands (Ketz et al., 2015).
The posterior cingulate (PCC), which showed rsfMRI functional connectivity with all five subregions, is a key node in the default mode network, and anatomical connections between the subiculum, the PCC and nearby retrosplenial cortex (RC) are well established (Aggleton et al., 2012; Witter, 2006). It is likely that interactions between the RC and hippocampal formation play an important role in spatial memory (Albasser et al., 2007). The RC is situated slightly ventral to the posterior cingulate, and it is these connections that are likely to play a role in the substantial functional connectivity that we observed between the subiculum and specific regions within the DMN, including the inferior parietal cortex/angular gyrus and medial PFC. In the rodent, anatomical connections between the subiculum and retrosplenial cortex are relatively consistent across the entire subiculum (Aggleton et al., 2012; Witter, 2006), but this contrasts with our observation that retrosplenial/subiculum functional connectivity is more robust with the anterior than posterior subiculum. One possible explanation, partially supported by the MACM findings, is that it is a consequence of stronger coupling of anterior subiculum activation with coherent DMN activity, resulting from the anterior subiculum projections to the medial prefrontal cortex (Aggleton, 2012; Witter, 2006). Thus the medial prefrontal cortex may mediate the statistical association between activation within the anterior subiculum and the posterior cingulate cortex.
In light of the frequent observation of activation in the subiculum during memory paradigms, and the differential relationship of subicular subregions with default mode and task positive networks, it is notable that Fornito and colleagues (Fornito et al., 2012) demonstrated an alteration in the inter-correlation of DMN and right lateral fronto-parietal regions associated with executive cognition during a recognition memory paradigm. This change predicted more rapid recollection. This is consistent with our findings, insofar as we observed that estimates of the subiculum’s functional connectivity changed dramatically from task to rest conditions, such that regions of the left lateral PFC and SMA were positively co-activated during task conditions but showed negative coupling using rsfMRI. The Fornito et al. study implies that the changes in the correlational structure of large scale networks, such as the DMN, are relevant for understanding mnemonic processes (see also Hermundstad et al., 2014). Moreover, the differential relationship across subregions with these networks may reflect functional differences between the subregions. However, this will only be adequately understood by examining coupling during task as well as rest conditions using the same, context-dependent, within-participant estimates of connectivity.
4.2. Ventral striatum and midbrain: evidence for a role in dopamine regulation
Resting fMRI revealed significant coupling between the anterior subiculum subregion and ventral striatum and midbrain. Notably, however, anterior and posterior regions of the subiculum appeared to show different patterns of connectivity with the striatum. While anterior regions were associated with ventral regions of the striatum, this positive coupling was significantly reduced in intermediate and posterior regions. By contrast, anterior regions of the dorsal striatum were negatively associated with the anterior subiculum, and this negative coupling diminished (became less negative) with intermediate and posterior seeds. Further supporting our hypotheses, midbrain activity was also positively coupled with anterior subiculum. These findings are consistent with previous investigations of interactions between hippocampus, midbrain and ventral striatum identified using both resting fMRI (Kahn and Shohamy, 2013) and using multimodal imaging techniques (Schott et al., 2008; Stone et al., 2010). They also accord well with a role for the subiculum in the regulation of dopamine neurotransmission via adjustment of the amplitude of dopamine system responses to phasic events (Lisman and Grace, 2005; Lodge and Grace, 2006).
Finally, we note that an association between the subiculum and ventrolateral striatum (putamen/pallidum) was observed in the MACM analysis: but only for the right posterior subregion. This finding was surprising and was not consistent with evidence from rsfMRI data, in which the anterior but not posterior subiculum was connected to medial and lateral ventral striatum. It should be noted that there is evidence of a topographic projection from the subiculum to the striatum in the rodent (Groenewegen et al., 1987), where more dorsal (corresponding to posterior) subicular regions are connected to lateral striatum, and ventral (corresponding to anterior) are connected to the medial striatum. Nevertheless, it remains unclear why the co-occurrence of activations across studies in the putamen should be relatively unique to a right posterior subregion seed, and to the MACM analysis. It may be that psychological context is crucial, and thus that evidence of functional connectivity can only be found under certain task conditions. Alternatively, it may be that the BrainMap database does not provide strong representation of studies which can co-activate both the striatum and the subiculum, perhaps due to a focus in the literature of phasic reward-responses (see Section 4.5. below), although the right posterior subiculum does show a relationship with reward paradigms, albeit at an uncorrected significance level.
4.3. Connectivity with other regions: Amygdala and Temporal lobe
Evidence of functional connectivity between subicular subregions and amygdala was seen using both MACM and resting fMRI. We observed no evidence using MACM for a clear dissociation with regard to the amygdala, but resting fMRI revealed that anterior subiculum was more strongly connected to the amygdala than intermediate or posterior regions. These findings are consistent with anatomical evidence: connections between the subiculum and the amygdala are predominantly found within the ventral subiculum in rodents (Witter, 2006), and are bidirectional (French et al., 2003; Lipski and Grace, 2013). Important functional relationships between subiculum and ventral striatum may be controlled by amygdala (Gill and Grace, 2011, 2013).
The inter-relationship between the subiculum and the rest of the temporal lobe was not a major focus of the present study. This was due to the complex anatomical connectivity between the hippocampal formation and the temporal lobe, and the existence of differential anatomical connectivity across the proximal/distal plane of the subiculum (Aggleton, 2012). Nevertheless, our findings are compatible with previous resting fMRI studies of graded temporal lobe connectivity (Libby et al., 2012), insofar as more posterior regions of the subiculum were more strongly connected to the parahippocampal and fusiform gyri, whereas more anterior regions were more strongly connected to the perirhinal cortex and anterior temporal regions.
Thalamus
Evidence for functional connections between the subiculum and thalamus was obtained in the present work: several of the subiculum subregions were positively coupled to activity in the thalamus, although these thalamic activations were perhaps not as anterior as might be expected. Anatomical evidence strongly supports the notion that anterior regions of the thalamus should be preferentially associated with the subiculum (Aggleton et al., 1986; Saunders et al., 2005; Wright et al., 2013), connections which are thought to be crucial for memory processing (Aggleton, 2012) via interactions at theta frequency (Ketz et al., 2015). Subicular efferents also terminate in lateral dorsal and midline thalamic nuclei, though there is relatively little input to the medial dorsal thalamus (Aggleton, 2012; Wright et al., 2013). The MACM analysis identified co-occurrence of significant activations across studies between the posterior subiculum subregions and a relatively posterior region of the thalamus. However, in general, positive subiculum/thalamus coupling in both MACM and resting fMRI corresponded to thalamic regions previously identified to be connected to the temporal lobe in a diffusion tensor imaging study (Behrens et al., 2003). Other thalamic regions showed evidence of anticorrelation with the subiculum using rsfMRI: these regions may correspond to medial dorsal regions, which show functional and anatomical connectivity with lateral prefrontal regions subserving executive control (Alexander et al., 1986). Consequently, the anticorrelation of these thalamic regions with the subiculum may be a consequence of the anticorrelation between these lateral PFC regions and the subiculum, rather than a direct inhibitory effect exerted by the subiculum.
Prefrontal Cortex and Medial Frontal Cortex
As described previously, there was a striking difference between MACM-derived clusters using posterior and intermediate subregions of the subiculum as seeds, and the functional connectivity of these seeds measured using rsfMRI, with respect to the left lateral PFC and SMA. Importantly, functional interactions of the prefrontal cortex and hippocampal formation can be excitatory or inhibitory depending on the influence of interconnected regions such as the MD thalamus or VTA (Floresco and Grace, 2003). Thus, the different estimates of functional connectivity between subiculum and lateral PFC may be attributable to the contribution of context-dependent recruitment of other regions. By contrast, there was a more consistent positive relationship between the subiculum and vmPFC, although MACM only revealed significant co-occurrence in these regions with the anterior seed. In general, these patterns of functional connectivity reflect underlying anatomical connections. In the rodent, the ventral subiculum projects to the ventromedial prefrontal and orbitofrontal cortex (Aggleton, 2012; Witter, 2006), and homologous connections in the human may underlie the strong positive functional connectivity between the anterior subiculum and the vmPFC. Given the homology between the rodent, macaque and human DMN (Lu et al., 2012), it seems likely that similar patterns of anatomical connectivity underlie this coherent activation across species. By contrast, the dorsal subiculum of the rodent projects to the anterior cingulate cortex, although not strongly (Insausti and Munoz, 2001).
It is worth noting that co-occurrence of activations across studies between the intermediate and posterior subregions and the left lateral PFC showed some qualitative differences: the left intermediate region was characterized by relatively widespread activation that was apparent across dorsal and ventral inferior frontal gyrus, while the left posterior region showed a similar but smaller cluster, located centrally within the same region of dorsolateral PFC. By contrast, the right posterior subregion had no co-occurrence across studies in the left PFC, and the right intermediate subregion only a discrete locus in a dorsal region, within the premotor cortex. These findings are intriguing as a similar region of left lateral PFC is reliably associated with the emotional modulation of explicit memory encoding (Murty et al., 2010), and they support the existence of a functional pathway between the left lateral PFC and subiculum. Indeed, the left intermediate subregion showed both the largest co-occurrence across studies in left lateral PFC, as well as the most reliable association with explicit memory using BrainMap.
4.4. Hemispheric lateralization of intermediate and posterior regions
Our findings, both the parcellation and the connectivity analyses, provide clear support for evidence of a hemispheric differentiation of function in the MTL (e.g. Kelley et al., 1998; Kennepohl et al., 2007; Suthana et al., 2011). However, the fact that hemispheric differences are only seen in the posterior and intermediate regions would not necessarily have been a strong prediction. This observation may relate to the general interpretation of anterior/posterior differences in the subiculum: that more posterior regions are better connected to lateral prefrontal regions that would also be expected to show hemispheric differences (e.g. Habib et al., 2003).
To follow up the result of the parcellation, we performed contrasts of the rsfMRI data between the left and right subregions of the intermediate and posterior subiculum. Although, often more positive ipsilateral coupling was observed, as might be expected, there were some intriguing differences which suggest differential hemispheric coupling with large scale brain networks, including structures such as the ventromedial PFC (intermediate right > left), left dorsolateral PFC and inferior parietal lobule (PF) (intermediate left > right) or visual cortex (posterior left > right). Indeed, Andrews-Hanna and colleagues (Andrews-Hanna et al., 2010a; Andrews-Hanna et al., 2010b) have emphasized interactions between the MTL and the DMN in the kinds of ongoing, unconstrained cognitions – particularly mental time travel - that would occur during rsfMRI acquisition. It may be that the right subiculum, particularly the intermediate region which showed stronger functional connectivity with the vmPFC, is more readily integrated into this spontaneous, unconstrained cognition network than subregions on the left. This proposal could potentially be tested (Andrews-Hanna et al., 2010a). In this light, it is notable that the right intermediate subregion was also found to be most consistently related to imagination of objects or scenes, a finding with potential relevance for understanding the content of cognition during the resting state.
4.5. Functional role of the subiculum
Analysis of the functional role of the subregions largely supported the view that the MTL is engaged by memory paradigms (Henson, 2005). Although there was some support for a role for the region in other domains of cognition (e.g. face perception, imagination, film viewing), many of these may rely on or engage similar processes as those on which episodic memory depends: for example, the ability to construct scenes internally or other visual imagery (Hassabis and Maguire, 2007). Indeed, the observation that aspects of visual cognition may depend on the subiculum is relevant to a debate regarding the relative importance of the hippocampal formation’s role in mnemonic and visual processing (Buckley, 2005). Pertinent to this debate, constructs relating to visual processing tended to be most dependent on anterior and intermediate regions rather than posterior regions. Notably these regions are connected with the perirhinal region (Aggleton, 2012; Libby et al., 2012), and evidence for the perirhinal cortex in perceptual processes is gradually emerging (e.g. Barense et al., 2012).
In general however, in contrast to our functional connectivity analyses, the functional decoding analysis yielded relatively little strong support for the notion that there may be functional differences across the anterior/posterior extent of the subiculum. However, it is nevertheless worth noting that fear paradigms were likely to activate the anterior subiculum, consistent for a role for the subregion in emotional or stress-related behavior (Herman and Mueller, 2006; Lowry, 2002; Valenti et al., 2011), and also with the strong anatomical connectivity with the amygdala (French et al., 2003). Indeed, the dual activation of the anterior subiculum by episodic memory paradigms and emotional stimuli is consistent with the view that it may play a role in determining an emotional or motivational context for behavior (Grace, 2010), and accords with theoretical perspectives regarding emotion as a mnemonic contextual signal (e.g. Bower, 1981).
Although the Brain Map database is comprehensive and as unbiased a resource as may be expected, there may be areas in which publication biases are manifest (e.g. task confounds correlated with a particular paradigm class c.f. Poppenk et al., 2013). These may also be particularly relevant for paradigms, such as stress, in which a rather complex interaction of elements of experimental design may be necessary. In addition, the involvement of the subiculum in reward and motivated behavior, which is established in rodent studies (Sesack and Grace, 2010), was not strongly confirmed in the functional characterization analysis (with a possible exception of the right posterior subregion at an uncorrected threshold). A possible cause may relate to a focus of reward-related fMRI studies on phasic reward responses that engage the ventral striatum, whereas the subiculum may provide a greater contribution to tonic, context-related motivational signals (Grace, 2012; Lisman and Grace, 2005). There was also no clear evidence for functional differences between hemispheres, as has been suggested for the hippocampus (e.g. Kelley et al., 1998; Kennepohl et al., 2007; but see Henson, 2005), for example, in terms of encoding and retrieval as has been specifically suggested for the subiculum (Carr et al., 2010; Suthana et al., 2011). Nevertheless, the left intermediate region showed particularly reliable memory related activation, which may reflect an underlying specialization for the region. It is likely that the taxonomy employed by the BrainMap database may not be of a sufficient resolution to clarify more fully the functional role of subicular subregions, as potentially relevant differences such as the content of memory encoding (Kennepohl et al., 2007) or attentional influences (Carr et al., 2013) are not coded.
4.6. Summary
An overriding theme of the present work is that the information about the subiculum’s anatomical and functional connectivity derived predominantly from research with experimental animals is, in many ways, comparable to that obtained using functional neuroimaging methods (Strange et al., 2014). Our findings point support organizational framework for the human hippocampus – that of an anterior-posterior differentiation of function, which may guide further translational research. This organization reveals different relationships across the structure with regions subserving executive and sustained cognition, and the default mode networks, with posterior and intermediate regions being more strongly related to the former regions, and the anterior region to the DMN. Posterior and intermediate regions were distinguished from each other by differential connectivity with the left lateral PFC, and discrete loci within occipital and temporal regions. The right posterior subregion was related to putamen activation and also showed an (uncorrected) relationship with reward paradigms. Our findings provided strong support for a role for the subiculum in memory paradigms, and some evidence for a contribution in perceptual and emotional processes, although we found little consistent evidence for a neurofunctional dissociations of this region using the BrainMap taxonomies. The five cluster model may be useful as a means of clarifying distinct pathological pathways underlying disease states, which we anticipate will be an area of future interest due to the role of the region in the contextual control of behavior and the endocrine response to stress.
Supplementary Material
Research Highlights.
Data driven parcellation of the subiculum reveals five clusters.
Anterior regions were better connected to default mode network.
Region plays a role in memory, visual cognition and emotion.
Acknowledgments
Funding: This study was supported by the National Institute of Mental Health (NIMH) grants R01 MH100041, MH060952 and MH073953 (to M.L.P.). SBE is supported by the Deutsche Forschungsgemeinschaft (DFG, EI 816/4-1, LA 3071/3-1; EI 816/6-1.), the National Institute of Mental Health (R01-MH074457) and the European Union Seventh Framework Programme (FP7/2007-2013) under grant agreement no. 604102 (Human Brain Project).
Footnotes
Conflicts of interest: None of the authors declare any financial or other conflicts of interest that might have biased the work.
Publisher's Disclaimer: This is a PDF file of an unedited manuscript that has been accepted for publication. As a service to our customers we are providing this early version of the manuscript. The manuscript will undergo copyediting, typesetting, and review of the resulting proof before it is published in its final citable form. Please note that during the production process errors may be discovered which could affect the content, and all legal disclaimers that apply to the journal pertain.
References
- Aggleton JP. Multiple anatomical systems embedded within the primate medial temporal lobe: implications for hippocampal function. Neurosci Biobehav Rev. 2012;36:1579–1596. doi: 10.1016/j.neubiorev.2011.09.005. [DOI] [PubMed] [Google Scholar]
- Aggleton JP, Desimone R, Mishkin M. The origin, course, and termination of the hippocampothalamic projections in the macaque. J Comp Neurol. 1986;243:409–421. doi: 10.1002/cne.902430310. [DOI] [PubMed] [Google Scholar]
- Aggleton JP, Wright NF, Vann SD, Saunders RC. Medial temporal lobe projections to the retrosplenial cortex of the macaque monkey. Hippocampus. 2012;22:1883–1900. doi: 10.1002/hipo.22024. [DOI] [PMC free article] [PubMed] [Google Scholar]
- Albasser MM, Poirier GL, Warburton EC, Aggleton JP. Hippocampal lesions halve immediate-early gene protein counts in retrosplenial cortex: distal dysfunctions in a spatial memory system. Eur J Neurosci. 2007;26:1254–1266. doi: 10.1111/j.1460-9568.2007.05753.x. [DOI] [PubMed] [Google Scholar]
- Alexander GE, DeLong MR, Strick PL. Parallel organization of functionally segregated circuits linking basal ganglia and cortex. Annu Rev Neurosci. 1986;9:357–381. doi: 10.1146/annurev.ne.09.030186.002041. [DOI] [PubMed] [Google Scholar]
- Amunts K, Kedo O, Kindler M, Pieperhoff P, Mohlberg H, Shah NJ, Habel U, Schneider F, Zilles K. Cytoarchitectonic mapping of the human amygdala, hippocampal region and entorhinal cortex: intersubject variability and probability maps. Anat Embryol (Berl) 2005;210:343–352. doi: 10.1007/s00429-005-0025-5. [DOI] [PubMed] [Google Scholar]
- Andrews-Hanna JR, Reidler JS, Huang C, Buckner RL. Evidence for the default network’s role in spontaneous cognition. J Neurophysiol. 2010a;104:322–335. doi: 10.1152/jn.00830.2009. [DOI] [PMC free article] [PubMed] [Google Scholar]
- Andrews-Hanna JR, Reidler JS, Sepulcre J, Poulin R, Buckner RL. Functional-anatomic fractionation of the brain’s default network. Neuron. 2010b;65:550–562. doi: 10.1016/j.neuron.2010.02.005. [DOI] [PMC free article] [PubMed] [Google Scholar]
- Andrzejewski ME, Spencer RC, Kelley AE. Dissociating ventral and dorsal subicular dopamine D1 receptor involvement in instrumental learning, spontaneous motor behavior, and motivation. Behav Neurosci. 2006;120:542–553. doi: 10.1037/0735-7044.120.3.542. [DOI] [PMC free article] [PubMed] [Google Scholar]
- Ashburner J, Friston KJ. Unified segmentation. Neuroimage. 2005;26:839–851. doi: 10.1016/j.neuroimage.2005.02.018. [DOI] [PubMed] [Google Scholar]
- Bach DR, Guitart-Masip M, Packard PA, Miro J, Falip M, Fuentemilla L, Dolan RJ. Human hippocampus arbitrates approach-avoidance conflict. Curr Biol. 2014;24:541–547. doi: 10.1016/j.cub.2014.01.046. [DOI] [PMC free article] [PubMed] [Google Scholar]
- Bannerman DM, Sprengel R, Sanderson DJ, McHugh SB, Rawlins JN, Monyer H, Seeburg PH. Hippocampal synaptic plasticity, spatial memory and anxiety. Nat Rev Neurosci. 2014;15:181–192. doi: 10.1038/nrn3677. [DOI] [PubMed] [Google Scholar]
- Barense MD, Groen II, Lee AC, Yeung LK, Brady SM, Gregori M, Kapur N, Bussey TJ, Saksida LM, Henson RN. Intact memory for irrelevant information impairs perception in amnesia. Neuron. 2012;75:157–167. doi: 10.1016/j.neuron.2012.05.014. [DOI] [PMC free article] [PubMed] [Google Scholar]
- Baria AT, Mansour A, Huang L, Baliki MN, Cecchi GA, Mesulam MM, Apkarian AV. Linking human brain local activity fluctuations to structural and functional network architectures. Neuroimage. 2013;73:144–155. doi: 10.1016/j.neuroimage.2013.01.072. [DOI] [PMC free article] [PubMed] [Google Scholar]
- Bartels A, Logothetis NK, Moutoussis K. fMRI and its interpretations: an illustration on directional selectivity in area V5/MT. Trends Neurosci. 2008;31:444–453. doi: 10.1016/j.tins.2008.06.004. [DOI] [PubMed] [Google Scholar]
- Baumann O, Mattingley JB. Dissociable representations of environmental size and complexity in the human hippocampus. J Neurosci. 2013;33:10526–10533. doi: 10.1523/JNEUROSCI.0350-13.2013. [DOI] [PMC free article] [PubMed] [Google Scholar]
- Behrens TE, Johansen-Berg H, Woolrich MW, Smith SM, Wheeler-Kingshott CA, Boulby PA, Barker GJ, Sillery EL, Sheehan K, Ciccarelli O, Thompson AJ, Brady JM, Matthews PM. Non-invasive mapping of connections between human thalamus and cortex using diffusion imaging. Nat Neurosci. 2003;6:750–757. doi: 10.1038/nn1075. [DOI] [PubMed] [Google Scholar]
- Belujon P, Grace AA. Critical role of the prefrontal cortex in the regulation of hippocampus-accumbens information flow. J Neurosci. 2008;28:9797–9805. doi: 10.1523/JNEUROSCI.2200-08.2008. [DOI] [PMC free article] [PubMed] [Google Scholar]
- Belujon P, Grace AA. Restoring mood balance in depression: ketamine reverses deficit in dopamine-dependent synaptic plasticity. Biol Psychiatry. 2014;76:927–936. doi: 10.1016/j.biopsych.2014.04.014. [DOI] [PMC free article] [PubMed] [Google Scholar]
- Bernal-Casas D, Balaguer-Ballester E, Gerchen MF, Iglesias S, Walter H, Heinz A, Meyer-Lindenberg A, Stephan KE, Kirsch P. Multi-site reproducibility of prefrontal-hippocampal connectivity estimates by stochastic DCM. Neuroimage. 2013;82:555–563. doi: 10.1016/j.neuroimage.2013.05.120. [DOI] [PubMed] [Google Scholar]
- Bonnici HM, Chadwick MJ, Kumaran D, Hassabis D, Weiskopf N, Maguire EA. Multi-voxel pattern analysis in human hippocampal subfields. Front Hum Neurosci. 2012;6:290. doi: 10.3389/fnhum.2012.00290. [DOI] [PMC free article] [PubMed] [Google Scholar]
- Bower GH. Mood and memory. Am Psychol. 1981;36:129–148. doi: 10.1037//0003-066x.36.2.129. [DOI] [PubMed] [Google Scholar]
- Buckley MJ. The role of the perirhinal cortex and hippocampus in learning, memory, and perception. Q J Exp Psychol B. 2005;58:246–268. doi: 10.1080/02724990444000186. [DOI] [PubMed] [Google Scholar]
- Bzdok D, Laird AR, Zilles K, Fox PT, Eickhoff SB. An investigation of the structural, connectional, and functional subspecialization in the human amygdala. Hum Brain Mapp. 2013;34:3247–3266. doi: 10.1002/hbm.22138. [DOI] [PMC free article] [PubMed] [Google Scholar]
- Bzdok D, Langner R, Schilbach L, Jakobs O, Roski C, Caspers S, Laird AR, Fox PT, Zilles K, Eickhoff SB. Characterization of the temporo-parietal junction by combining data-driven parcellation, complementary connectivity analyses, and functional decoding. Neuroimage. 2013;81:381–392. doi: 10.1016/j.neuroimage.2013.05.046. [DOI] [PMC free article] [PubMed] [Google Scholar]
- Caine SB, Humby T, Robbins TW, Everitt BJ. Behavioral effects of psychomotor stimulants in rats with dorsal or ventral subiculum lesions: locomotion, cocaine self-administration, and prepulse inhibition of startle. Behav Neurosci. 2001;115:880–894. doi: 10.1037//0735-7044.115.4.880. [DOI] [PubMed] [Google Scholar]
- Carr VA, Engel SA, Knowlton BJ. Top-down modulation of hippocampal encoding activity as measured by high-resolution functional MRI. Neuropsychologia. 2013;51:1829–1837. doi: 10.1016/j.neuropsychologia.2013.06.026. [DOI] [PMC free article] [PubMed] [Google Scholar]
- Carr VA, Rissman J, Wagner AD. Imaging the human medial temporal lobe with high-resolution fMRI. Neuron. 2010;65:298–308. doi: 10.1016/j.neuron.2009.12.022. [DOI] [PMC free article] [PubMed] [Google Scholar]
- Caspers S, Zilles K, Laird AR, Eickhoff SB. ALE meta-analysis of action observation and imitation in the human brain. Neuroimage. 2010;50:1148–1167. doi: 10.1016/j.neuroimage.2009.12.112. [DOI] [PMC free article] [PubMed] [Google Scholar]
- Champod AS, Petrides M. Dissociable roles of the posterior parietal and the prefrontal cortex in manipulation and monitoring processes. Proc Natl Acad Sci U S A. 2007;104:14837–14842. doi: 10.1073/pnas.0607101104. [DOI] [PMC free article] [PubMed] [Google Scholar]
- Cieslik EC, Zilles K, Caspers S, Roski C, Kellermann TS, Jakobs O, Langner R, Laird AR, Fox PT, Eickhoff SB. Is There “One” DLPFC in Cognitive Action Control? Evidence for Heterogeneity From Co-Activation-Based Parcellation. Cereb Cortex. 2013;23:2677–2689. doi: 10.1093/cercor/bhs256. [DOI] [PMC free article] [PubMed] [Google Scholar]
- Clos M, Amunts K, Laird AR, Fox PT, Eickhoff SB. Tackling the multifunctional nature of Broca’s region meta-analytically: Co-activation-based parcellation of area 44. Neuroimage. 2013;83C:174–188. doi: 10.1016/j.neuroimage.2013.06.041. [DOI] [PMC free article] [PubMed] [Google Scholar]
- Clos M, Rottschy C, Laird AR, Fox PT, Eickhoff SB. Comparison of structural covariance with functional connectivity approaches exemplified by an investigation of the left anterior insula. Neuroimage. 2014;99:269–280. doi: 10.1016/j.neuroimage.2014.05.030. [DOI] [PMC free article] [PubMed] [Google Scholar]
- Crossley NA, Mechelli A, Vertes PE, Winton-Brown TT, Patel AX, Ginestet CE, McGuire P, Bullmore ET. Cognitive relevance of the community structure of the human brain functional coactivation network. Proc Natl Acad Sci U S A. 2013;110:11583–11588. doi: 10.1073/pnas.1220826110. [DOI] [PMC free article] [PubMed] [Google Scholar]
- Damoiseaux JS, Greicius MD. Greater than the sum of its parts: a review of studies combining structural connectivity and resting-state functional connectivity. Brain Struct Funct. 2009;213:525–533. doi: 10.1007/s00429-009-0208-6. [DOI] [PubMed] [Google Scholar]
- Di X, Gohel S, Kim EH, Biswal BB. Task vs. rest-different network configurations between the coactivation and the resting-state brain networks. Front Hum Neurosci. 2013;7:493. doi: 10.3389/fnhum.2013.00493. [DOI] [PMC free article] [PubMed] [Google Scholar]
- Dosenbach NU, Visscher KM, Palmer ED, Miezin FM, Wenger KK, Kang HC, Burgund ED, Grimes AL, Schlaggar BL, Petersen SE. A core system for the implementation of task sets. Neuron. 2006;50:799–812. doi: 10.1016/j.neuron.2006.04.031. [DOI] [PMC free article] [PubMed] [Google Scholar]
- Duncan J, Owen AM. Common regions of the human frontal lobe recruited by diverse cognitive demands. Trends Neurosci. 2000;23:475–483. doi: 10.1016/s0166-2236(00)01633-7. [DOI] [PubMed] [Google Scholar]
- Duvernoy HM. The human hippocampus: functional anatomy, vascularization, and serial sections with MRI. 3. Springer; Berlin; New York: 2005. [Google Scholar]
- Eickhoff SB, Bzdok D, Laird AR, Kurth F, Fox PT. Activation likelihood estimation meta-analysis revisited. Neuroimage. 2012;59:2349–2361. doi: 10.1016/j.neuroimage.2011.09.017. [DOI] [PMC free article] [PubMed] [Google Scholar]
- Eickhoff SB, Bzdok D, Laird AR, Roski C, Caspers S, Zilles K, Fox PT. Co-activation patterns distinguish cortical modules, their connectivity and functional differentiation. Neuroimage. 2011;57:938–949. doi: 10.1016/j.neuroimage.2011.05.021. [DOI] [PMC free article] [PubMed] [Google Scholar]
- Eickhoff SB, Laird AR, Fox PT, Bzdok D, Hensel L. Functional segregation of the human dorsomedial prefrontal cortex. Cereb Cortex. 2014 doi: 10.1093/cercor/bhu250. pii: bhu250. [Epub ahead of print] [DOI] [PMC free article] [PubMed] [Google Scholar]
- Eickhoff SB, Laird AR, Grefkes C, Wang LE, Zilles K, Fox PT. Coordinate-based activation likelihood estimation meta-analysis of neuroimaging data: a random-effects approach based on empirical estimates of spatial uncertainty. Hum Brain Mapp. 2009;30:2907–2926. doi: 10.1002/hbm.20718. [DOI] [PMC free article] [PubMed] [Google Scholar]
- Eickhoff SB, Stephan KE, Mohlberg H, Grefkes C, Fink GR, Amunts K, Zilles K. A new SPM toolbox for combining probabilistic cytoarchitectonic maps and functional imaging data. Neuroimage. 2005;25:1325–1335. doi: 10.1016/j.neuroimage.2004.12.034. [DOI] [PubMed] [Google Scholar]
- Fanselow MS, Dong HW. Are the dorsal and ventral hippocampus functionally distinct structures? Neuron. 2010;65:7–19. doi: 10.1016/j.neuron.2009.11.031. [DOI] [PMC free article] [PubMed] [Google Scholar]
- Floresco SB, Grace AA. Gating of hippocampal-evoked activity in prefrontal cortical neurons by inputs from the mediodorsal thalamus and ventral tegmental area. J Neurosci. 2003;23:3930–3943. doi: 10.1523/JNEUROSCI.23-09-03930.2003. [DOI] [PMC free article] [PubMed] [Google Scholar]
- Fornito A, Harrison BJ, Zalesky A, Simons JS. Competitive and cooperative dynamics of large-scale brain functional networks supporting recollection. Proc Natl Acad Sci U S A. 2012;109:12788–12793. doi: 10.1073/pnas.1204185109. [DOI] [PMC free article] [PubMed] [Google Scholar]
- Fox PT, Lancaster JL. Opinion: Mapping context and content: the BrainMap model. Nat Rev Neurosci. 2002;3:319–321. doi: 10.1038/nrn789. [DOI] [PubMed] [Google Scholar]
- French SJ, Hailstone JC, Totterdell S. Basolateral amygdala efferents to the ventral subiculum preferentially innervate pyramidal cell dendritic spines. Brain Res. 2003;981:160–167. doi: 10.1016/s0006-8993(03)03017-8. [DOI] [PubMed] [Google Scholar]
- Gill KM, Grace AA. Heterogeneous processing of amygdala and hippocampal inputs in the rostral and caudal subregions of the nucleus accumbens. Int J Neuropsychopharmacol. 2011;14:1301–1314. doi: 10.1017/S1461145710001586. [DOI] [PMC free article] [PubMed] [Google Scholar]
- Gill KM, Grace AA. Differential effects of acute and repeated stress on hippocampus and amygdala inputs to the nucleus accumbens shell. Int J Neuropsychopharmacol. 2013;16:2013–2025. doi: 10.1017/S1461145713000618. [DOI] [PMC free article] [PubMed] [Google Scholar]
- Grace AA. Dopamine system dysregulation by the ventral subiculum as the common pathophysiological basis for schizophrenia psychosis, psychostimulant abuse, and stress. Neurotox Res. 2010;18:367–376. doi: 10.1007/s12640-010-9154-6. [DOI] [PMC free article] [PubMed] [Google Scholar]
- Grace AA. Dopamine system dysregulation by the hippocampus: implications for the pathophysiology and treatment of schizophrenia. Neuropharmacology. 2012;62:1342–1348. doi: 10.1016/j.neuropharm.2011.05.011. [DOI] [PMC free article] [PubMed] [Google Scholar]
- Groenewegen HJ, Vermeulen-Van der Zee E, te Kortschot A, Witter MP. Organization of the projections from the subiculum to the ventral striatum in the rat. A study using anterograde transport of Phaseolus vulgaris leucoagglutinin. Neuroscience. 1987;23:103–120. doi: 10.1016/0306-4522(87)90275-2. [DOI] [PubMed] [Google Scholar]
- Habib R, Nyberg L, Tulving E. Hemispheric asymmetries of memory: the HERA model revisited. Trends Cogn Sci. 2003;7:241–245. doi: 10.1016/s1364-6613(03)00110-4. [DOI] [PubMed] [Google Scholar]
- Hartigan JA, Wong MA. A k-means clustering algorithm. Applied Statistics. 1979;28:100–108. [Google Scholar]
- Hassabis D, Maguire EA. Deconstructing episodic memory with construction. Trends Cogn Sci. 2007;11:299–306. doi: 10.1016/j.tics.2007.05.001. [DOI] [PubMed] [Google Scholar]
- Henson R. A mini-review of fMRI studies of human medial temporal lobe activity associated with recognition memory. Q J Exp Psychol B. 2005;58:340–360. doi: 10.1080/02724990444000113. [DOI] [PubMed] [Google Scholar]
- Herman JP, Mueller NK. Role of the ventral subiculum in stress integration. Behav Brain Res. 2006;174:215–224. doi: 10.1016/j.bbr.2006.05.035. [DOI] [PubMed] [Google Scholar]
- Hermundstad AM, Brown KS, Bassett DS, Aminoff EM, Frithsen A, Johnson A, Tipper CM, Miller MB, Grafton ST, Carlson JM. Structurally-constrained relationships between cognitive states in the human brain. PLoS Comput Biol. 2014;10:e1003591. doi: 10.1371/journal.pcbi.1003591. [DOI] [PMC free article] [PubMed] [Google Scholar]
- Hirshhorn M, Grady C, Rosenbaum RS, Winocur G, Moscovitch M. Brain regions involved in the retrieval of spatial and episodic details associated with a familiar environment: an fMRI study. Neuropsychologia. 2012;50:3094–3106. doi: 10.1016/j.neuropsychologia.2012.08.008. [DOI] [PubMed] [Google Scholar]
- Insausti R, Munoz M. Cortical projections of the non-entorhinal hippocampal formation in the cynomolgus monkey (Macaca fascicularis) Eur J Neurosci. 2001;14:435–451. doi: 10.1046/j.0953-816x.2001.01662.x. [DOI] [PubMed] [Google Scholar]
- Jakobs O, Langner R, Caspers S, Roski C, Cieslik EC, Zilles K, Laird AR, Fox PT, Eickhoff SB. Across-study and within-subject functional connectivity of a right temporo-parietal junction subregion involved in stimulus-context integration. Neuroimage. 2012;60:2389–2398. doi: 10.1016/j.neuroimage.2012.02.037. [DOI] [PMC free article] [PubMed] [Google Scholar]
- Kahn I, Shohamy D. Intrinsic connectivity between the hippocampus, nucleus accumbens, and ventral tegmental area in humans. Hippocampus. 2013;23:187–192. doi: 10.1002/hipo.22077. [DOI] [PMC free article] [PubMed] [Google Scholar]
- Kahnt T, Chang LJ, Park SQ, Heinzle J, Haynes JD. Connectivity-based parcellation of the human orbitofrontal cortex. J Neurosci. 2012;32:6240–6250. doi: 10.1523/JNEUROSCI.0257-12.2012. [DOI] [PMC free article] [PubMed] [Google Scholar]
- Kelley WM, Miezin FM, McDermott KB, Buckner RL, Raichle ME, Cohen NJ, Ollinger JM, Akbudak E, Conturo TE, Snyder AZ, Petersen SE. Hemispheric specialization in human dorsal frontal cortex and medial temporal lobe for verbal and nonverbal memory encoding. Neuron. 1998;20:927–936. doi: 10.1016/s0896-6273(00)80474-2. [DOI] [PubMed] [Google Scholar]
- Kennepohl S, Sziklas V, Garver KE, Wagner DD, Jones-Gotman M. Memory and the medial temporal lobe: hemispheric specialization reconsidered. Neuroimage. 2007;36:969–978. doi: 10.1016/j.neuroimage.2007.03.049. [DOI] [PubMed] [Google Scholar]
- Ketz NA, Jensen O, O’Reilly RC. Thalamic pathways underlying prefrontal cortex–medial temporal lobe oscillatory interactions. Trends Neurosci. 2015;38(1):3–12. doi: 10.1016/j.tins.2014.09.007. [DOI] [PubMed] [Google Scholar]
- Kuhn S, Gallinat J. Segregating cognitive functions within hippocampal formation: a quantitative meta-analysis on spatial navigation and episodic memory. Hum Brain Mapp. 2014;35:1129–1142. doi: 10.1002/hbm.22239. [DOI] [PMC free article] [PubMed] [Google Scholar]
- Laird AR, Eickhoff SB, Fox PM, Uecker AM, Ray KL, Saenz JJ, Jr, McKay DR, Bzdok D, Laird RW, Robinson JL, Turner JA, Turkeltaub PE, Lancaster JL, Fox PT. The BrainMap strategy for standardization, sharing, and meta-analysis of neuroimaging data. BMC Res Notes. 2011;4:349. doi: 10.1186/1756-0500-4-349. [DOI] [PMC free article] [PubMed] [Google Scholar]
- Libby LA, Ekstrom AD, Ragland JD, Ranganath C. Differential connectivity of perirhinal and parahippocampal cortices within human hippocampal subregions revealed by high-resolution functional imaging. J Neurosci. 2012;32:6550–6560. doi: 10.1523/JNEUROSCI.3711-11.2012. [DOI] [PMC free article] [PubMed] [Google Scholar]
- Lipski WJ, Grace AA. Footshock-induced responses in ventral subiculum neurons are mediated by locus coeruleus noradrenergic afferents. Eur Neuropsychopharmacol. 2013;23:1320–1328. doi: 10.1016/j.euroneuro.2012.10.007. [DOI] [PMC free article] [PubMed] [Google Scholar]
- Lisman JE, Grace AA. The hippocampal-VTA loop: controlling the entry of information into long-term memory. Neuron. 2005;46:703–713. doi: 10.1016/j.neuron.2005.05.002. [DOI] [PubMed] [Google Scholar]
- Lodge DJ, Grace AA. The hippocampus modulates dopamine neuron responsivity by regulating the intensity of phasic neuron activation. Neuropsychopharmacology. 2006;31:1356–1361. doi: 10.1038/sj.npp.1300963. [DOI] [PubMed] [Google Scholar]
- Lodge DJ, Grace AA. Amphetamine activation of hippocampal drive of mesolimbic dopamine neurons: a mechanism of behavioral sensitization. J Neurosci. 2008;28:7876–7882. doi: 10.1523/JNEUROSCI.1582-08.2008. [DOI] [PMC free article] [PubMed] [Google Scholar]
- Lodge DJ, Grace AA. Hippocampal dysregulation of dopamine system function and the pathophysiology of schizophrenia. Trends Pharmacol Sci. 2011;32:507–513. doi: 10.1016/j.tips.2011.05.001. [DOI] [PMC free article] [PubMed] [Google Scholar]
- Lowry CA. Functional subsets of serotonergic neurones: implications for control of the hypothalamic-pituitary-adrenal axis. J Neuroendocrinol. 2002;14:911–923. doi: 10.1046/j.1365-2826.2002.00861.x. [DOI] [PubMed] [Google Scholar]
- Lu H, Zou Q, Gu H, Raichle ME, Stein EA, Yang Y. Rat brains also have a default mode network. Proc Natl Acad Sci U S A. 2012;109:3979–3984. doi: 10.1073/pnas.1200506109. [DOI] [PMC free article] [PubMed] [Google Scholar]
- Meila M. Comparing clusterings - an information based distance. Journal of Multivariate Analysis. 2007;98:873–895. [Google Scholar]
- Mennes M, Kelly C, Colcombe S, Castellanos FX, Milham MP. The extrinsic and intrinsic functional architectures of the human brain are not equivalent. Cereb Cortex. 2013;23:223–229. doi: 10.1093/cercor/bhs010. [DOI] [PMC free article] [PubMed] [Google Scholar]
- Messe A, Rudrauf D, Benali H, Marrelec G. Relating structure and function in the human brain: relative contributions of anatomy, stationary dynamics, and non-stationarities. PLoS Comput Biol. 2014;10:e1003530. doi: 10.1371/journal.pcbi.1003530. [DOI] [PMC free article] [PubMed] [Google Scholar]
- Murty VP, Ritchey M, Adcock RA, LaBar KS. fMRI studies of successful emotional memory encoding: A quantitative meta-analysis. Neuropsychologia. 2010;48:3459–3469. doi: 10.1016/j.neuropsychologia.2010.07.030. [DOI] [PMC free article] [PubMed] [Google Scholar]
- Naber PA, Witter MP, Lopes Silva FH. Networks of the hippocampal memory system of the rat. The pivotal role of the subiculum. Ann N Y Acad Sci. 2000;911:392–403. doi: 10.1111/j.1749-6632.2000.tb06739.x. [DOI] [PubMed] [Google Scholar]
- Nadel L, Hoscheidt S, Ryan LR. Spatial cognition and the hippocampus: the anterior-posterior axis. J Cogn Neurosci. 2013;25:22–28. doi: 10.1162/jocn_a_00313. [DOI] [PubMed] [Google Scholar]
- O’Mara S. Controlling hippocampal output: the central role of subiculum in hippocampal information processing. Behav Brain Res. 2006;174:304–312. doi: 10.1016/j.bbr.2006.08.018. [DOI] [PubMed] [Google Scholar]
- Poppenk J, Evensmoen HR, Moscovitch M, Nadel L. Long-axis specialization of the human hippocampus. Trends Cogn Sci. 2013;17:230–240. doi: 10.1016/j.tics.2013.03.005. [DOI] [PubMed] [Google Scholar]
- Raichle ME, MacLeod AM, Snyder AZ, Powers WJ, Gusnard DA, Shulman GL. A default mode of brain function. Proc Natl Acad Sci U S A. 2001;98:676–682. doi: 10.1073/pnas.98.2.676. [DOI] [PMC free article] [PubMed] [Google Scholar]
- Rottschy C, Caspers S, Roski C, Reetz K, Dogan I, Schulz JB, Zilles K, Laird AR, Fox PT, Eickhoff SB. Differentiated parietal connectivity of frontal regions for “what” and “where” memory. Brain Struct Funct. 2013;218:1551–1567. doi: 10.1007/s00429-012-0476-4. [DOI] [PMC free article] [PubMed] [Google Scholar]
- Satterthwaite TD, Wolf DH, Loughead J, Ruparel K, Elliott MA, Hakonarson H, Gur RC, Gur RE. Impact of in-scanner head motion on multiple measures of functional connectivity: relevance for studies of neurodevelopment in youth. Neuroimage. 2012;60:623–632. doi: 10.1016/j.neuroimage.2011.12.063. [DOI] [PMC free article] [PubMed] [Google Scholar]
- Saunders RC, Mishkin M, Aggleton JP. Projections from the entorhinal cortex, perirhinal cortex, presubiculum, and parasubiculum to the medial thalamus in macaque monkeys: identifying different pathways using disconnection techniques. Exp Brain Res. 2005;167:1–16. doi: 10.1007/s00221-005-2361-3. [DOI] [PubMed] [Google Scholar]
- Schilbach L, Bzdok D, Timmermans B, Fox PT, Laird AR, Vogeley K, Eickhoff SB. Introspective minds: using ALE meta-analyses to study commonalities in the neural correlates of emotional processing, social & unconstrained cognition. PLoS One. 2012;7:e30920. doi: 10.1371/journal.pone.0030920. [DOI] [PMC free article] [PubMed] [Google Scholar]
- Schott BH, Minuzzi L, Krebs RM, Elmenhorst D, Lang M, Winz OH, Seidenbecher CI, Coenen HH, Heinze HJ, Zilles K, Duzel E, Bauer A. Mesolimbic functional magnetic resonance imaging activations during reward anticipation correlate with reward-related ventral striatal dopamine release. J Neurosci. 2008;28:14311–14319. doi: 10.1523/JNEUROSCI.2058-08.2008. [DOI] [PMC free article] [PubMed] [Google Scholar]
- Sesack SR, Grace AA. Cortico-Basal Ganglia reward network: microcircuitry. Neuropsychopharmacology. 2010;35:27–47. doi: 10.1038/npp.2009.93. [DOI] [PMC free article] [PubMed] [Google Scholar]
- Stone JM, Howes OD, Egerton A, Kambeitz J, Allen P, Lythgoe DJ, O’Gorman RL, McLean MA, Barker GJ, McGuire P. Altered relationship between hippocampal glutamate levels and striatal dopamine function in subjects at ultra high risk of psychosis. Biol Psychiatry. 2010;68:599–602. doi: 10.1016/j.biopsych.2010.05.034. [DOI] [PubMed] [Google Scholar]
- Strange BA, Fletcher PC, Henson RN, Friston KJ, Dolan RJ. Segregating the functions of human hippocampus. Proc Natl Acad Sci U S A. 1999;96:4034–4039. doi: 10.1073/pnas.96.7.4034. [DOI] [PMC free article] [PubMed] [Google Scholar]
- Strange BA, Witter MP, Lein ES, Moser EI. Functional organization of the hippocampal longitudinal axis. Nat Rev Neurosci. 2014;15:655–669. doi: 10.1038/nrn3785. [DOI] [PubMed] [Google Scholar]
- Suthana N, Ekstrom A, Moshirvaziri S, Knowlton B, Bookheimer S. Dissociations within human hippocampal subregions during encoding and retrieval of spatial information. Hippocampus. 2011;21:694–701. doi: 10.1002/hipo.20833. [DOI] [PMC free article] [PubMed] [Google Scholar]
- Turkeltaub PE, Eden GF, Jones KM, Zeffiro TA. Meta-analysis of the functional neuroanatomy of single-word reading: method and validation. Neuroimage. 2002;16:765–780. doi: 10.1006/nimg.2002.1131. [DOI] [PubMed] [Google Scholar]
- Turkeltaub PE, Eickhoff SB, Laird AR, Fox M, Wiener M, Fox P. Minimizing within-experiment and within-group effects in Activation Likelihood Estimation meta-analyses. Hum Brain Mapp. 2012;33:1–13. doi: 10.1002/hbm.21186. [DOI] [PMC free article] [PubMed] [Google Scholar]
- Uddin LQ, Kelly AM, Biswal BB, Castellanos FX, Milham MP. Functional connectivity of default mode network components: correlation, anticorrelation, and causality. Hum Brain Mapp. 2009;30:625–637. doi: 10.1002/hbm.20531. [DOI] [PMC free article] [PubMed] [Google Scholar]
- Valenti O, Lodge DJ, Grace AA. Aversive stimuli alter ventral tegmental area dopamine neuron activity via a common action in the ventral hippocampus. J Neurosci. 2011;31:4280–4289. doi: 10.1523/JNEUROSCI.5310-10.2011. [DOI] [PMC free article] [PubMed] [Google Scholar]
- Van Dijk KR, Hedden T, Venkataraman A, Evans KC, Lazar SW, Buckner RL. Intrinsic functional connectivity as a tool for human connectomics: theory, properties, and optimization. J Neurophysiol. 2010;103:297–321. doi: 10.1152/jn.00783.2009. [DOI] [PMC free article] [PubMed] [Google Scholar]
- Voets NL, Zamboni G, Stokes MG, Carpenter K, Stacey R, Adcock JE. Aberrant functional connectivity in dissociable hippocampal networks is associated with deficits in memory. J Neurosci. 2014;34:4920–4928. doi: 10.1523/JNEUROSCI.4281-13.2014. [DOI] [PMC free article] [PubMed] [Google Scholar]
- Voorn P, Vanderschuren LJ, Groenewegen HJ, Robbins TW, Pennartz CM. Putting a spin on the dorsal-ventral divide of the striatum. Trends Neurosci. 2004;27:468–474. doi: 10.1016/j.tins.2004.06.006. [DOI] [PubMed] [Google Scholar]
- Witter MP. Connections of the subiculum of the rat: topography in relation to columnar and laminar organization. Behav Brain Res. 2006;174:251–264. doi: 10.1016/j.bbr.2006.06.022. [DOI] [PubMed] [Google Scholar]
- Wright NF, Vann SD, Erichsen JT, O’Mara SM, Aggleton JP. Segregation of parallel inputs to the anteromedial and anteroventral thalamic nuclei of the rat. J Comp Neurol. 2013;521:2966–2986. doi: 10.1002/cne.23325. [DOI] [PMC free article] [PubMed] [Google Scholar]
Associated Data
This section collects any data citations, data availability statements, or supplementary materials included in this article.