

Abstract
Simultaneous multi-slice (SMS) or multiband (MB) imaging has recently been attempted for arterial spin labeled (ASL) perfusion MRI in conjunction with echo-planar imaging (EPI) readout. It was found that SMS-EPI can reduce the T1 relaxation effect of the label, improve image coverage and resolution with little penalty in signal-to-noise ratio (SNR). However, EPI still suffers from geometric distortion and signal dropout from field inhomogeneity effects especially at high and ultrahigh magnetic fields. Here we present a novel scheme for achieving high fidelity distortion-free quantitative perfusion imaging by combining pseudo-continuous ASL (pCASL) with SMS Turbo-FLASH (TFL) readout at both 3 and 7 Tesla. Bloch equation simulation was performed to characterize and optimize the TFL-based pCASL perfusion signal. Two MB factors (3 and 5) were implemented in SMS-TFL pCASL and compared with standard 2D TFL and EPI pCASL sequences. The temporal SNR of SMS-TFL pCASL relative to that of standard TFL pCASL was 0.76±0.10 and 0.74±0.11 at 7T, 0.70±0.05 and 0.65±0.05 at 3T for MB factor of 3 and 5, respectively. By implementing background suppression in conjunction with SMS-TFL at 3T, the relative temporal SNR improved to 0.84±0.09 and 0.79±0.10 for MB factor of 3 and 5 respectively. Compared to EPI pCASL, significantly increased temporal SNR (p<0.001) and improved visualization of orbitofrontal cortex were achieved using SMS-TFL pCASL. By combining SMS acceleration with TFL pCASL, we demonstrated the feasibility for whole brain distortion-free quantitative mapping of cerebral blood flow at high and ultrahigh magnetic fields.
Keywords: Arterial spin labeling (ASL), Simultaneous multi-slice (SMS), Multiband (MB), Turbo-FLASH (TFL), Cerebral blood flow (CBF)
Introduction
Arterial spin labeling (ASL) is a perfusion MRI technique that allows absolute cerebral blood flow (CBF) quantification by utilizing magnetically labeled arterial blood water as an endogenous tracer (Detre et al., 1992; Williams et al., 1992). Due to its noninvasive nature and the capability for absolute CBF quantification, ASL perfusion techniques have found a broad range of applications in clinical neuroscience (Borogovac and Asllani, 2012; Detre et al., 2009; Wolf and Detre, 2007). Further, ASL perfusion-based functional MRI (fMRI) has been utilized to study neural activation and functional connectivity of brain networks because of the close coupling between CBF and neuronal activities (Raichle, 1998).
However, measurements of CBF using ASL remain challenging primarily due to the limitations in the intrinsically low fraction of arterial flow (~1%), as well as the time constraint placed on the post-labeling delay (PLD) and readout acquisition window by T1 relaxation of the labeled blood (1–2 sec). During the past decade, several key technologies have been developed to maximize the signal-to-noise ratio (SNR) of ASL scans, including pseudo-continuous ASL (pCASL) (Dai et al., 2008; Wu et al., 2007), background suppression (BS) and three-dimensional (3D) fast imaging sequences such as GRASE (a hybrid of gradient and spin echo) and Stack-of-Spirals, as summarized in the recent ASL white paper (Alsop et al., 2014). In addition to software innovations, MR hardware has undergone major development and upgrades including high and ultrahigh whole-body human magnets, faster and stronger gradients, high-density phased array coils, as well as high order shimming systems. These hardware advances provide the foundation for continued technical innovations to improve the SNR and image quality of ASL, as well as of other MRI modalities. For instance, pCASL at 7T should theoretically offer a four-fold SNR gain compared to pCASL at 3T (Zuo et al., 2013).
An emerging fast imaging technique that has drawn growing research interest is simultaneous multi-slice (SMS) or multiband (MB) imaging (Larkman et al., 2001; Moeller et al., 2010; Setsompop et al., 2012). In the SMS technique, MB composite RF pulses are applied to excite multiple imaging slices simultaneously, followed by separation of imaging slices by utilizing the spatial sensitivity profile of the phased array coil. While conceptually similar to parallel imaging, there is no undersampling SNR penalty using SMS methods, only the g-factor imposed by the coil geometry (Setsompop et al., 2012). In addition, the controlled aliasing method —controlled aliasing in parallel imaging results in higher acceleration (CAIPIRINHA) (Breuer et al., 2005) was developed to allow higher MB acceleration factors by modulating the phase of the MB excitation pulses, so that the aliased slices are shifted in space resulting in a reduced and more uniform g-factor distribution.
The high spatial and temporal resolution of SMS imaging has enabled large scale mapping of structural (diffusion MRI) and functional connectivity (resting-state fMRI) of a human brain, as demonstrated by the Human Connectome Project (Smith et al., 2013; Sotiropoulos et al., 2013; Van Essen et al., 2012). SMS imaging may offer an appealing approach for ASL given that the labeling effect can be largely preserved during the accelerated image readout. Indeed, recent feasibility studies have implemented SMS imaging for pulsed-ASL (Feinberg et al., 2013; Kim et al., 2013) and pCASL (Li et al., 2015) using the blipped-CAIPI (Setsompop et al., 2012) based echo planar imaging (EPI) as the readout sequence. It has been shown that SMS acceleration can expedite the ASL image acquisition, thereby reducing the T1 relaxation effect of the labeled blood, and improving volume coverage and/or resolution with little penalty in SNR. To date, EPI is the most widely used imaging sequence for SMS based ASL, as well as for fMRI and diffusion MRI due to its high imaging speed. However, EPI still suffers from geometric distortion and signal dropout due to field inhomogeneity effects, especially at high and ultrahigh magnetic fields (Schmithorst et al., 2001). In the Human Connectome Project, high-resolution SMS-EPI scans are usually acquired twice with opposite phase-encoding (PE) directions to compensate for image distortions during post-processing (Smith et al., 2013; Sotiropoulos et al., 2013). Turbo-FLASH (TFL) offers a promising alternative imaging sequence at high and ultrahigh magnetic fields (Jahng et al., 2007; Wang et al., 2010; Zuo et al., 2013) because of its reasonably fast imaging time, relatively low specific absorption rate (SAR) of RF power, and minimal sensitivity to susceptibility effects due to the short echo time (TE). In addition, TFL is naturally suited for SMS imaging with the CAIPIRINHA technique.
The purpose of this work was to develop an SMS-TFL-based pCASL imaging technique to achieve whole brain distortion-free perfusion imaging at both 3 and 7T. Simulations were performed to characterize and optimize the TFL-based pCASL perfusion signal. The impact of varying MB factors on the SMS-TFL image quality and CBF quantifications were evaluated and compared to a standard two-dimensional (2D) TFL and EPI pCASL sequence. Background suppression (BS) was further implemented in conjunction with SMS-TFL at 3T to assess its effect on temporal SNR. By combining SMS acceleration with TFL imaging, we demonstrated the feasibility for distortion-free quantitative CBF mapping at high and ultrahigh magnetic fields.
Methods
Imaging sequence
Figure 1(a) shows the pulse sequence diagram of the SMS-TFL-based pCASL sequence. The pCASL magnetization preparation was performed with balanced gradients between labeling and control image acquisitions, with the labeling plane placed 90 mm below the center of imaging slab at 3T, as illustrated by the purple box in Fig. 1(b). After the PLD time, the TFL readout with centric phase encoding (PE) ordering was employed to maximize the flow contrast. To expedite the imaging acquisition, multiple imaging planes were excited simultaneously by the MB composite RF pulse. As an option, BS was implemented by applying two non-selective hyperbolic secant (HS) inversion pulses during the PLD. The first HS pulse (duration of 15 ms) was applied immediately following the labeling pulses while the inversion time of the second HS pulse was adjusted (850 ms), i.e., the time duration from the end of the pCASL labeling pulses to the second HS pulse. Given that SMS-TFL is a 2D readout sequence, on average ~65% suppression was achieved for brain tissue magnetization at 3T.
Figure 1.

Schematic diagram of SMS-TFL pCASL pulse sequence and the corresponding imaging acquisition strategy. (a) A pCASL prepared SMS-TFL sequence. (b) Relative positioning of the labeling plane (purple), shimming volume (yellow box), the dielectric pad (pink) and the imaging slices (read, blue and green lines) for SB, MB-3 and MB-5. The 3rd-order shimming and the dielectric pad were only applied for 7T imaging. The diagram illustrates an example where three slices were acquired in the SB imaging. Slices with the same colors denote imaging planes that were simultaneously excited by the MB pulse and readout by the same 2D TFL sequence. (c) The corresponding example axial images from the SMS-TFL readout. SB (top), MB-3 (middle) and MB-5 (bottom).
The SMS imaging and the labeling scheme are demonstrated in Fig. 1(b). Imaging slices that were excited simultaneously by the MB excitation pulses are displayed in the same color. Following each pCASL magnetization preparation, simultaneously excited slices (denoted by different colors) were read out sequentially. To improve the g-factor, the CAIPIRINHA technique was implemented with a FOV/3 shift along the PE direction for MB factors of 3 and 5. For comparison, a standard 2D EPI and a single band (SB) TFL pCASL scan were performed within similar image acquisition times as the MB-3 and MB-5 scans. Example images of SB, MB-3 and MB-5 TFL scans are shown in Fig. 1(c).
The SMS-TFL-based pCASL sequence at 7T was similar to the 3T version, except that linear PE ordering had to be applied for the TFL readout due to eddy-current related artifacts in centric ordering acquisitions (Bi et al., 2007; Park et al., 2013). In addition, BS was not implemented due to limitations in SAR and B1 inhomogeneity at 7T. The labeling plane was placed 75 mm below the center of imaging slab within the high (3rd) order shimming volume (yellow box in Fig. 1(b)).
Simulation
To characterize and optimize the TFL-based perfusion signal, Bloch equation simulation was performed to study the behavior of pCASL signal as a function of flip angle (FA) at both 3 and 7T. Potential signal blurring during TFL readout was also illustrated through simulation of the point spread function (PSF) of the signal evolution along the PE direction.
Under the assumption of single-compartment model where labeled blood stays in the vasculature, the standard pCASL signal can be expressed as (Wang et al., 2005):
| [1] |
where ΔM is the perfusion weighted signal, M0 is the equilibrium magnetization of brain tissue, α is the labeling efficiency, R1a is the longitudinal relaxation rate of blood, τ is the duration of pCASL tagging bolus, w is the PLD time, λ is the tissue-to-blood partition coefficient, δ is the arterial transit time and f is the CBF in units of ml/100g of tissue per minute.
Incorporating the train of RF excitations pulses from the TFL readout into the final perfusion weighted signal presentation, the TFL-based pCASL signal ΔS can be modeled as (Zuo et al., 2013):
| [2] |
where E1=e−TR/T1, θ is the FA of the RF excitation pulses in TFL, SM0 is the M0 signal (control image intensity), and j is the number of acquired PE lines till it reaches the center of k-space in the TFL readout. Since multiple MB slices are acquired sequentially after each pCASL preparation, the nominal PLD was adjusted for each slice according to w=PLD + n*Tacq, where Tacq is the imaging time for each 2D slice, and n is the index for the slice ordering. Note the effect of T2* relaxation was ignored due to the short TE (1.14 ms) of TFL sequence.
To assess the effect of FA and field strength on the perfusion weighted signal, TFL-based pCASL signal was simulated with θ varying from 4° to 12°, and T1 of 1660 ms (Lu et al., 2004) and 2290 ms (Rane and Gore, 2013) for 3 and 7T, respectively. The rest of the simulation parameters were: matrix size = 128×128, α=0.8, w = 1.2 sec, τ = 1.5 sec, repetition time (TR)/TE = 2.42/1.14 ms, and λ = 0.9 g/ml. Additionally, the signal decay along the PE direction due to T1 relaxation was represented by the PSF — Fourier transform of the signal evolution during the TFL readout. All the simulations were performed and displayed in MATLAB (The MathWorks, Natick, MA).
In vivo Imaging at 3 and 7T
Eleven healthy volunteers (23±3 years old, 6 females) were imaged on a 3T Siemens Tim Trio system at Ahmanson-Lovelace Brain Mapping Center, UCLA using a product 32-channel head receiver coil, and another five healthy volunteers (33±14 years old, 3 females) were imaged on a 7T Siemens whole-body Magnetom system (Siemens Medical Systems, Erlangen, Germany) at the Center for Magnetic Resonance Research (CMRR), University of Minnesota using a 32-channel RF receiver coil (Nova Medical, Cambridge, MA). All the subjects provided written informed consent based on the protocols approved by the local institutional review boards. Three, nine and fifteen axial slices were acquired using SMS-TFL with SB, MB-3, and MB-5 acquisitions, respectively. For direct comparison, positioning of the central three slices of the MB acquisitions was kept the same as that of the SB acquisition, as illustrated in Fig. 1(b). To improve the un-aliasing efficiency of the MB reconstruction, a FOV/3 shift along the PE direction was achieved by modulating the phases of the MB excitation pulses using the CAIPIRINHA technique (Breuer et al., 2005).
MRI Experiment at 3T
Ten of the eleven subjects underwent SB, MB-3 and MB-5 TFL pCASL scans during resting state. Among the ten subjects, five also underwent SMS-TFL acquisitions with BS. Image acquisition parameters were: FOV = 256 mm2, matrix size = 128×128, TR = 2.42 ms, TE = 1.14 ms, slice thickness = 5 mm, in-plane resolution = 2×2 mm2, inter-slice gap = 2 mm, asymmetric echo, 6/8 partial Fourier, PE direction A≪P, FA = 10°, bandwidth (BW) = 700–800 Hz/Px, and repetitions = 80. The readout duration for each 2D SB or MB slice was 250 ms. The distance between adjacent MB slices was 21 mm. Parameters for the pCASL labeling were: PLD = 1.2 sec, BS inversion time = 850 ms, labeling duration = 1.5 sec, and labeling offset = 90 mm. The total TR, including both labeling and image readout, for both SB and MB readout was 3450 ms. In addition, one subject underwent MB-3 TFL-pCASL scans at 3 different FA values of 6°, 8° and 10° to investigate the effect of FA on TFL-pCASL signal intensity and spatial smoothness, using otherwise identical imaging parameters as described above.
For comparison, a standard pCASL sequence with a 2D gradient-echo EPI readout was acquired for all subjects, with the same spatial resolution (2×2 mm2). The imaging parameters for 2D EPI pCASL were: FOV = 256 mm2, matrix size = 128×128, TR = 4160 ms, TE = 27 ms, BW = 2000 Hz/Px, slices = 15, slice thickness = 5 mm, slice acquisition time = 97 ms, 6/8 partial Fourier, and repetitions = 80. Slice positioning of the 15 slices of EPI images matched that of SMS-TFL with MB-5 acquisition. The image acquisition time for 2D SMS-TFL and EPI pCASL were 5:19 and 5:41 min, respectively.
MRI Experiment at 7T
For each of the five subjects, dielectric pads were applied around the bilateral, posterior and inferior regions near the cerebellum to improve B1 efficiency for pCASL (see Fig. 1(b)) (Teeuwisse et al., 2012). High (3rd) order shimming was performed within a shimming volume covering the whole brain and the labeling plane that was placed 75 mm from the center of imaging slab. The reference voltage was increased empirically by 10% based on the default value determined by pre-scan adjustment procedures (to achieve a 90° excitation), to compensate for the B1 drop in the labeling region. The FA (7°) was slightly lower than the optimal 8° determined by simulation to compensate for the increased B1 within the imaging volume. Other imaging parameters were also adjusted to meet the SAR limitations: pCASL labeling duration was shortened to 1 sec, and a pre-delay of 1–3 sec was inserted between measurements leading to an average TR of ~5 sec for SB, MB-3 and MB-5 acquisitions. Note the TRs of SB, MB-3 and MB-5 acquisitions were the same in individual subjects at 3 or 7T. Due to the use of linear PE ordering with full k-space acquisitions at 7T, each SB or MB slice readout time was 330 ms. The rest of the imaging parameters at 7T were identical to those at 3T.
Image Analysis
The aliased slices attained from the SMS-TFL sequence were reconstructed using the slice-GRAPPA algorithm with a kernel size of 3×3 (Setsompop et al., 2012). Furthermore, to remove data volumes with spikes or excessive motion, the root-mean-square (RMS) intensity difference between the individual raw image volume and the mean image of the time series was calculated. Outlier time points with significant movement and signal spikes were then identified using 1.5 times the inter-quartile range, i.e., threshold = p75 + 1.5 * (p75 – p25) (Power et al., 2012), where p25 and p75 represent the 25th and the 75th percentiles of the RMS intensity differences, respectively. Once a control or label image time-point was identified, the corresponding label-control pair was then removed from subsequent analyses. Pair-wise subtraction between adjacent control and label image series were averaged and resulted in the perfusion-weighted images, which were then converted into quantitative CBF maps using Eq. [2]. The labeling efficiency was previously estimated to be 0.85 at 3T (Wu et al., 2007) and 0.64 at 7T (Zuo et al., 2013).
The performance of the SMS-TFL image acquisition was evaluated by quantifying the spatial and temporal SNR based on the raw image and the perfusion-weighted images, respectively. Only the common slices shared between SB and MB scans were selected for the quantitative analysis (Kim et al., 2013). The odd- and even-numbered image series were separately averaged, which were used to calculate the sum and difference of these two images. The spatial SNR was defined as the average image intensity from gray matter in the sum image divided by the standard deviation (SD) of the image intensity from the same region of the difference image (Feinberg et al., 2013). The voxelwise temporal SNR was calculated as the mean signal intensity of the gray matter divided by the SD of the image intensity time series. In addition, region-of-interest (ROI) based CBF values were extracted from gray and white matter of the central three slices shared between SB and MB scans, as well as the medial orbitofrontal cortex (OFC). For comparison, the same analysis was applied on images acquired by the 2D EPI based pCASL scan, with gray and white matter masks obtained from the EPI control images. Statistical analysis was performed on quantified CBF values and the normalized temporal and spatial SNR (relative to SB TFL-pCASL) using ANOVA with within-subject factor ‘sequence’ (TFL MB-3, TFL MB-5 and EPI) and post-hoc paired t-test at the 5% significance level.
Results
Simulations
Simulated TFL-based pCASL perfusion signals as a function of FA are shown in Fig. 2(a), for both 3 and 7T. The maximum perfusion signal is attained at 10° and 8° for 3 and 7T, respectively.
Figure 2.
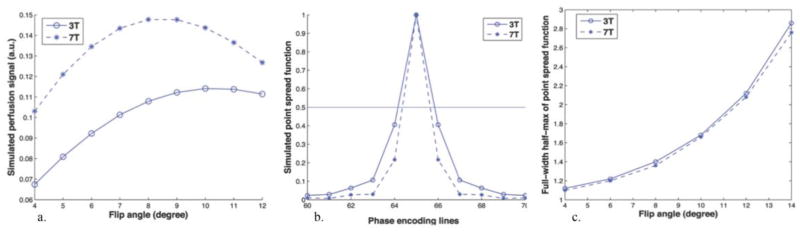
Simulation of the TFL-based pCASL signal and the point spread function (PSF) at both 3 and 7T. (a) Simulated pCASL signal as a function of flip angle. The maximum perfusion signal is attained at 10° and 8° for 3T (circle) and 7T (star), respectively. (b) Two representative PSFs of TFL readout with FA of 10° and 8° at 3 and 7T, respectively. The horizontal line indicates the half-maximum signal amplitude. (c) Simulated FWHM of the PSF for TFL readout as a function of FA at 3 and 7T.
The longitudinal magnetization relaxation during k-space sampling along the phase encoding direction leads to blurring, which can be illustrated by the PSF, as shown in Fig. 2(b). The full-width half-maximum (FWHM) of the PSFs are 1.68 and 1.36 pixel for the FA of 10° and 8° at 3 and 7T, respectively. Due to the lengthened T1 of longitudinal relaxation at higher field strength, the PSF at 7T is 19.1% narrower than that at 3T, leading to potentially increased spatial resolution at 7T using the same TFL readout. In addition, the impact of FA on spatial blurring is demonstrated in Fig. 2(c), where the FWHM of the PSF of the TFL-pCASL signal was plotted as a function of the FA of the excitation pulses in TFL readout. It is shown that the FWHM decreases with smaller FA as the signal is less saturated during the TFL readout. The FWHM of the PSF at 7T is consistently smaller than its counterpart at 3T with the same FA, suggesting improved spatial resolution of TFL-pCASL scans at 7T.
In vivo Imaging at 3 and 7T
An example of FOV/3 shifted CAIPIRINHA aliased control images acquired using SMS-TFL readout are displayed in Fig. 3(a) and (b) for 3 and 7T, respectively, with SB (top), MB-3 (middle) and MB-5 (bottom) slice acceleration. The corresponding g-maps are displayed in supplementary Fig. S1 for both 3 and 7T.
Figure 3.
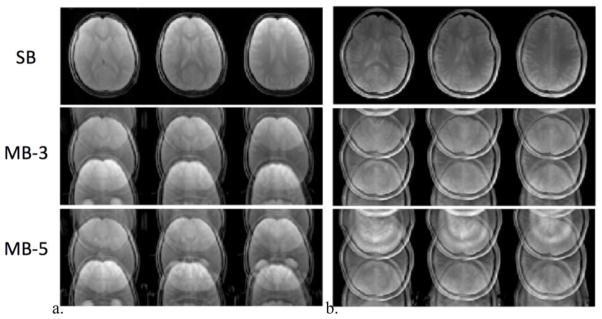
Example aliased control images from the pCASL prepared SMS-TFL acquisition with SB (top), MB-3 (middle), MB-5 (bottom) slice acceleration at (a) 3 and (b) 7T. A FOV/3 inter-slice shift along the phase encoding direction (A≪P) was applied for MB-3 and MB-5 acquisition to minimize the g-factor penalty.
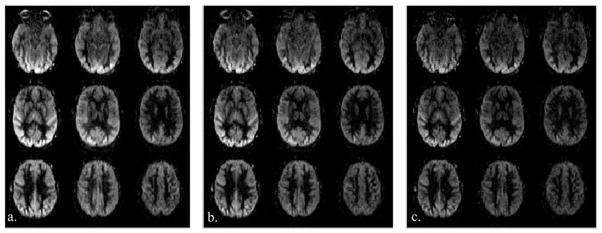
After applying the slice-GRAPPA algorithm, the CAIPIRINHA aliased imaging slices were unfolded, from which the perfusion-weighted images were then obtained. Figure 4 shows the perfusion-weighted images acquired using SB, MB-3 and MB-5 slice acceleration at 3 (a–c) and 7T (d–f), respectively.
Figure 4.


Representative perfusion weighted images acquired with (a, d) SB, (b, e) MB-3 and (c, f) MB-5 slice acceleration at (a–c) 3 and (d–f) 7T. Vertically aligned images represent slices that were excited and readout simultaneously, therefore signal contrast share the same degree of T1 relaxation.
Vertically aligned images (or volumes) in Fig. 4 represent slices that were excited and acquired simultaneously. Therefore, these images contain the blood perfusion signal with the same degree of T1 relaxation (Kim et al., 2013; Li et al., 2015). Overall, comparable visual details can be observed in the perfusion weighted images across SB, MB-3 and MB-5 conditions. Yet, five times more slice coverage was achieved when using MB-5 as compared with the SB acquisition within the same amount of image acquisition time.
Figure 5 illustrates the impact of FA of TFL readout on pCASL signal intensity and spatial blurring at 3T. Perfusion weighted images acquired at the FA of 10°, 8° and 6° with MB-3 slice acceleration are shown in Fig. 5(a–c), respectively. As expected, the overall pCASL perfusion signal intensity decreases as FA drops from 10° to 6°. It can also be observed that the image sharpness improves as FA decreases from 10° to 6°. This is consistent with the simulation results shown in Fig. 2(a) and (c). Therefore, there exists a tradeoff between the perfusion signal intensity and the degree of spatial smoothness of TFL-pCASL scans.
Figure 5.
Perfusion weighted images acquired using the pCASL SMS-TFL sequence with MB-3 slice acceleration, and varying FA of (a) 10°, (b) 8° and (c) 6°. The figures are displayed with the same scale.
To evaluate the impact of BS at 3T, perfusion weighted images acquired without and with BS pulses are shown in Fig. 6(a) and (b), respectively, and each case includes a SB, MB-3 and MB-5 SMS-TFL acquisition. For comparison, only the common central three slices are displayed with the same scaling. In addition, the RMS of the image intensity difference between each image volume and the time series mean without and with BS were also calculated and shown for a MB-3 slice acceleration scan in Fig. 6(c) and (d), respectively.
Figure 6.

Impact of background suppression on SMS-TFL pCASL signal. (a, b) Perfusion weighted images acquired with SB (top), MB-3 (middle) and MB-5 (bottom) and (c, d) the root-mean-square (RMS) of the image intensity difference between each image volume and the time series mean without and with background suppression at 3T. Perfusion weighted images (a) without and (b) with background suppression. Only the common central three slices are displayed with the same scaling for comparison purpose. RMS of the image intensity difference between each raw image volume and the time series mean (c) without and (d) with background suppression for a MB-3 slice acceleration scan. The dashed line represents the scrubbing threshold above which the time points were removed from the calculation for the perfusion signal and the CBF maps.
The overall perfusion image intensity with BS was slightly lower compared to the corresponding perfusion images acquired without BS pulses, due to the loss of labeling efficiency with BS pulses. Otherwise, comparable image quality is seen for SB, MB-3 and MB-5 slice acceleration. However, non-BS images showed a greater level of temporal variation in RMS values, which was improved significantly after applying the BS pulses.
Representative CBF maps from the SMS-TFL with MB-5 and the EPI acquisition are shown in Fig. 7(a, b) and (c, d) for 3 and 7T, respectively. Due to the short TE and multi-shot readout in the TFL acquisition, CBF maps show virtually no signal dropout and distortion in the orbitofrontal and inferior temporal regions, as shown in Fig. 7(a, c). In contrast, severe geometric distortions are clearly visible on the EPI images, especially near the orbitofrontal and inferior temporal lobe, as shown in Fig. 7(b, d).
Figure 7.

Representative CBF maps acquired using (a, c) SMS-TFL with MB-5 slice acceleration and (b, d) a standard 2D EPI readout. (a, b) CBF maps at 3T. (c, d) CBF maps at 7T. Distortion artifacts and signal dropout are clearly visible in EPI images. In contrast, high quality distortion-free CBF maps are attained from the SMS-TFL readout.
Quantitative Analysis
Tables 1 and 2 summarize the measured SNR values from the control images and the perfusion-weighted images characterizing the performance of the imaging sequences, i.e., SMS-TFL and EPI at both 3 and 7T. Specifically, normalized temporal SNR and spatial SNR are listed in Tables 1 and 2, respectively, for MB-3, MB-5 and EPI relative to the SB TFL pCASL acquisition averaged across all subjects.
Table 1.
Normalized temporal SNR (tSNR) of control images and perfusion-weighted images (PWI) from SMS-TFL with MB-3, MB-5 slice acceleration and 2D EPI relative to the TFL SB acquisition at 3 and 7T. Background suppression was applied for MB-3 and MB-5. (mean ± standard deviation, n=10 at 3T, n=5 at 7T).
| tSNR | MB-3 | MB-3 BS | MB-5 | MB-5 BS | EPI |
|---|---|---|---|---|---|
| Control 3T | 0.92±0.12 | 0.48±0.05 | 0.90±0.09 | 0.44±0.06 | 0.62±0.17 |
| PWI 3T | 0.70±0.05 | 0.84±0.09 | 0.65±0.05 | 0.79±0.10 | 0.46±0.14 |
| Control 7T | 0.90±0.37 | NA | 0.94±0.29 | NA | 0.26±0.10 |
| PWI 7T | 0.76±0.10 | NA | 0.74±0.11 | NA | 0.23±0.05 |
Table 2.
Normalized spatial SNR (sSNR) of control images and perfusion-weighted images (PWI) from SMS-TFL with MB-3, MB-5 slice acceleration and 2D EPI relative to the TFL SB acquisition at 3 and 7T. (mean ± standard deviation, n=10 at 3T, n=5 at 7T)
| sSNR | MB-3 | MB-3 BS | MB-5 | MB-5 BS | EPI |
|---|---|---|---|---|---|
| Control 3T | 0.86±0.11 | 0.37±0.04 | 0.87±0.10 | 0.34±0.02 | 0.41±0.15 |
| PWI 3T | 0.86±0.11 | 0.81±0.11 | 0.80±0.09 | 0.71±0.03 | 0.29±0.10 |
| Control 7T | 0.81±0.13 | NA | 0.74±0.11 | NA | 0.16±0.06 |
| PWI 7T | 0.80±0.19 | NA | 0.71±0.13 | NA | 0.18±0.08 |
For SMS-TFL images, both normalized temporal SNR and spatial SNR of the perfusion-weighted images were in the range of 70–86% with MB-3 slice acceleration and dropped 2–9% as MB factor increased from 3 to 5 at both 3 and 7T. MB slice acceleration factor had little impact on the SNR for the control images at both 3 and 7T, yielding comparable spatial SNR and temporal SNR as MB factor increases. In contrast, the standard 2D EPI acquisition showed significant reduction in all of the SNR measurements at both field strengths as compared to the TFL-based acquisitions. Specifically, ANOVA on temporal SNR measurements revealed a significant effect of imaging sequence at 3T (F(2)=62.3; p<1e-6) as well as 7T (F(2)=23.5; p<1e-5). Post-hoc t-tests showed significantly lower temporal SNR for EPI as compared to TFL MB-3 (3T: t(9)=5.4; p<1e-3/7T: t(4)=13.0; p<1e-3) and TFL MB-5 (3T: t(9)=4.7; p<1e-3/7T: t(4)=9.6; p<1e-3). Similarly, post-hoc t-tests showed significantly lower spatial SNR for EPI as compared to TFL MB-3 (3T: t(9)=12.7; p<1e-6/7T: t(4)=8.9; p<1e-3) and TFL MB-5 (3T: t(9)=10.8; p<1e-5/7T: t(4)=10.6; p<1e-3).
The addition of BS to the SMS-TFL at 3T yielded a 14% increase in temporal SNR of perfusion-weighted images compared to the corresponding sequence without BS. Furthermore, the decrease in spatial SNR of perfusion-weighted images was caused by the reduced labeling efficiency from the two BS pulses. Similarly, the reduction in SNR of control images indicates the effect of BS on brain tissue signal. Absolute temporal SNR and spatial SNR measurements can be found in supplementary Table S1 and S2.
CBF values from gray matter, white matter and medial OFC ROIs were quantified and are listed in Table 3, using both SMS-TFL and EPI readouts. ANOVA on gray matter CBF measurements did not reveal a significant effect of imaging sequence at 3T (F(3)=1.12; p=0.36) or 7T (F(3)=1.81; p=0.19). Neither did ANOVA on the effect of imaging sequence for white matter CBF measurements at 7T (F(3)=1.41; p=0.28). However, ANOVA on white matter CBF measurements at 3T revealed a significant effect on imagine sequence (F(3)=3.35; p=0.0297). Post-hoc t-tests showed significantly higher white matter CBF values for EPI as compared to SB TFL (t(9)= −3.06 ; p=0.0135). However, MB-3 and MB-5 TFL did not differ significantly from EPI and SB TFL conditions.
Table 3.
Gray matter (GM), white matter (WM) and orbitofrontal cortex (OFC) ROI-based CBF measurements using SMS-TFL with MB-3, MB-5 slice acceleration, SB TFL and the standard 2D EPI readout at 3 and 7T. (Unit: ml/100g/min)
| CBF | SB | MB-3 | MB-5 | EPI |
|---|---|---|---|---|
| GM 3T | 65.25±10.22 | 65.72±8.36 | 64.46±10.69 | 61.94±12.61 |
| GM 7T | 55.89±9.20 | 60.71±9.91 | 55.74±9.10 | 62.18±8.62 |
| WM 3T | 15.64±2.40 | 18.31±4.49 | 18.78±6.06 | 26.44±7.56 |
| WM 7T | 14.25±3.74 | 20.79±7.15 | 19.59±7.13 | 21.23±8.49 |
| OFC 3T | — | 54.98±13.10 | 55.70±16.24 | 33.86±17.74 |
| OFC 7T | — | 41.85±12.15 | 37.87±10.00 | 13.63±17.03 |
Discussions
Benefits of SMS-TFL pCASL
In this study, we presented a novel imaging technique by combining pCASL and SMS-TFL readout for whole brain distortion-free CBF mapping at both 3 and 7T. The performance of SMS-TFL with a MB acceleration factor up to five was evaluated and compared with that of a standard 2D EPI sequence. The addition of BS in SMS-TFL further improved the temporal SNR of the perfusion-weighted images. Superior image quality with no geometric distortion and signal dropout near the orbitofrontal and inferior temporal lobes can be attained from the SMS-TFL pCASL perfusion images, due to the multi-shot readout and short TE of the TFL acquisition. The relatively slower image acquisition speed of the TFL readout (as compared to EPI) was compensated by the SMS acquisition scheme.
The overall trend in our results of SNR measurements is consistent with the findings reported by recent studies using SMS-EPI for ASL imaging (Feinberg et al., 2013; Kim et al., 2013; Li et al., 2015)—SNR of perfusion-weighted images drops as MB acceleration factor increases due to a higher g-factor and greater slice leakage artifacts caused by residual aliasing of images. Less than 10% drop in temporal SNR was reported by Kim et al (Kim et al., 2013). In their work, it was also reported that the performance of SMS-EPI further degraded when the distance between simultaneously excited slices was less than 20 mm because of the similarity in the coil sensitivity profiles for closely spaced slices. This may contribute to the observed SNR drop (14–35%) in perfusion-weighted images acquired with MB-3 and MB-5 in the present study, where the distance between MB slices was 21 mm. Another potential reason for the temporal SNR penalty of SMS-TFL based ASL images is the relatively long readout time per 2D slice (250–330 ms) compared to that of EPI (97 ms). Physiological noise due to respiratory and cardiac pulsation may affect/modulate SMR-TFL based perfusion images during the readout window. This also explains why BS is beneficial in terms of improving temporal SNR for SMS-TFL based ASL images, as demonstrated in Table 1 (Vidorreta et al., 2012).
Advantages and Challenges of SMS-TFL pCASL at 7T
The present study also demonstrated the feasibility of performing whole-brain quantitative perfusion imaging at 7T. Due to the increased B0 and B1 inhomogeneity at 7T, dielectric padding and high (3rd) ordering shimming were utilized to achieve reliable pCASL labeling. Moreover, the imaging acquisition parameters were adjusted at 7T to accommodate the SAR constraint. Theoretically, performing ASL at ultrahigh magnetic field strength can be beneficial because of the increased SNR, as well as the lengthened T1-realxation time (Zuo et al., 2013). The latter feature not only loosens the restriction on the length of the PLD and image acquisition window, it also creates less spatial blurring as indicated by the simulated PSF shown in Fig. 2(b, c). The mean and SD of quantitative CBF values in grey and white matter at 7T were comparable to those at 3T (Table 3), suggesting that the proposed approach by combining dielectric padding, high order shimming and SMS-TFL readout was reliable for ASL perfusion imaging at ultrahigh field. It is feasible to acquire perfusion images with 1×1 mm2 in-plane resolution using the proposed technique as well as with prolonged PLD and image acquisition window (up to 2 sec) at 7T (data not shown). Due to the differences in coil configurations, acquisition schemes (centric vs. linear ordering) and labeling parameters at 3 and 7T, the absolute SNR measurements of SMS-TFL pCASL scans (Table S1, S2) however did not show improvements at 7T compared to those at 3T at present. Further technical developments of SMS-TFL at 7T including robust implementation of centric PE ordering, combination of SMS with in-plane parallel imaging (e.g. GRAPPA), and optimized MB composite pulses with reduced SAR are needed to realize the full benefits and potential of SMS-TFL pCASL at ultrahigh field strengths.
Comparison of SMS-TFL with EPI and 3D GRASE pCASL
In the present study, SMS-TFL pCASL demonstrated significantly higher spatial and temporal SNR compared to a standard 2D EPI pCASL sequence. Based on theoretical SNR analysis of EPI and TFL based pCASL signals taking into account receiver bandwidth, partial Fourier, FA and T2* relaxation effects, the predicted SNR ratios between TFL and EPI pCASL signals are 0.64 and 1.08 at 3 and 7T respectively. Since the reported SNR values were based on subtraction of odd and even perfusion images, the noise sources included physiological and system fluctuations in addition to thermal noise. One explanation for the higher SNR in TFL pCASL than EPI pCASL is greater temporal stability of TFL readout given the lower demand on gradient coils and reduced sensitivity to field fluctuations compared to EPI. The varying degrees of spatial blurring present in TFL and EPI pCASL images may also affect the SNR comparisons, although the blurring effect is comparable at 7T. Finally, EPI pCASL was not optimized in the present study without in-plane acceleration or SMS acquisitions.
The BS was incorporated in the presented SMS-TFL sequence, where sequential 2D MB imaging slices were acquired. Even though the recovery of the magnetization during the image acquisition window compromised the effectiveness of BS, an average degree of ~65% suppression of brain tissue signals was still achieved at 3T in this study. As recommended by the ASL white paper (Alsop et al., 2014), 3D fast imaging sequence (e.g. GRASE) is advantageous for the implementation of BS with a single excitation time for the whole imaging volume. When optimally combined, BS and 3D acquisitions have been shown to improve the sensitivity of ASL by reducing physiological noise (Ye et al., 2000). However, studies by Vidorreta et al. (Vidorreta et al., 2012) indicated that the susceptibility induced off-resonance effects could still be observed in the orbitofrontal region in the perfusion maps acquired using both 2D EPI and 3D GRASE. Moreover, the T2 decay during the long 3D readout may induce spatial blurring along the z-direction, as well as produce potential errors in CBF quantifications. The implementation of 3D GRASE ASL at 7T, with large volume coverage, can be very challenging due to B1 inhomogeneity. SMS-EPI based ASL has been proposed as an alternative to 3D GRASE ASL. However, at present the temporal SNR of SMS-EPI ASL is still inferior to that of 3D BS GRASE ASL (Feinberg et al., 2014). The proposed SMS-TFL pCASL (with BS) may overcome the geometric distortion and low temporal SNR in SMS-EPI based ASL acquisitions. A systematic evaluation is necessary to compare the performance of SMS-TFL, SMS-EPI and 3D GRASE based ASL imaging at both 3 and 7T in future studies.
Study Limitations and Future Directions
In the present study, a PLD of 1.2 sec was employed for pCASL scans. Given the reported arterial transit time (ATT) values in literature (e.g. ATT=1.4±0.13 sec (Chen et al., 2012)), CBF quantification of the first SB or MB TFL slices would be underestimated (up to 19%) as the PLD is shorter than ATT, while CBF measurements in the second and third SB/MB slices were appropriate. This is a caveat of MB ASL experiments in which both proximal and distal slices are simultaneously excited. Therefore, a relatively long PLD (e.g. 1.8 sec as recommended by ASL white paper) should be applied to minimize arterial transit effects and allow accurate perfusion quantification especially for distal imaging slices for MB ASL techniques.
The presented SMS-TFL sequence can be applied for imaging modalities other than ASL, e.g., diffusion weighted imaging (DWI), chemical exchange saturation transfer (CEST) (Liu et al., 2014) and T2-prepared fMRI (Hua et al., 2013). For perfusion-based functional and pharmacological MRI studies, distortion-free SMS-TFL based ASL images offer clear visualization of the OFC, limbic and inferior temporal regions. These brain regions are known to be involved in emotion, reward and risk processing, with rich distribution of major neurotransmitter receptors. Since TFL is commonly used for T1-weighted structural MRI scans, e.g., magnetization-prepared rapid acquisition with gradient echo (MPRAGE) (Bernstein et al., 2004), SMS-TFL allows seamless fusion between structural and fMRI, with no distortion correction needed.
Conclusions
In this work, we developed and evaluated an SMS-TFL based pCASL sequence to provide whole-brain distortion-free perfusion images at high and ultrahigh magnetic fields. SMS-TFL based pCASL may overcome shortcomings of EPI based ASL, such as susceptibility related signal dropout and geometric distortion. It also allows seamless co-registration between perfusion and structural MRI, and may be applied with other imaging modalities such as diffusion and functional MRI.
Supplementary Material
Highlights.
Distortion-free whole-brain perfusion imaging using SMS-Turbo FLASH (TFL) pCASL
Excellent visualization of orbitofrontal and inferior temporal cortex at 3 and 7T
Superior temporal and spatial SNR using SMS-TFL pCASL over EPI pCASL
Background suppression improves temporal stability of SMS-TFL pCASL
Acknowledgments
This research was supported by the National Institute of Health (NIH) Grants R01-MH080892, R01-NS081077, R01-EB014922, the NIH Human Connectome Project (NIH U54MH091657), Biomedical Technology Resource Centers (BTRC) National Center for Research Resources (NCRR; P41 RR08079), the National Institute of Biomedical Imaging and Bioengineering (NIBIB; P41 EB015894) and Siemens Healthcare USA, Inc. In addition, the authors would like to acknowledge Robert Smith for the helpful discussion on the manuscript and Kay Jann for the statistical analysis.
Footnotes
Publisher's Disclaimer: This is a PDF file of an unedited manuscript that has been accepted for publication. As a service to our customers we are providing this early version of the manuscript. The manuscript will undergo copyediting, typesetting, and review of the resulting proof before it is published in its final citable form. Please note that during the production process errors may be discovered which could affect the content, and all legal disclaimers that apply to the journal pertain.
References
- Alsop DC, Detre JA, Golay X, Gunther M, Hendrikse J, Hernandez-Garcia L, Lu H, Macintosh BJ, Parkes LM, Smits M, van Osch MJ, Wang DJ, Wong EC, Zaharchuk G. Recommended implementation of arterial spin-labeled perfusion MRI for clinical applications: A consensus of the ISMRM perfusion study group and the European consortium for ASL in dementia. Magnetic resonance in medicine : official journal of the Society of Magnetic Resonance in Medicine/Society of Magnetic Resonance in Medicine. 2014 doi: 10.1002/mrm.25197. [DOI] [PMC free article] [PubMed] [Google Scholar]
- Bernstein MA, King KF, Zhou ZJ. Handbook of MRI pulse sequences. Academic Press; Amsterdam ; Boston: 2004. [Google Scholar]
- Bi X, Park J, Deshpande V, Simonetti O, Laub G, Li D. Reduction of flow- and eddy-currents-induced image artifacts in coronary magnetic resonance angiography using a linear centric-encoding SSFP sequence. Magnetic resonance imaging. 2007;25:1138–1147. doi: 10.1016/j.mri.2007.01.004. [DOI] [PMC free article] [PubMed] [Google Scholar]
- Borogovac A, Asllani I. Arterial Spin Labeling (ASL) fMRI: advantages, theoretical constrains, and experimental challenges in neurosciences. International journal of biomedical imaging. 2012;2012:818456. doi: 10.1155/2012/818456. [DOI] [PMC free article] [PubMed] [Google Scholar]
- Breuer FA, Blaimer M, Heidemann RM, Mueller MF, Griswold MA, Jakob PM. Controlled aliasing in parallel imaging results in higher acceleration (CAIPIRINHA) for multi-slice imaging. Magnetic resonance in medicine : official journal of the Society of Magnetic Resonance in Medicine/Society of Magnetic Resonance in Medicine. 2005;53:684–691. doi: 10.1002/mrm.20401. [DOI] [PubMed] [Google Scholar]
- Chen YF, Wang DJJ, Detre JA. Comparison of arterial transit times estimated using arterial spin labeling. Magnetic Resonance Materials in Physics Biology and Medicine. 2012;25:135–144. doi: 10.1007/s10334-011-0276-5. [DOI] [PubMed] [Google Scholar]
- Dai W, Garcia D, de Bazelaire C, Alsop DC. Continuous flow-driven inversion for arterial spin labeling using pulsed radio frequency and gradient fields. Magnetic resonance in medicine : official journal of the Society of Magnetic Resonance in Medicine/Society of Magnetic Resonance in Medicine. 2008;60:1488–1497. doi: 10.1002/mrm.21790. [DOI] [PMC free article] [PubMed] [Google Scholar]
- Detre JA, Leigh JS, Williams DS, Koretsky AP. Perfusion imaging. Magnetic resonance in medicine : official journal of the Society of Magnetic Resonance in Medicine/Society of Magnetic Resonance in Medicine. 1992;23:37–45. doi: 10.1002/mrm.1910230106. [DOI] [PubMed] [Google Scholar]
- Detre JA, Wang J, Wang Z, Rao H. Arterial spin-labeled perfusion MRI in basic and clinical neuroscience. Current opinion in neurology. 2009;22:348–355. doi: 10.1097/WCO.0b013e32832d9505. [DOI] [PubMed] [Google Scholar]
- Feinberg D, Chen L, Beckett A. Arterial spin labeling with simultaneous multi-slice EPI compared to EPI and 3D GRASE. Proceedings of the 22nd ismrm annual meeting of international society for magnetic resonance in medicine; Milan, Italy. 2014. p. 716. [Google Scholar]
- Feinberg DA, Beckett A, Chen L. Arterial spin labeling with simultaneous multi-slice echo planar imaging. Magnetic resonance in medicine : official journal of the Society of Magnetic Resonance in Medicine/Society of Magnetic Resonance in Medicine. 2013;70:1500–1506. doi: 10.1002/mrm.24994. [DOI] [PMC free article] [PubMed] [Google Scholar]
- Hua J, Qin Q, van Zijl PC, Pekar JJ, Jones CK. Whole-brain three-dimensional T2-weighted BOLD functional magnetic resonance imaging at 7 Tesla. Magnetic resonance in medicine : official journal of the Society of Magnetic Resonance in Medicine/Society of Magnetic Resonance in Medicine. 2013 doi: 10.1002/mrm.25055. [DOI] [PMC free article] [PubMed] [Google Scholar]
- Jahng GH, Weiner MW, Schuff N. Improved arterial spin labeling method: applications for measurements of cerebral blood flow in human brain at high magnetic field MRI. Medical physics. 2007;34:4519–4525. doi: 10.1118/1.2795675. [DOI] [PMC free article] [PubMed] [Google Scholar]
- Kim T, Shin W, Zhao T, Beall EB, Lowe MJ, Bae KT. Whole brain perfusion measurements using arterial spin labeling with multiband acquisition. Magnetic resonance in medicine : official journal of the Society of Magnetic Resonance in Medicine/Society of Magnetic Resonance in Medicine. 2013;70:1653–1661. doi: 10.1002/mrm.24880. [DOI] [PubMed] [Google Scholar]
- Larkman DJ, Hajnal JV, Herlihy AH, Coutts GA, Young IR, Ehnholm G. Use of multicoil arrays for separation of signal from multiple slices simultaneously excited. Journal of magnetic resonance imaging : JMRI. 2001;13:313–317. doi: 10.1002/1522-2586(200102)13:2<313::aid-jmri1045>3.0.co;2-w. [DOI] [PubMed] [Google Scholar]
- Li X, Wang D, Auerbach EJ, Moeller S, Ugurbil K, Metzger GJ. Theoretical and experimental evaluation of multi-band EPI for high-resolution whole brain pCASL Imaging. NeuroImage. 2015;106:170–181. doi: 10.1016/j.neuroimage.2014.10.029. [DOI] [PMC free article] [PubMed] [Google Scholar]
- Liu D, Xue R, Zhou J, An J, Miao X, Wang D. Using simultanous multi-slice excitation to accelerate CEST imaging. Proceedings of the 22nd ismrm annual meeting of international society for magnetic resonance in medicine; Milan, Italy. 2014. p. 3294. [Google Scholar]
- Lu H, Clingman C, Golay X, van Zijl PC. Determining the longitudinal relaxation time (T1) of blood at 3.0 Tesla. Magnetic resonance in medicine : official journal of the Society of Magnetic Resonance in Medicine/Society of Magnetic Resonance in Medicine. 2004;52:679–682. doi: 10.1002/mrm.20178. [DOI] [PubMed] [Google Scholar]
- Moeller S, Yacoub E, Olman CA, Auerbach E, Strupp J, Harel N, Ugurbil K. Multiband multislice GE-EPI at 7 tesla, with 16-fold acceleration using partial parallel imaging with application to high spatial and temporal whole-brain fMRI. Magnetic resonance in medicine : official journal of the Society of Magnetic Resonance in Medicine/Society of Magnetic Resonance in Medicine. 2010;63:1144–1153. doi: 10.1002/mrm.22361. [DOI] [PMC free article] [PubMed] [Google Scholar]
- Park SH, Wang DJ, Duong TQ. Balanced steady state free precession for arterial spin labeling MRI: Initial experience for blood flow mapping in human brain, retina, and kidney. Magnetic resonance imaging. 2013;31:1044–1050. doi: 10.1016/j.mri.2013.03.024. [DOI] [PMC free article] [PubMed] [Google Scholar]
- Power JD, Barnes KA, Snyder AZ, Schlaggar BL, Petersen SE. Spurious but systematic correlations in functional connectivity MRI networks arise from subject motion. NeuroImage. 2012;59:2142–2154. doi: 10.1016/j.neuroimage.2011.10.018. [DOI] [PMC free article] [PubMed] [Google Scholar]
- Raichle ME. Behind the scenes of functional brain imaging: a historical and physiological perspective. Proceedings of the National Academy of Sciences of the United States of America. 1998;95:765–772. doi: 10.1073/pnas.95.3.765. [DOI] [PMC free article] [PubMed] [Google Scholar]
- Rane SD, Gore JC. Measurement of T1 of human arterial and venous blood at 7T. Magnetic resonance imaging. 2013;31:477–479. doi: 10.1016/j.mri.2012.08.008. [DOI] [PMC free article] [PubMed] [Google Scholar]
- Schmithorst VJ, Dardzinski BJ, Holland SK. Simultaneous correction of ghost and geometric distortion artifacts in EPI using a multiecho reference scan. IEEE transactions on medical imaging. 2001;20:535–539. doi: 10.1109/42.929619. [DOI] [PMC free article] [PubMed] [Google Scholar]
- Setsompop K, Gagoski BA, Polimeni JR, Witzel T, Wedeen VJ, Wald LL. Blipped-controlled aliasing in parallel imaging for simultaneous multislice echo planar imaging with reduced g-factor penalty. Magnetic resonance in medicine : official journal of the Society of Magnetic Resonance in Medicine/Society of Magnetic Resonance in Medicine. 2012;67:1210–1224. doi: 10.1002/mrm.23097. [DOI] [PMC free article] [PubMed] [Google Scholar]
- Smith SM, Beckmann CF, Andersson J, Auerbach EJ, Bijsterbosch J, Douaud G, Duff E, Feinberg DA, Griffanti L, Harms MP, Kelly M, Laumann T, Miller KL, Moeller S, Petersen S, Power J, Salimi-Khorshidi G, Snyder AZ, Vu AT, Woolrich MW, Xu J, Yacoub E, Ugurbil K, Van Essen DC, Glasser MF. Resting-state fMRI in the Human Connectome Project. NeuroImage. 2013;80:144–168. doi: 10.1016/j.neuroimage.2013.05.039. [DOI] [PMC free article] [PubMed] [Google Scholar]
- Sotiropoulos SN, Jbabdi S, Xu J, Andersson JL, Moeller S, Auerbach EJ, Glasser MF, Hernandez M, Sapiro G, Jenkinson M, Feinberg DA, Yacoub E, Lenglet C, Van Essen DC, Ugurbil K, Behrens TE. Advances in diffusion MRI acquisition and processing in the Human Connectome Project. NeuroImage. 2013;80:125–143. doi: 10.1016/j.neuroimage.2013.05.057. [DOI] [PMC free article] [PubMed] [Google Scholar]
- Teeuwisse WM, Brink WM, Webb AG. Quantitative assessment of the effects of high-permittivity pads in 7 Tesla MRI of the brain. Magnetic resonance in medicine : official journal of the Society of Magnetic Resonance in Medicine/Society of Magnetic Resonance in Medicine. 2012;67(5):1285–93. doi: 10.1002/mrm.23108. [DOI] [PubMed] [Google Scholar]
- Van Essen DC, Ugurbil K, Auerbach E, Barch D, Behrens TE, Bucholz R, Chang A, Chen L, Corbetta M, Curtiss SW, Della Penna S, Feinberg D, Glasser MF, Harel N, Heath AC, Larson-Prior L, Marcus D, Michalareas G, Moeller S, Oostenveld R, Petersen SE, Prior F, Schlaggar BL, Smith SM, Snyder AZ, Xu J, Yacoub E. The Human Connectome Project: a data acquisition perspective. NeuroImage. 2012;62:2222–2231. doi: 10.1016/j.neuroimage.2012.02.018. [DOI] [PMC free article] [PubMed] [Google Scholar]
- Vidorreta M, Wang Z, Rodriguez I, Pastor MA, Detre JA, Fernandez-Seara MA. Comparison of 2D and 3D single-shot ASL perfusion fMRI sequences. NeuroImage. 2012;66C:662–671. doi: 10.1016/j.neuroimage.2012.10.087. [DOI] [PMC free article] [PubMed] [Google Scholar]
- Wang J, Zhang Y, Wolf RL, Roc AC, Alsop DC, Detre JA. Amplitude-modulated continuous arterial spin-labeling 3.0-T perfusion MR imaging with a single coil: feasibility study. Radiology. 2005;235:218–228. doi: 10.1148/radiol.2351031663. [DOI] [PubMed] [Google Scholar]
- Wang Y, Kim SE, DiBella EV, Parker DL. Flow measurement in MRI using arterial spin labeling with cumulative readout pulses--theory and validation. Medical physics. 2010;37:5801–5810. doi: 10.1118/1.3501881. [DOI] [PMC free article] [PubMed] [Google Scholar]
- Williams DS, Detre JA, Leigh JS, Koretsky AP. Magnetic resonance imaging of perfusion using spin inversion of arterial water. Proceedings of the National Academy of Sciences of the United States of America. 1992;89:212–216. doi: 10.1073/pnas.89.1.212. [DOI] [PMC free article] [PubMed] [Google Scholar]
- Wolf RL, Detre JA. Clinical neuroimaging using arterial spin-labeled perfusion magnetic resonance imaging. Neurotherapeutics : the journal of the American Society for Experimental NeuroTherapeutics. 2007;4:346–359. doi: 10.1016/j.nurt.2007.04.005. [DOI] [PMC free article] [PubMed] [Google Scholar]
- Wu WC, Fernandez-Seara M, Detre JA, Wehrli FW, Wang J. A theoretical and experimental investigation of the tagging efficiency of pseudocontinuous arterial spin labeling. Magnetic resonance in medicine : official journal of the Society of Magnetic Resonance in Medicine/Society of Magnetic Resonance in Medicine. 2007;58:1020–1027. doi: 10.1002/mrm.21403. [DOI] [PubMed] [Google Scholar]
- Ye FQ, Frank JA, Weinberger DR, McLaughlin AC. Noise reduction in 3D perfusion imaging by attenuating the static signal in arterial spin tagging (ASSIST) Magnetic resonance in medicine : official journal of the Society of Magnetic Resonance in Medicine/Society of Magnetic Resonance in Medicine. 2000;44:92–100. doi: 10.1002/1522-2594(200007)44:1<92::aid-mrm14>3.0.co;2-m. [DOI] [PubMed] [Google Scholar]
- Zuo Z, Wang R, Zhuo Y, Xue R, St Lawrence KS, Wang DJ. Turbo-FLASH based arterial spin labeled perfusion MRI at 7 T. PloS one. 2013;8:e66612. doi: 10.1371/journal.pone.0066612. [DOI] [PMC free article] [PubMed] [Google Scholar]
Associated Data
This section collects any data citations, data availability statements, or supplementary materials included in this article.