

Abstract
There is much interest in the idea that musicians perform better than non-musicians in understanding speech in background noise. Research in this area has often used energetic maskers, which have their effects primarily at the auditory periphery. However, masking interference can also occur at more central auditory levels, known as informational masking. This experiment extends existing research by using multiple maskers that vary in their informational content and similarity to speech, in order to examine differences in perception of masked speech between trained musicians (n = 25) and non-musicians (n = 25). Although musicians outperformed non-musicians on a measure of frequency discrimination, they showed no advantage in perceiving masked speech. Further analysis revealed that nonverbal IQ, rather than musicianship, significantly predicted speech reception thresholds in noise. The results strongly suggest that the contribution of general cognitive abilities needs to be taken into account in any investigations of individual variability for perceiving speech in noise.
I. INTRODUCTION
Musical expertise offers potential insights into experience-dependent plasticity of auditory function (Herholz and Zatorre, 2012). While it can be difficult to disambiguate factors that may predispose individuals to take up music from those resulting from training, musicians have been reported to demonstrate enhanced concurrent sound segregation (Soderquist, 1970; Zendel and Alain, 2008), pitch discrimination (Micheyl et al., 2006; Spiegel and Watson, 1984; Tervaniemi et al., 2005), duration discrimination (Jeon and Fricke, 1997; Rammsayer and Altenmüller, 2006), and encoding of melodic contour and interval structure (Fujioka et al., 2004). Of relevance to the current study are musicians’ relative abilities in understanding speech in background noise.
Extracting a speaker’s voice from background masking noise is challenging, even for young adults with normal hearing (Assmann and Summerfield, 2004). Certain populations seem to be especially vulnerable to degraded speech, such as older adults (Helfer and Freyman, 2008; Pichora-Fuller et al., 1995) and individuals with learning disorders like dyslexia and specific language impairment (Ziegler et al., 2005, 2009; but see also Hazan et al., 2013; Messaoud-Galusi et al., 2011). In contrast, better performance has been reported in highly trained musicians on two measures of speech perception in noise, the Hearing-in-Noise Test (HINT) and the QuickSIN (Parbery-Clark et al., 2009). However, not all studies have found a robust musicianship advantage (Fuller et al., 2014; Ruggles et al., 2014). Additionally, some studies have only found such an effect in elderly adults, with no difference between musicians and non-musicians under the age of 40 on measures of speech perception in noise (Zendel and Alain, 2012; Figure 4). Understanding why some populations, like musicians, might show enhanced speech perception in noise could lead to therapeutic interventions to help populations that show deficits in this area.
Figure 4.
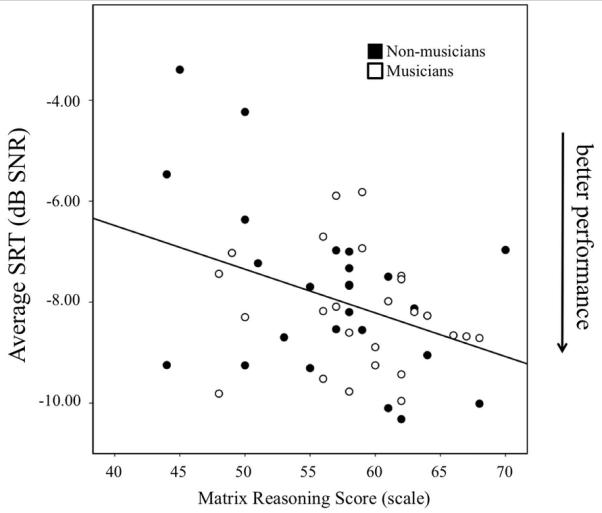
Participants’ average SRTs as predicted by their WASI Matrix Reasoning score. Note that lower thresholds indicate better performance.
Psychoacoustical studies have identified at least two ways in which background sounds can interfere with perception of sound: energetic and informational masking (Shinn-Cunningham, 2008; Brungart et al. 2001). Broadly, energetic masking effects (inclusive of modulation masking; Stone et al., 2011, 2012) are a consequence of the masker energy obscuring the properties of the target signal in the same time/frequency region. This is presumed to arise in the auditory periphery and is most often associated with steady-state noise masking. Informational masking, by contrast, refers to masking effects that cannot be explained solely by energetic masking. It is often associated with higher, more central, levels of auditory and linguistic processing. If musicians show an enhanced ability to perceive masked speech, it is important to understand the extent to which this benefit arises from energetic and/or informational masking mechanisms.
Based on findings that musicians have better pitch perception than non-musicians (Micheyl et al., 2006; Spiegel and Watson, 1984; Tervaniemi et al., 2005), it could be argued that better ability in noise in this group may be due to improved auditory acuity. This implies that musicians would show improved speech perception in noise for all masker conditions – both energetic and informational. Alternatively, a musician advantage for speech perception in noise could be explained by experience-dependent improvements in segregation and selection of target sounds within sound mixtures, meaning that musicians would show a selective benefit for informational masker conditions. The potential interaction between type of masking and musicianship has been examined previously, although results have been mixed. One study found that musicians are less affected by informational masking when the stimuli consisted of sinusoidal tones (Oxenham et al., 2003), although it was unclear whether this benefit would transfer to speech perception. Two recent studies used stimuli that varied in their similarity to speech, and did not find evidence of a systematic musician advantage for either periodic or aperiodic speech (Ruggles et al., 2014) or for sinewave-vocoded speech (Fuller et al., 2014).
It is also possible that musicians’ improved speech perception in noise could be due to general cognitive abilities. There is some controversy concerning the relationship between musical training and improved cognitive abilities (Schellenberg and Peretz, 2008). However, while there is disagreement over the existence of a causal relationship between the two, cognitive factors often co-vary with musicianship. Additionally, in a review of 20 studies on speech perception in noise, all but one found an effect of cognitive factors on performance (Akeroyd, 2008). Thus, we sought to examine whether any observed group differences were likely to be related to musicianship or whether general cognitive abilities contributed to the effect.
The aim of the current study was to elaborate on whether, and in what manner, experienced musicians differ from non-musicians in their perception of masked speech. To this end, we recruited 25 musicians and 25 non-musicians using criteria consistent with previous studies (Parbery-Clark et al., 2009). The current study sought to extend previous work by using intelligible sentences embedded in multiple maskers that vary in their energetic and informational masking effects, and to investigate whether any observed group differences were likely to be related to musicianship or linked with other factors that may co-vary with musicianship, such as general cognitive abilities.
II. METHOD
A. Participants
Fifty native British English speaking adults (mean age = 27.2 years, SD = 6.9 years; 21 females) took part in the study. All participants reported normal hearing and no history of neurological or psychological disorders or language learning impairments. The study was approved by the University College London Research Psychology and Language Science ethics committee, and written informed consent was obtained from all participants.
Participants were categorised as musicians (n = 25) if they had started training before the age of seven, had at least 10 years of musical experience, and reported practicing consistently (at least three times per week) over the previous 3 years (Parbery-Clark et al., 2009). Non-musicians (n = 25) failed to meet these musicianship criteria and reported less than three years of total musical experience, none of which occurred in the year prior to the experiment. The two participant groups did not differ significantly in age (t(48) = −1.453, p = .153), gender (χ2(1, N = 50) = .739, p = .390), or years of post-secondary education (t(45.265) = −1.012 p = .317).
B. Materials
1. Musicianship questionnaire
Before participating in the experiment, all participants completed a questionnaire detailing their language, education, extracurricular, and musical experiences. Details of all participants’ musical backgrounds are displayed in Table I.
Table I.
Details of all participants’ musical cxpcricncc.
| Participant ID | Years of training | Age of onset | Instrument | |
|---|---|---|---|---|
| Musicians | 1 | 19 | 4 | Violin, viola |
| 2 | 24 | 7 | Saxophone, guitar | |
| 3 | 14 | 7 | Violin, piano | |
| 4 | 22 | 7 | Piano, guitar | |
| 5 | 33 | 6 | Violin, guitar | |
| 6 | 25 | 6 | Piano, drums | |
| 7 | 24 | 7 | Guitar | |
| 8 | 26 | 4 | Piano | |
| 9 | 17 | 6 | Piano, trombone | |
| 10 | 14 | 6 | Clarinet, saxophone | |
| 11 | 36 | 6 | Cello, guitar | |
| 12 | 35 | 7 | Piano, sax. flute, clarinet | |
| 13 | 22 | 6 | Piano | |
| 14 | 25 | 4 | Piano, guitar | |
| 15 | 19 | 6 | Piano, drums | |
| 16 | 36 | 6 | Piano, flute, drums, guitar | |
| 17 | 33 | 5 | Accordion | |
| 18 | 31 | 5 | Piano, violin, guitar, horn | |
| 19 | 14 | 6 | Flute | |
| 20 | 15 | 6 | Flute | |
| 21 | 24 | 5 | Piano | |
| 22 | 13 | 5 | Piano | |
| 23 | 14 | 7 | Piano | |
| 24 | 21 | 7 | Clarinet, sax. flute, piano, bassoon | |
| 25 | 12 | 6 | Piano, flute | |
| Mean (SD) | 22.7 (7.8) | 5.9(1.0) | ||
| Non-musicians | 1 | 0 | - | |
| 2 | 0 | - | ||
| 3 | 2 | 12 | Piano | |
| 4 | 0 | - | ||
| 5 | 1 | 10 | Piano | |
| 6 | 0 | - | ||
| 7 | 0 | - | ||
| 8 | 0 | - | ||
| 9 | 0 | - | ||
| 10 | 0 | - | ||
| 11 | 0 | - | ||
| 12 | 0 | - | ||
| 13 | 1 | 18 | Guitar | |
| 14 | 0 | - | ||
| 15 | 0 | - | ||
| 16 | 0 | - | ||
| 16 | 0 | - | ||
| 17 | 0 | - | ||
| 18 | 0 | - | ||
| 19 | 2 | 11 | Violin, piano | |
| 20 | 0 | - | ||
| 21 | 0 | - | ||
| 22 | 0 | - | ||
| 23 | 0 | - | ||
| 24 | 0 | - | ||
| 25 | 0 | - | ||
| Mean (SD) | .2 (.6) | 12.8 (3.6) |
2. Masking task
Target speech stimuli consisted of sentences from the Bamford-Kowal-Bench (BKB) lists (Bench et al., 1979). These are short sentences that have simple syntax and semantic content that were developed using the speech of children who have hearing impairments, i.e. “SHE CUT with her KNIFE.” Each sentence included three key words (capitalized above). The sentences were produced by a female Southern British English speaker and recorded in an anechoic chamber at 44,100Hz with 16-bit quantization and down-sampled to 22050 Hz. All stimuli, including the target and masking sounds, were low-pass filtered at 3.8 kHz to equate the spectral range across conditions.
The target sentences were embedded in four different kinds of maskers that varied parametrically in their informational content: clear speech, spectrally-rotated speech, speech-amplitude modulated noise, and speech-spectrum steady-state noise. Waveforms and spectrograms of all four maskers can be seen in Figure 1. The clear speech was taken from a male speaker from the EUROM database of British English speech (Chan et al., 1995). All the other conditions were derived from the clear speech condition. Using a female target speaker and a male masking speaker meant that informational masking effects were reduced, compared to the levels of informational masking seen when two same sex speakers are used (Brungart, 2001). This choice was made to enable the instruction “listen to the female speaker,” so training participants to identify the target speaker would not be necessary (Scott et al., 2004), and has been shown to result in widespread cortical responses to the masking speech, relative to energetic masking conditions (Scott et al, 2004; 2009).
Figure 1.
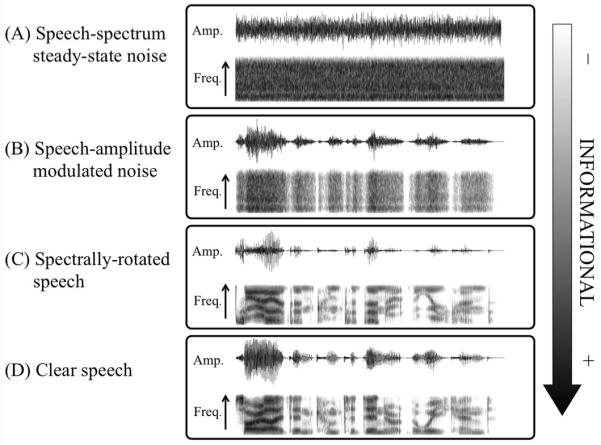
Wave forms and spectrograms of the four maskers, arranged from least informational masking to most. For the spectrograms, time is represented on the x-axis (0-1.7 s) and frequency on the y-axis (0-4 kHz). (A) Speech-spectrum steady-state noise has no temporal modulations or spectro-temporal dynamics. (B) Speech-amplitude modulated noise has temporal modulations but no spectro-temporal dynamics. (C) Spectrally-rotated speech contains similar temporal modulations and spectro-temporal dynamics as clear speech, but is unintelligible. (D) Clear speech contains both temporal modulations and spectro-temporal dynamics, and is intelligible.
Rotated speech was generated by inverting the frequency spectrum around 2 kHz, using a digital version of the simple modulation technique described by Blesser (1969, 1972). The speech signal was first equalised with a filter (essentially high-pass) that gave the rotated signal approximately the same long term spectrum as the original. The equalized signal was then amplitude modulated by a sinusoid at 4kHz, followed by low pass filtering at 3.8kHz. Rotated speech preserves much of the spectro-temporal complexity of speech, e.g. it contains amplitude modulations, and a formant and quasi-harmonic structure, but is unintelligible. Speech-amplitude modulated noise was created by modulating a speech-spectrum noise with envelopes extracted from the original speech by full-wave rectification and low-pass filtering at 30 Hz. Speech-amplitude modulated noise has the amplitude modulations of speech but does not contain spectro-temporal dynamics such as formant or harmonic structure. Speech-spectrum steady-state noise was generated by synthesising a white noise and filtering it to have the same long-term average spectrum as the clear speech. Although having the same long-term spectrum as speech, this steady-state noise does not have amplitude modulation or any structured spectro-temporal dynamics.
The target sentences were assigned to the four masking conditions so that each sentence was presented only once during the course of the experiment, and the order of conditions was randomized between participants using a Latin square. During the task, participants were required to listen to the target sentences embedded in the masker and repeat them back to the experimenter. Responses were scored for the number of correct key words (0 to 3).
A one-up one-down adaptive staircase procedure was used to determine participants’ speech reception thresholds (SRTs) (Levitt, 1970). The stimuli were presented over Sennheiser HD25 headphones. The maskers were presented at 71 dB SPL as measured by a Bruel & Kjaer 4153 artificial ear. The level of the target was varied initially in a 10-dB step size, which reduced to 6.5-dB after the first reversal, and to 3-dB steps after the second reversal. For each trial, the target and masker were mixed at the appropriate SNR, which was constructed by changing the intensity of the target while maintaining a constant level of the masker. The termination criterion was 18 reversals, and if this number of reversals was not achieved, the track ended after 28 trials. A 50% SRT was calculated for each condition by omitting the first two reversals and averaging all remaining reversals. To prevent biasing the thresholds, in the case that there were an odd number of reversals remaining after omitting the first two, the third reversal was also omitted so that the number of averaged reversals was always even. Each participant completed two adaptive procedure tasks for each masking condition, and the two SRTs for each condition were averaged to increase the reliability of the threshold estimate. Levene’s test of equality of variance, showed there to be no evidence of a difference in the measure of variability in the number of reversals between groups, F(1, 48) = .046, p = .831). There was also no group difference in the number of reversals between musicians (M = 13.2, SD = .8) and non-musicians (M = 12.9, SD = .8), F(1, 48) = 1.148, p = .289, partial η2 = .023), or group by masking condition interaction, F(3, 144) = .856, p = .466, partial η2 = .18).
3. Psychoacoustic measures
Participants’ frequency discrimination and duration discrimination thresholds were determined using an adaptive staircase procedure (Grassi and Soranzo, 2009). For each trial in the frequency discrimination task, participants were presented with three 250-millisecond pure tones and asked to indicate which of the three tones was highest. Two of the tones were presented at the same frequency (1-kHz) and one at a higher frequency by a specified Δf, ranging from 2 to 256 Hz. In each trial, the three tones were presented in a random order, and the participant was asked to indicate which of the three tones was highest. Similarly, in the duration discrimination task, participants were presented with three 1-kHz pure tones and had to determine which of the three tones was the longest. Two of the tones were the same length (250 milliseconds), and one of the tones was longer by Δt, which was varied adaptively from 8 to 256 ms.
All tone onsets and offsets were gated on and off with two 10-milisecond raised cosine ramps. Both adaptive procedures were transformed “2-down 1-up,” staircases tracking the 70.7% point on the psychometric function. The Δf or Δt was adaptively changed throughout the experiment, such that the Δf or Δt was changed by a factor of 2 for the first four reversals, and by a factor of √2 for the next eight reversals, with the track ending after 12 reversals. The threshold was calculated by averaging the values of the last eight reversals.
4. Auditory working memory
The forward and backward Digit Span subtest of the Wechsler Adult Intelligence Scale (WAIS) (Wechsler, 1997) was used to measure participants’ auditory short-term and working memory, respectively. Participants’ scaled scores were used in all further analyses.
5. Nonverbal IQ
The Matrix Reasoning subtest of the Wechsler Abbreviated Scale of Intelligence (WASI) was used (Wechsler, 1999) to estimate participants’ non-verbal IQ. Participants’ scaled scores were used in all further analyses.
6. Selective attention
The Stroop task is a commonly used assessment of selective attention and inhibition control (Stroop, 1935). In a control task, participants were shown a list of groups of X’s (i.e. XXXX XXXX XXXX XXXX) printed in various colours and had to name the ink colour. In the experimental task, participants were shown a series of colour words printed in a mismatching ink colour (i.e. “blue” printed in pink ink). They were instructed to go down the list and name the ink colour of the words as quickly and as accurately as possible, while ignoring the word meaning. The amount of interference was calculated as the ratio between the experimental task and the control task performance times (Jensen 1965; Macleod, 1991).
7. Mental flexibility
The trail making test has been extensively used in neuropsychological testing to evaluate participants’ motor speed (Gaudino et al., 1995), fluid intelligence (Salthouse, 2011), and task-switching (Wecker et al., 2005). In Part A, the participant draws a line to connect numbers in sequential order as quickly as possible. In Part B, the participant draws a line to connect circled numbers and letters in sequential and alphabetical order, alternating between numbers and letters as quickly as possible (i.e. 1-A-2-B-3-C, etc.). The ratio between times for Part B and Part A was used as the dependent measure, because this greatly reduces the effects of motor speed (Salthouse, 2011).
III. RESULTS
A. Cognitive tasks
Two-tailed independent sample t-tests showed that the musician and non-musician groups did not differ on any of the cognitive measures, including digit span (t(40.903) = −.928, p =. 359), matrix reasoning (t(48) = −1.342, p = .186), the Stroop task (t(48) = .432, p = .668), and the trail making task (t(48) = −.089, p = .929). Group means for each task are presented in Table II.
Table II.
Descriptive statistics and t-tests for cognitive tasks, separated by group.
| Musicians (N = 25) | Non-musicians (N = 25) | Total (N = 50) | t-Test Results | |
|---|---|---|---|---|
|
| ||||
| Cognitive task | Mean (SD) | Mean (SD) | Mean (SD) | t-value (p-value) |
| Digit span | 12.0 (2.2) | 11.2(3.4) | 11.6(2.9) | −.928 (.359) |
| Matrix reasoning | 58.7(5.5) | 56.4 (6.8) | 57.5 (6.3) | −1.342 (.186) |
| Stroop task | 1.5 (.2) | 1.5 (.2) | 1.5 (.2) | .432 (.668) |
| Trail making task | 2.0 (.6) | 1.9 (.7) | 2.0 (.6) | −0.089 (.929) |
B. Frequency and duration acuity
The Shapiro-Wilk test of normality indicated that the distributions of the pitch and duration discrimination tasks were positively skewed, p’s < .001. The log transform often used in psychoacoustic research was not sufficient to normalize the data, so according to Tukey’s ladder of powers (Tukey, 1977), the nonlinear monotonic transformation −1/(√x) was used. After transformation, the Shapiro-Wilk test was no longer significant for either the pitch or duration measure, p’s > .3.
Independent samples t-tests showed that musicians (M = 10.9 Hz, SD = 19.2 Hz) performed significantly better than non-musicians (M = 41.1 Hz, SD = 73.0 Hz) on the pitch discrimination task, t(48) = 3.757, p < .001, but there was no difference between the groups on the duration discrimination task, t(48) = 1.394, p = .170 (musicians: M = 28.4 ms, SD = 11.3 ms, non-musicians: M = 35.0 ms, SD = 17.8 ms; Figure 2). Note that for both measures, lower scores indicate lower thresholds and thus better performance.
Figure 2.
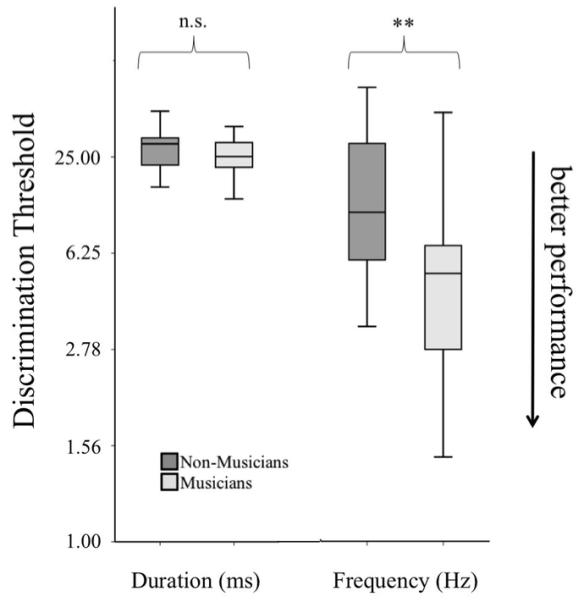
Boxplots illustrating performance on the duration and frequency discrimination tasks separated by group, * = p < .05, ** = p < .001. Note the different units for duration (ms) and frequency (Hz) measures. Lower thresholds indicate better performance.
C. Masking Task
A mixed effects ANOVA, with a within-subjects factor of masker condition (clear speech, spectrally-rotated speech, speech-amplitude modulated noise, and speech-spectrum steady-state noise) and a between-subjects factor of musicianship (musician, non-musician) revealed a significant main effect of masker condition, F(3, 144) = 320.194, p <.001, partial η2 = .870, with all pairwise comparisons reaching statistical significance (all p’s < .001, Bonferroni corrected). Notably, there was no significant main effect of musicianship, F(1, 48) = 1.413, p = .240, partial η2 = .029, or a masker by musicianship interaction, F(3, 144) = .187, p = .905, partial η2 = .004. Group means are presented in Table III, and results can be seen in Figure 3.
Table III.
Participants’ mean SRTs for all four masking conditions, separated by group.
| Musicians (N = 25) | Non-musicians (N = 25) | Total (N = 50) | |
|---|---|---|---|
|
| |||
| Masker condition | Mean (SD) | Mean (SD) | Mean (SD) |
| Speech | −11.9 (2.4) | −11.5 (3.2) | −11.7 (2.8) |
| Rotated speech | −10.3 (1.7) | −9.5 (2.2) | −9.9 (2.0) |
| Speech-amplitude modulated noise | −7.8(1.5) | −7.4(1.7) | −7.6(1.6) |
| Speech-spectrum steady-state noise | −3.0(1.0) | −2.7 (0.9) | −2.9(1.0) |
| Overall Mean (SE) | −8.3 (0.2) | −7.8(0.3) | |
Figure 3.
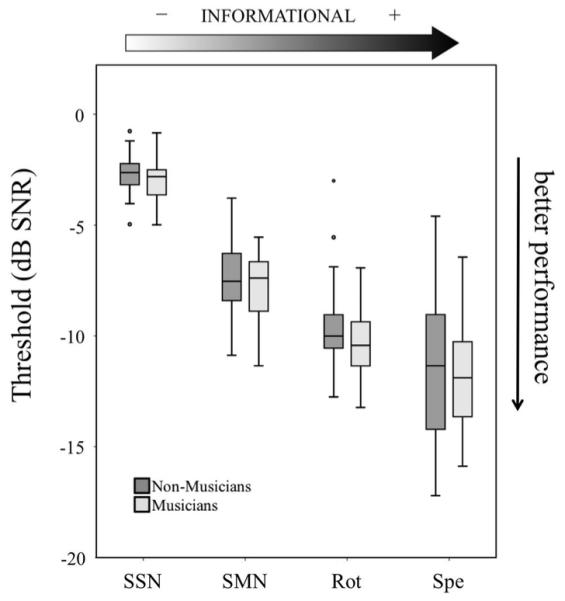
Boxplots of SRTs for each masking condition. Note that lower thresholds indicate better performance. SSN = Speech-Spectrum steady-state Noise, SMN = Speech-amplitude Modulated Noise, Rot = Rotated speech, Spe = clear speech.
In order to better understand the observed lack of evidence of an effect of musicianship on the masked speech task, we generated confidence intervals for the effect size of musicianship (Hentschke and Stüttgen, 2011). The confidence interval was shown to include zero (Hedges’s g = .330, 95% CI = [−0.221, 0.878]). Further, when we generated confidence intervals for the mean difference between the groups in dB, we could have a 95% confidence that the mean difference between the groups was between a 0.34 dB advantage for non-musicians and a 1.3dB advantage for musicians (95% CI = [−0.34 dB, 1.3 dB]). If the observed effect size accurately describes the true effect size in the population, a sample size of over 230 participants (n = 115 per group, one-tailed test; (Faul et al., 2007)) would be needed to obtain a significant result with statistical power at the recommended .80 level.
Lastly, the data from musicians was considered separately and the age of onset of musical training was added as a covariate. No significant main effect of age of onset of musical training was found, F(1, 23) = 1.651, p =.212, partial η2 = .067. There was also no significant interaction between age of onset of musical training and masking condition, F(3, 69) = .704, p = .553, partial η2 = .030. Additionally, within musicians the correlation between number of years of musical training and average SRT was not significant, R = −.348, p = .089. Also, frequency discrimination thresholds did not correlate with SRTs in any of the four masker conditions, both within musicians (all p’s > .250) and across all participants (all p’s > .152).
D. Predictors of masked speech thresholds
As there was no evidence of a difference between musicians’ and non-musicians’ speech perception in noise abilities, group membership, pitch discrimination, duration discrimination, Matrix Reasoning score, Trail Making Task score, digit span score, and Stroop task score were used in a stepwise multiple regression analysis to predict participants’ SRTs. To increase the stability of the threshold estimates we averaged the SRTs across conditions and included this as the dependent measure in the regression. We used a factor analysis to validate this approach, which indicated a single factor (with an eigenvalue greater than one) with high and similar loadings on each condition (loadings range = 0.690 - 0.852). The resulting factor scores correlated exceptionally highly with the average SRT (R2 = .98, p < .001). Using the average SRT as the dependent measure in the stepwise regression, the resulting model contained only the Matrix Reasoning task as a predictor, F(1, 38) = 8.209, p = .006, R2 =.146. No other variable entered into the model (all p’s > .108), indicating that no other variables accounted for additional variance. The relationship between participants’ Matrix Reasoning score and average SRT can be seen in Figure 4. Note that equivalent results were attained in the stepwise regression using the factor scores rather than the average SRT.
We also used the more fine-grained measurement of participants’ years of musical experience as a predictor, rather than their membership in the musician/non-musician groups. However, this did not affect the significance of the findings. Collinearity diagnostic tests produced variance inflation factor (VIF) values all less than 1.252, indicating that there is little redundancy among the predictor variables and multicollinearity was not a problem. Further analyses found that a 1 dB improvement of participants’ SRTs corresponded to an 11.1-point increase on the Matrix Reasoning scale score. Overall, speech perception thresholds were thus primarily predicted by non-verbal IQ, rather than musical experience or psychoacoustic abilities.
To ascertain whether the slopes of the regressions for the relationship between Matrix Reasoning scores and average SRT were different between the groups, we constructed a linear model predicting SRT scores with a categorical group factor (musician/non-musician) and the continuous Matrix Reasoning predictor. There was no evidence of a main effect of musicianship, F(3, 46) = 1.488, p = .229, partial η2 = .031, or interaction between musicianship and Matrix Reasoning score, F(3, 46) = 1.321, p = .256, partial η2 = .028, but there was a significant main effect of Matrix Reasoning Score, F(3, 46) = 5.629, p = .022, partial η2 = .109. This indicates that there was no evidence of a difference in the relationship between average SRT and Matrix Reasoning Scores between the groups. Furthermore, Levene’s test of equality of variance showed that there was no evidence of a difference between the groups in the measure of variability in average SRT, F(1,48) = 1.968, p = .167, and Matrix Reasoning scores, F(1,48) = 1.031, p = .315.
IV. DISCUSSION
This study was conducted in an attempt to replicate the finding that musical training confers a beneficial effect on speech perception in noise, and to interrogate whether this difference was largely due to energetic or informational masking effects. Notably, however, we found no advantage for musicians’ masked speech perception over that of non-musicians, and this did not vary by masker type.
As would be expected based on previous findings (Micheyl et al., 2006; Spiegel and Watson, 1984; Tervaniemi et al., 2005), musicians were found to outperform non-musicians in tests of frequency discrimination. Importantly, though, within musicians and across all participants, frequency discrimination did not correlate with participants’ SRTs in any of the four masker conditions. Thus, it seems that low-level auditory abilities like frequency discrimination do not confer an advantage when it comes to higher-level speech perception. This confirms findings from previous studies showing speech perception to be unrelated to performance on low-level psychoacoustic tasks (e.g., Surprenant & Watson, 2001), and suggests that there is no simple shared mechanism between frequency discrimination and speech perception in noise abilities. These results also support previous studies that have found a large musician advantage for tasks that rely heavily on frequency perception, but only a small and inconsistent (Fuller et al., 2014), or non-existent (Ruggles et al., 2014), musician advantage in speech perception tasks.
The variability of empirical demonstrations of musicians’ advantage in masking tasks may be due to the types of stimuli used. Oxenham et al. (2003) used sinusoidal tones embedded in both continuous noise and two types of multi-tone maskers with different predictabilities, and found musicians to be less affected by informational masking than non-musicians. However, this task relies on being able to selectively attend to a narrow frequency band, which could be aided by musicians’ well-documented improved frequency discrimination and might not extend to perception of more complex speech stimuli. Further, a recent study by Fuller et al. (2014) suggests that although musicians outperform non-musicians on tasks that rely on frequency discrimination, these benefits do not carry over to the perception of degraded speech. In the speech perception task used by Fuller et al. (2014), musicians and non-musicians listened to single words in speech-spectrum steady state noise (at multiple SNRs), as well as sentences in speech-spectrum steady state noise, speech-spectrum fluctuating noise, or six-talker babble. Additionally, all stimuli were presented both unprocessed and processed by an eight-channel sinewave vocoder, which degrades the spectro-temporal information in normal speech. No musician advantage was observed in any condition for the perception of sentences, and the only condition in which musicians showed improved performance was the most challenging condition: vocoded single word identification when the background noise was presented at +5 dB SNR. Indeed, Parbery-Clark et al. (2009) only found differences between musicians and non-musicians when masking and target sounds were co-located, rather than in conditions where the sounds were separated in space, suggesting that differences between groups may only arise when masking tasks require greatest effort. However, Ruggles et al. (2014) presented musicians and non-musicians with voiced and whispered sentences, in either continuous or fluctuating noise, in order to investigate whether musicians’ improved performance in previous studies was due to improved encoding of periodicity in normal speech (Parbery-Clark et al., 2011). They found no significant effect of musicianship with co-located sounds even when repeating the exact clinical assessments used by Parbery-Clark et al. (2009).
In our masked speech task, we found no musicianship advantage or any condition-specific differences between the groups, despite using similar target sentences and a co-located speech-spectrum steady-state noise masker with adaptive tracking, as had been used by Parbery-Clark et al. (2009). Parbery Clark et al. demonstrated a difference between groups with both a speech-spectrum noise (HINT) and a four-talker babble (Quick SIN). Both of these sounds are mostly energetic in nature, and compared to a single competing talker, are low in informational masking. To extend these findings, we sought to test for differences between musicians and non-musicians using maskers that differed more widely in their energetic and informational masking properties, in order to gain a better mechanistic understanding of the musicianship advantage. By including a steady-state and modulated noises, as well as maskers with and without a clear pitch, we could identify whether putative differences between the groups were associated with exploiting “glimpses” of the target (which may have reflected a temporal processing advantage) and/or pitch processing. However, we did not find a condition by musicianship interaction which would have supported these proposed mechanisms.
The lack of observed group differences in the current study was despite a larger sample size and nearly identical criteria for recruiting musicians as those used previously in studies reporting significant effects of musicianship (Parbery-Clark et al., 2009). To further understand the discrepancy between our results and those of past studies, we calculated a 95% confidence interval around our observed effect size for the main effect of musical experience on SRTs. The size of the confidence interval means that results could differ considerably across samples from “no effect” to a “large effect”, leading to occasions where group differences in speech perception are not observed (Fuller et al., 2014; Ruggles et al., 2014) as well as occasions when they are (Parbery-Clark et al., 2009). It should be noted that in previous studies, the absolute difference between musicians’ and non-musicians’ scores on clinical speech-in-noise measures was small (<1 dB), even when these differences were statistically significant (Parbery-Clark et al., 2009). This small advantage could be an additional reason for the lack of replication in our experiment. Furthermore, if the difference between musicians’ and non-musicians’ SRTs is less than 1 dB, it is unlikely to have much significance in a non-experimental setting.
We did, however, find a significant relationship between non-verbal IQ (as measured by the WASI Matrix Reasoning task) and overall masked speech thresholds, such that participants with higher nonverbal IQ scores had lower average SRTs (indicative of better performance). In general, performance on any range of tests sensitive to individual differences in the general population will positively correlate with each other, and the first principle component accounting for that shared variance will be general cognitive abilities (Spearman, 1927). Thus, to claim a specific relationship (e.g. between musicianship and speech perception in noise) it must be demonstrated that this does not simply stem from common loading on cognitive abilities. One way to overcome this is to match musician and non-musician participants on tests known to be highly correlated with general cognitive abilities and which have minimal overlap with the demands of understanding speech in noise. The task used in this experiment, the Matrix Reasoning subtest of the WASI (Wechsler, 1999), is a good example because it has little ostensive requirement for auditory processing or verbal working memory. In addition, we also gathered data about the number of years participants had spent in post-secondary education (linked both to IQ and opportunity), and measured a range of other cognitive functions including auditory working memory, selective attention, and mental flexibility. Thus, it is not entirely surprising that we find a significant effect of general cognitive abilities on our measure of masked speech.
Previous studies on musicians’ speech perception in noise have not consistently examined the effect of cognitive factors in depth, often only examining cognitive variables by testing the difference between group means using a t-test (Parbery-Clark et al., 2011; Strait et al., 2012). The assumption behind this is that because the groups do not differ on cognitive measures, any observed difference between them on the masked speech task is due to their musical experience. However, without doing a multiple regression and including the cognitive measure(s) as a continuous regressor, the roles of cognitive measures versus musical experience cannot be established. Strikingly, in a study which included working memory as a factor in a hierarchical regression analysis, the addition of years of musical experience as a predictor explained only an additional 6% of the variance in clinical speech-in-noise scores (Parbery-Clark et al., 2009). Also, in this particular study, the number of years of musical experience only correlated with one (QuickSIN) of the two clinical speech-in-noise measures used (QuickSIN and HINT). Parbery-Clark et al. (2009) acknowledged that musicians’ advantage on the QuickSIN test could be largely attributable to better working memory.
The results of this experiment suggest that there is no significant difference between the cognitive abilities of musicians and non-musicians, but that across all participants, non-verbal IQ is a significant predictor of performance on masked speech tasks. These results are in contrast to the recent study by Ruggles et al. (2014), which found a significant difference in the full scale IQs of musicians and non-musicians, but no significant relationship between IQ and SRTs. This inconsistency is further evidence that the relationship between musical training and general cognitive abilities is complex and remains controversial (Schellenberg and Peretz, 2008). Cross-sectional designs make drawing inferences about musicianship problematic, as children with better cognitive abilities may be more predisposed to begin music lessons, and children who opt to take up music lessons may exhibit pre-existing personality differences compared to those who do not (Corrigall et al., 2013). Longitudinal studies examining the effect of musical training may help to address these issues in the future (Kraus et al., 2014). Despite the ambiguity of the causal relationship between the two, cognitive abilities often co-vary with musical training, making it an important factor to consider in any study with musicians. The results of the current study support a relationship between nonverbal IQ and speech perception in noise, which is consistent with previous observations (Akeroyd, 2008). Consequently, future studies must account for general cognitive abilities when investigating any potential differences between musicians and non-musicians, and more detailed experiments are necessary to identify specific aspects of cognitive and personality differences that may underlie any observed individual differences in speech perception in noise.
There clearly are differences across individuals in how well they cope with masked speech. The results from this experiment demonstrate the necessity of accounting for general cognitive abilities before attributing observed group differences to musical training. An advantage for perceiving masked speech has potential implications for therapeutic interventions for individuals who exhibit difficulties with comprehending speech in noisy environments. Efforts to devise treatments using music have already begun, and show promise (Kraus, 2012; Song et al., 2008, 2011); however, more effective therapies would result from a better understanding of the specific aspects of musical training, such as working memory or selective attention, that lead to superior performance – if indeed musical training leads to better performance at all.
ACKNOWLEDGEMENTS
This work is supported by grants from the Wellcome Trust (WT090961MA) and the US-UK Fulbright Commission.
Footnotes
PACS numbers: 43.66.Dc, 43.72.Dv, 43.75.St
Contributor Information
Stuart Rosen, Speech, Hearing & Phonetic Sciences, University College London, 2 Wakefield Street, London UK, WC1N 2PF.
César F. Lima, Centre for Psychology at University of Porto, Rua Alfredo Allen 4200-135 Porto, Portugal
Tom Manly, Medical Research Council Cognition and Brain Sciences Unit, Cambridge, 15 Chaucer Road, Cambridge UK, CB2 7EF.
REFERENCES
- Akeroyd MA. Are individual differences in speech reception related to individual differences in cognitive ability? A survey of twenty experimental studies with normal and hearing-impaired adults. Int. J. Audiol. 2008;47:S53–71. doi: 10.1080/14992020802301142. doi:10.1080/14992020802301142. [DOI] [PubMed] [Google Scholar]
- Assmann P, Summerfield Q. The Perception of Speech Under Adverse Conditions. In: Greenberg S, Ainsworth WA, Popper AN, Fay RR, editors. Springer Handb. Audit. Res. 2004. [Google Scholar]
- Bench J, Kowal A, Bamford J. The Bkb (Bamford-Kowal-Bench) Sentence Lists for Partially-Hearing Children. Br. J. Audiol. 1979;13:108–112. doi: 10.3109/03005367909078884. [DOI] [PubMed] [Google Scholar]
- Blesser BA. Perception of Spectrally Rotated Speech. Massachusetts Institute of Technology; 1969. pp. 1–234. [Google Scholar]
- Blesser BA. Speech Perception Under Conditions of Spectral Transformation: I Phonetic Characteristics. J. Speech, Lang. Hear. Res. 1972;15:5–41. doi: 10.1044/jshr.1501.05. [DOI] [PubMed] [Google Scholar]
- Brungart DS. Informational and energetic masking effects in the perception of two simultaneous talkers. J. Acoust. Soc. Am. 2001;109:1101–1109. doi: 10.1121/1.1345696. doi:10.1121/1.1345696. [DOI] [PubMed] [Google Scholar]
- Chan D, Fourcin A, Gibbon D, Granstrom B, Huckvale M, Kokkinakis G, Kvale K, et al. EUROM—A spoken language resource for the EU; Proc. 4th Eur. Conf. Speech Commun. Speech Technol.; 1995.pp. 867–870. [Google Scholar]
- Corrigall KA, Schellenberg EG, Misura NM. Music training, cognition, and personality. Front. Psychol. 2013;4:222. doi: 10.3389/fpsyg.2013.00222. doi:10.3389/fpsyg.2013.00222. [DOI] [PMC free article] [PubMed] [Google Scholar]
- Faul F, Erdfelder E, Lang AG, Buchner A. G*Power 3: a flexible statistical power analysis program for the social, behavioral, and biomedical sciences. Behav. Res. Methods. 2007;39:175–91. doi: 10.3758/bf03193146. [DOI] [PubMed] [Google Scholar]
- Fujioka T, Trainor LJ, Ross B, Kakigi R, Pantev C. Musical training enhances automatic encoding of melodic contour and interval structure. J. Cogn. Neurosci. 2004;16:1010–21. doi: 10.1162/0898929041502706. doi:10.1162/0898929041502706. [DOI] [PubMed] [Google Scholar]
- Fuller CD, Galvin JJ, Maat B, Free RH, Başkent D. The musician effect: does it persist under degraded pitch conditions of cochlear implant simulations? Front. Neurosci. 2014;8:179. doi: 10.3389/fnins.2014.00179. doi:10.3389/fnins.2014.00179. [DOI] [PMC free article] [PubMed] [Google Scholar]
- Gaudino EA, Geisler MW, Squires NK. Construct validity in the Trail Making Test: what makes Part B harder? J. Clin. Exp. Neuropsychol. 1995;17:529–35. doi: 10.1080/01688639508405143. doi:10.1080/01688639508405143. [DOI] [PubMed] [Google Scholar]
- Grassi M, Soranzo A. MLP: a MATLAB toolbox for rapid and reliable auditory threshold estimation. Behav. Res. Methods. 2009;41:20–28. doi: 10.3758/BRM.41.1.20. doi:10.3758/BRM.41.1.20. [DOI] [PubMed] [Google Scholar]
- Hazan V, Messaoud-Galusi S, Rosen S. The effect of talker and intonation variability on speech perception in noise in children with dyslexia. J. Speech, Lang. Hear. Res. 2013;56:44–62. doi: 10.1044/1092-4388(2012/10-0107). doi:10.1044/1092-4388(2012/10-0107).The. [DOI] [PMC free article] [PubMed] [Google Scholar]
- Helfer KS, Freyman RL. Aging and Speech-on-Speech Masking. Ear Hear. 2008;29:87–98. doi: 10.1097/AUD.0b013e31815d638b. doi:10.1097/AUD.0b013e31815d638b.Aging. [DOI] [PMC free article] [PubMed] [Google Scholar]
- Hentschke H, Stüttgen MC. Computation of measures of effect size for neuroscience data sets. Eur. J. Neurosci. 2011;34:1887–94. doi: 10.1111/j.1460-9568.2011.07902.x. doi:10.1111/j.1460-9568.2011.07902.x. [DOI] [PubMed] [Google Scholar]
- Herholz SC, Zatorre RJ. Musical training as a framework for brain plasticity: behavior, function, and structure. Neuron. 2012;76:486–502. doi: 10.1016/j.neuron.2012.10.011. doi:10.1016/j.neuron.2012.10.011. [DOI] [PubMed] [Google Scholar]
- Jensen AR. Scoring the Stroop Test. Acta Psychol. (Amst) 1965;24:398–408. doi: 10.1016/0001-6918(65)90024-7. [DOI] [PubMed] [Google Scholar]
- Jeon JY, Fricke FR. Duration of Perceived and Performed Sounds. Psychol. Music. 1997;25:70–83. doi:10.1177/0305735697251006. [Google Scholar]
- Kraus N. Biological impact of music and software-based auditory training. J. Commun. Disord. 2012;45:403–10. doi: 10.1016/j.jcomdis.2012.06.005. doi:10.1016/j.jcomdis.2012.06.005. [DOI] [PMC free article] [PubMed] [Google Scholar]
- Kraus N, Slater J, Thompson EC, Hornickel J, Strait DL, Nicol T, White-Schwoch T. Music enrichment programs improve the neural encoding of speech in at-risk children. The Journal of Neuroscience : The Official Journal of the Society for Neuroscience. 2014;34:11913–8. doi: 10.1523/JNEUROSCI.1881-14.2014. doi:10.1523/JNEUROSCI.1881-14.2014. [DOI] [PMC free article] [PubMed] [Google Scholar]
- Levitt H. Transformed Up-Down Methods in Psychoacoustics. J. Acoust. Soc. Am. 1970;2:467–477. [PubMed] [Google Scholar]
- Macleod CM. Half a Century of Research on the Stroop Effect : An Integrative Review. Psychol. Bull. 1991;109:163–203. doi: 10.1037/0033-2909.109.2.163. [DOI] [PubMed] [Google Scholar]
- Messaoud-Galusi S, Hazan V, Rosen S. Investigating Speech Perception in Children With Dyslexia : Is There Evidence of a Consistent Deficit in Individuals ? J. Speech, Lang. Hear. Res. 2011;54:1682–1701. doi: 10.1044/1092-4388(2011/09-0261). doi:10.1044/1092-4388(2011/09-0261)a. [DOI] [PMC free article] [PubMed] [Google Scholar]
- Micheyl C, Delhommeau K, Perrot X, Oxenham AJ. Influence of musical and psychoacoustical training on pitch discrimination. Hear. Res. 2006;219:36–47. doi: 10.1016/j.heares.2006.05.004. doi:10.1016/j.heares.2006.05.004. [DOI] [PubMed] [Google Scholar]
- Oxenham AJ, Fligor BJ, Mason CR, Kidd G. Informational masking and musical training. J. Acoust. Soc. Am. 2003;114:1543–1549. doi: 10.1121/1.1598197. doi:10.1121/1.1598197. [DOI] [PubMed] [Google Scholar]
- Parbery-Clark A, Skoe E, Lam C, Kraus N. Musician enhancement for speech-in-noise. Ear Hear. 2009;30:653–661. doi: 10.1097/AUD.0b013e3181b412e9. [DOI] [PubMed] [Google Scholar]
- Parbery-Clark A, Strait DL, Kraus N. Context-dependent encoding in the auditory brainstem subserves enhanced speech-in-noise perception in musicians. Neuropsychologia. 2011;49:3338–3345. doi: 10.1016/j.neuropsychologia.2011.08.007. doi:10.1016/j.neuropsychologia.2011.08.007. [DOI] [PMC free article] [PubMed] [Google Scholar]
- Pichora-Fuller MK, Schneider BA, Daneman M. How young and old adults listen to and remember speech in noise. J. Acoust. Soc. Am. 1995;97:593–608. doi: 10.1121/1.412282. [DOI] [PubMed] [Google Scholar]
- Rammsayer T, Altenmüller E. Temporal Information Processing in Musicians and Nonmusicians. Music Percept. 2006;24:37–48. [Google Scholar]
- Ruggles DR, Freyman RL, Oxenham AJ. Influence of musical training on understanding voiced and whispered speech in noise. PLoS One. 2014;9:e86980. doi: 10.1371/journal.pone.0086980. doi:10.1371/journal.pone.0086980. [DOI] [PMC free article] [PubMed] [Google Scholar]
- Salthouse TA. What cognitive abilities are involved in trail-making performance? Intelligence. 2011;39:222–232. doi: 10.1016/j.intell.2011.03.001. doi:10.1016/j.intell.2011.03.001. [DOI] [PMC free article] [PubMed] [Google Scholar]
- Schellenberg EG, Peretz I. Music, language and cognition: unresolved issues. Trends Cogn. Sci. 2008;12:44–45. doi: 10.1016/j.tics.2007.11.005. doi:10.1016/j.tics.2007.11.002. [DOI] [PubMed] [Google Scholar]
- Scott SK, Rosen S, Wickham L, Wise RJS. A positron emission tomography study of the neural basis of informational and energetic masking effects in speech perception. J. Acoust. Soc. Am. 2004;115:813. doi: 10.1121/1.1639336. doi:10.1121/1.1639336. [DOI] [PubMed] [Google Scholar]
- Scott SK, Rosen S, Beaman CP, Davis JP, Wise RJS. The neural processing of masked speech: Evidence for different mechanisms in the left and right temporal lobes. J. Acoust Soc. Am. 2009;125:1737–1743. doi: 10.1121/1.3050255. [DOI] [PubMed] [Google Scholar]
- Shinn-Cunningham BG. Object-based auditory and visual attention. Trends Cogn. Sci. 2008;12:182–186. doi: 10.1016/j.tics.2008.02.003. doi:10.1016/j.tics.2008.02.003. [DOI] [PMC free article] [PubMed] [Google Scholar]
- Soderquist DR. Frequency analysis and the critical band. Psychon. Sci. 1970;21:117–119. [Google Scholar]
- Song JH, Skoe E, Banai K, Kraus N. Training to Improve Hearing Speech in Noise: Biological Mechanisms. Cereb. Cortex. 2011;22:1180–1190. doi: 10.1093/cercor/bhr196. doi:10.1093/cercor/bhr196. [DOI] [PMC free article] [PubMed] [Google Scholar]
- Song JH, Skoe E, Wong PCM, Kraus N. Plasticity in the adult human auditory brainstem following short-term linguistic training. J. Cogn. Neurosci. 2008;20:1892–1902. doi: 10.1162/jocn.2008.20131. doi:10.1162/jocn.2008.20131. [DOI] [PMC free article] [PubMed] [Google Scholar]
- Spearman C. The Abilities of Man, Their Nature and Measurement. Macmillan; New York, NY: 1927. pp. 1–470. [Google Scholar]
- Spiegel MF, Watson CS. Performance on frequency-discrimination tasks by musicians and nonmusicians. J. Acoust. Soc. Am. 1984;76:1690–1695. [Google Scholar]
- Stone MA, Füllgrabe C, Mackinnon RC, Moore BCJ. The importance for speech intelligibility of random fluctuations in ‘steady’ background noise. J. Acoust. Soc. Am. 2011;130:2874–81. doi: 10.1121/1.3641371. doi:10.1121/1.3641371. [DOI] [PubMed] [Google Scholar]
- Stone MA, Füllgrabe C, Moore BCJ. Notionally steady background noise acts primarily as a modulation masker of speech. J. Acoust. Soc. Am. 2012;132:317–26. doi: 10.1121/1.4725766. doi:10.1121/1.4725766. [DOI] [PubMed] [Google Scholar]
- Strait DL, Parbery-Clark A, Hittner E, Kraus N. Musical training during early childhood enhances the neural encoding of speech in noise. Brain Lang. 2012;123:191–201. doi: 10.1016/j.bandl.2012.09.001. doi:10.1016/j.bandl.2012.09.001. [DOI] [PMC free article] [PubMed] [Google Scholar]
- Stroop JR. Studies of interference in serial verbal reactions. J. Exp. Psychol. 1935;28:643–662. [Google Scholar]
- Surprenant AM, Watson CS. Individual differences in the processing of speech and nonspeech sounds by normal-hearing listeners. Journal of the Acoustical Society of America. 2001;110:2085–2095. doi: 10.1121/1.1404973. [DOI] [PubMed] [Google Scholar]
- Tervaniemi M, Just V, Koelsch S, Widmann A, Schröger E. Pitch discrimination accuracy in musicians vs nonmusicians: An event-related potential and behavioral study. Exp. Brain Res. 2005;161:1–10. doi: 10.1007/s00221-004-2044-5. doi:10.1007/s00221-004-2044-5. [DOI] [PubMed] [Google Scholar]
- Tukey JW. Exploratory Data Analysis. Addison-Wesley Publishing Company; Reading, MA: 1977. pp. 1–688. [Google Scholar]
- Wechsler D. Wechsler Adult Intelligence Scale - Third Edition. The Psychological Corporation; San Antonio, TX: 1997. [Google Scholar]
- Wechsler D. Wechsler Abbreviated Scale of Intelligence. The Psychological Corporation; San Antonio, TX: 1999. [Google Scholar]
- Wecker NS, Kramer JH, Hallam BJ, Delis DC. Mental flexibility: age effects on switching. Neuropsychology. 2005;19:345–52. doi: 10.1037/0894-4105.19.3.345. doi:10.1037/0894-4105.19.3.345. [DOI] [PubMed] [Google Scholar]
- Zendel BR, Alain C. Concurrent sound segregation is enhanced in musicians. J. Cogn. Neurosci. 2008;21:1488–1498. doi: 10.1162/jocn.2009.21140. doi:10.1162/jocn.2009.21140. [DOI] [PubMed] [Google Scholar]
- Zendel BR, Alain C. Musicians experience less age-related decline in central auditory processing. Psychol. Aging. 2012;27:410–417. doi: 10.1037/a0024816. doi:10.1037/a0024816. [DOI] [PubMed] [Google Scholar]
- Ziegler JC, Pech-Georgel C, George F, Alario F-X, Lorenzi C. Deficits in speech perception predict language learning impairment. Proc. Natl. Acad. Sci. U. S. A. 2005;102:14110–14115. doi: 10.1073/pnas.0504446102. doi:10.1073/pnas.0504446102. [DOI] [PMC free article] [PubMed] [Google Scholar]
- Ziegler JC, Pech-Georgel C, George F, Lorenzi C. Speech-perception-in-noise deficits in dyslexia. Dev. Sci. 2009;12:732–745. doi: 10.1111/j.1467-7687.2009.00817.x. doi:10.1111/j.1467-7687.2009.00817.x. [DOI] [PubMed] [Google Scholar]