

Abstract
Study Objectives:
Both anatomical and nonanatomical traits are important in obstructive sleep apnea (OSA) pathogenesis. We have previously described a model combining these traits, but have not determined its diagnostic accuracy to predict OSA. A valid model, and knowledge of the published effect sizes of trait manipulation, would also allow us to predict the number of patients with OSA who might be effectively treated without using positive airway pressure (PAP).
Design, Participants and Intervention:
Fifty-seven subjects with and without OSA underwent standard clinical and research sleep studies to measure OSA severity and the physiological traits important for OSA pathogenesis, respectively. The traits were incorporated into a physiological model to predict OSA. The model validity was determined by comparing the model prediction of OSA to the clinical diagnosis of OSA. The effect of various trait manipulations was then simulated to predict the proportion of patients treated by each intervention.
Measurements and Results:
The model had good sensitivity (80%) and specificity (100%) for predicting OSA. A single intervention on one trait would be predicted to treat OSA in approximately one quarter of all patients. Combination therapy with two interventions was predicted to treat OSA in ∼50% of patients.
Conclusions:
An integrative model of physiological traits can be used to predict population-wide and individual responses to non-PAP therapy. Many patients with OSA would be expected to be treated based on known trait manipulations, making a strong case for the importance of non-anatomical traits in OSA pathogenesis and the effectiveness of non-PAP therapies.
Citation:
Owens RL, Edwards BA, Eckert DJ, Jordan AS, Sands SA, Malhotra A, White DP, Loring SH, Butler JP, Wellman A. An integrative model of physiological traits can be used to predict obstructive sleep apnea and response to non positive airway pressure therapy. SLEEP 2015;38(6):961–970.
Keywords: arousal threshold, non PAP therapy, obstructive sleep apnea, upper airway anatomy
INTRODUCTION
In addition to compromised upper airway anatomy, other physiological traits are increasingly recognized for their contributions to the development of obstructive sleep apnea (OSA). These nonanatomical traits include: (1) poor pharyngeal muscle responsiveness during sleep, (2) an overly sensitive ventilatory control system (i.e., high loop gain [LG]), and (3) a low respiratory arousal threshold that leads to arousal rather than stable ventilation.1–4 Given the variable adherence to continuous positive airway pressure (CPAP),5,6 we and others have suggested that an alternative approach for nonadherent patients would be targeted manipulation of one or more of the underlying traits that contribute to OSA pathogenesis. However, no such method or model is yet validated to predict how many patients might benefit from non-PAP therapy, or how to guide therapy in an individual patient.
There are several prerequisites before such an approach to OSA management could be attempted. First, the traits would need to be measured in an easy and relatively noninvasive fashion. Second, the traits must be modifiable by existing therapies (medications or devices) that are safe, known to be effective, and acceptable to patients. Third, a model is needed that integrates all of the traits in a given individual and predicts the effect of trait modification on OSA. Such a model could serve as a clinical decision making tool to aid physicians in selecting appropriate therapy, i.e., personalized treatment for OSA.
Advances in the first two areas have been made. We recently described techniques for measuring the aforementioned physiological traits in vivo during sleep by manipulating the CPAP level, in some respects similar to a CPAP titration study.7,8 Measurement of the traits suggests that many patients might be eligible for non-PAP therapies. Using their pharyngeal critical pressure (Pcrit), arousal threshold, loop gain, and muscle responsiveness (PALM) scale, Eckert and colleagues proposed dividing patients with OSA into those who have OSA due to anatomical compromise; those with an anatomical predisposition with other contributing traits; and those with some mild anatomical predisposition to collapse but with other traits largely responsible for their OSA.9 The PALM score is useful because it provides a framework for dividing patients between those who will likely require CPAP (23% in the Eckert article) and those who might be treated with non-CPAP therapies (77%). Potential non-PAP therapies based on trait manipulation have also been described by multiple authors. For example, supplemental oxygen and acetazolamide can reduce loop gain10,11; sedatives such as eszopiclone and trazodone can increase the arousal threshold1,12; and upper airway surgery and weight loss can improve the upper airway anatomy/collapsibility.13,14
To date, however, lack of a validated model has limited the full potential of the aforementioned observations. That is, there is currently no way to predict, based on the underlying traits and the effect sizes of the studied therapies, whether non-CPAP therapies are likely to eliminate OSA. Are patients with OSA with abnormal nonanatomical traits likely to be effectively treated using non-CPAP therapies? A model incorporating the traits and the effect sizes of known trait manipulations could be applied to answer this question in populations of patients with OSA or in individuals. Applied to patients with OSA in general, such a model would help quantify the number of patients likely to be treated with existing non-CPAP therapies, and help determine which potential therapies offer the most promise (or alternatively, potentially avoiding large clinical trials unlikely to show a positive outcome). On an individual basis, knowledge of the traits alone has been of limited benefit to date. In prior studies of non-PAP therapies, patients with OSA are generally a priori selected based on a single abnormal trait targeted by a single therapy.1,10,11 Even with such careful patient selection, success is variable. How non-PAP therapies would be selected and trialed in a wider range of patients is not clear. Some manipulations, such as increasing the arousal threshold, could have side effects (worse hypoxemia/hypercapnia) in unselected patients. Again, a model that incorporates the measured traits and predicts the effect of trait manipulation in an individual is needed.
The aims of our study were: (1) to determine the accuracy of our physiological model to predict OSA in a cohort of patients with and without OSA who underwent trait measurement; (2) to use previously reported effect sizes of various trait manipulations from the literature to estimate the proportion of our patients with OSA who might be successfully treated by one or more trait manipulations; and (3) to determine whether knowledge of the individual underlying traits and targeted therapy would be expected to improve the predicted success rates of non-PAP interventions to treat OSA.
METHODS
Subjects
Subjects with CPAP-treated OSA and healthy controls were recruited from the sleep clinic and the community and underwent both a clinical and a research polysomnogram (PSG) separated by approximately 1 week. Other than OSA, subjects were generally healthy and were not taking any medications known to affect sleep or the other parameters measured in the study. Written, informed consent was given before participation in the study, which was approved by the Human Research Committee at Partners' Healthcare. Many of the subjects in this study have taken part in other research studies in our laboratory9,10; however, the current aims, data, and analysis have not been previously reported.
Clinical PSG
Subjects underwent standard in-laboratory PSG with electroencephalogram (EEG), electro-oculogram, submental and leg electromyogram for sleep staging; nasal pressure and thermistor for airflow measurement; thoracic and abdominal piezoelectric bands for respiratory effort; arterial oxygen saturation monitoring at the finger; and electrocardiogram monitoring for safety. Patients slept supine. Sleep state, arousals, and respiratory events were scored by a registered sleep technician according to standard American Academy of Sleep Medicine Criteria.15 Specifically, a hypopnea was defined by a > 30% reduction in airflow lasting at least 10 sec and accompanied by either a > 3% desaturation in oxygen or an arousal. Hypopneas were classified as obstructive if flow limitation was present (defined as a characteristic peak–plateau or obvious flattening in nasal pressure) or central if no obvious flow limitation occurred.
Research PSG for Trait Measurement
In addition to standard PSG instrumentation, subjects wore a nasal mask (Gel Mask; Respironics, Murrysville, PA, USA) attached to a pneumotachometer (model 3700A; Hans-Rudolph, Kansas City, MO, USA) for measuring airflow. Mask pressure was measured from a port in the mask (Validyne, Northridge, CA, USA). The mask was connected to a positive/negative pressure source (Pcrit3000, Philips-Respironics) to enable rapid switching between CPAP levels. At the start of the study, CPAP was provided at a level that abolished flow limitation and snoring during sleep—the holding pressure. The minute ventilation at this holding pressure is defined as the eupneic ventilation. During stable nonrapid eye movement (NREM) sleep the mask pressure level was lowered to various subtherapeutic levels for 3-min intervals, as has been previously described, in order to cause flow limitation and monitor the individual response.7 Briefly (and shown in Figure 1), the ventilation just after the abrupt drop from the holding level reflects the passive upper airway collapsibility. The passive upper airway anatomy ventilation is defined as the initial (breaths two and three after the pressure drop) minute ventilation at CPAP = 0 cmH2O. This value is determined from all of the pressure drops throughout the night, by linear regression of minute ventilation vs. mask pressure from breaths two and three following each pressure drop. In cases where the airway is closed at atmospheric pressure, the value was determined by extrapolation of this line, and could result in a negative value. At subtherapeutic pressure levels, ventilation will be below eupnea and therefore pCO2 and respiratory drive will increase. The change in ventilation as a function of increasing ventilatory drive reflects the ability of upper airway muscles to improve ventilation. After 3 min, the mask pressure is abruptly returned to the holding pressure. With the upper airway obstruction removed, the increased ventilatory drive will result in an overshoot above the eupneic ventilation. LG (a measure of the sensitivity of the ventilatory control system) is defined as the ratio of this overshoot (ventilatory response) to the decrease in ventilation from baseline (ventilatory disturbance) at the end of the pressure drop. Upper airway gain (UAG) represents the upper airway muscle effectiveness and is defined as the increase in ventilation during the 3-min drop, attributed to muscle recruitment, divided by the ventilatory overshoot (the amount that ventilatory drive has increased). After LG has been measured, and with an appropriate time delay, a ventilatory drive can be calculated for each pressure drop. CPAP drops that resulted in arousal (defined as an abrupt increase in EEG frequency last > 3 sec) from sleep can be used to determine the level of ventilatory drive that results in arousal (the arousal threshold). The data were analyzed using Matlab software (Natick, MA).
Figure 1.
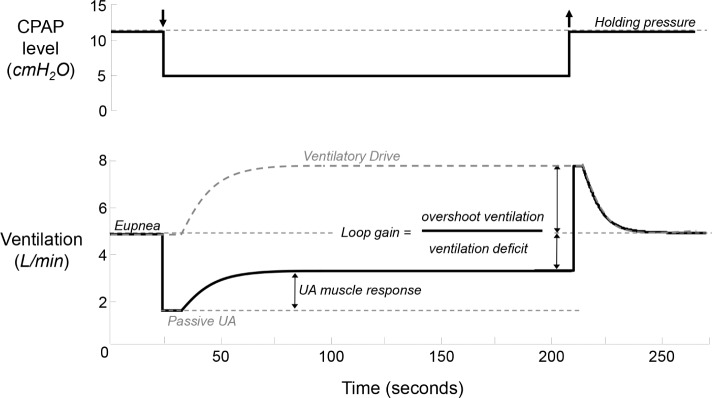
The obstructive sleep apnea traits are measured using repeated continuous positive airway pressure (CPAP) drops from the holding pressure, which defines eupneic ventilation. With abrupt decrease in CPAP, ventilation decreases to a level determined by the passive upper airway anatomy. (The passive upper airway ventilation at different PAP levels allows extrapolation to ventilation off of PAP.) Allowing time for delay, the decrease in ventilation causes an increase in pCO2 and ventilatory drive, which will recruit upper airway muscles and improve ventilation. After 3 min, the therapeutic CPAP level is restored, and the ventilatory drive in response to hypoventilation is revealed–the loop gain. With knowledge of the loop gain, the ventilatory drive that leads to arousal (the arousal threshold) can be determined.
Integrative Model of the Traits to Determine Ventilation during Sleep
The aforementioned traits are measured in units of ventilation (L/min) (e.g., eupneic ventilation, passive upper airway anatomy ventilation, arousal threshold) or in dimensionless units of ventilation/ ventilatory drive (e.g., LG, UAG). Thus, as described in the next paragraphs (and shown in Figure 2), the traits can be plotted on the axes: ventilatory drive versus ventilation.
Figure 2.

Using the traits to model obstructive sleep apnea (OSA). Achievable ventilation is described by the line that begins at the passive upper airway (UA) anatomy ventilation (i.e., ventilation off of positive airway pressure (PAP) at the eupneic ventilatory drive), and which increases according to the ability of the upper airway muscles to augment ventilation in response to the increased ventilatory drive. Desired ventilation begins at the eupneic ventilation (where ventilation = ventilatory demand), and ventilatory demand increases as ventilation falls according to 1/loop gain. The intersection of the two lines represents a new steady state off continuous positive airway pressure (CPAP), which is achieved if the steady state point occurs to the left of the arousal threshold (no OSA). Otherwise, an arousal (scored as hypopnea) will occur (OSA).
Two lines are plotted: a line that describes acceptable ventilation, and another that shows achievable ventilation. Acceptable ventilation begins with the point of eupneic ventilation, which sits on the line of identity because by definition at this point ventilation = ventilatory drive. From this point, decreases in ventilation will result in increases in ventilatory drive—the resulting increase in ventilatory drive is governed by the LG. (As plotted on these axes, the slope of the line is 1/LG.) The achievable ventilation line begins with the point of passive anatomy ventilation at the eupneic ventilatory drive. Increases in ventilatory drive increase ventilation according to the UAG. The intersection of the acceptable and achievable ventilation lines represents a sustainable equilibrium point where the acceptable ventilation is matched by achievable ventilation. However, whether this equilibrium is attained depends on whether this point lies below or above the arousal threshold. That is, if the equilibrium point is below (to the left of) the arousal threshold, then the model predicts that stable breathing will be achieved (with sustainable increases in pCO2 and ventilatory drive) and the subject would be predicted not to have OSA. However, if the equilibrium point is to the right of the arousal threshold, then arousal will occur before the equilibrium point can be reached. This arousal would be scored as an apnea or hypopnea, and thus the subject would be predicted to have OSA.
Validity of the Model for Determining OSA
The aforementioned modeling was performed for all the subjects in the study. The model prediction of OSA (based on an equilibrium point below the arousal threshold) was compared with the clinical diagnosis, and a sensitivity and specificity analysis was performed. In this context, sensitivity measures the proportion of patients with OSA correctly predicted to have OSA by the model, whereas specificity refers to the proportion of normal predicted by the model to be without OSA. Because the traits were measured during NREM sleep, we also assessed the validity of the model using a similar sensitivity/specificity analysis based on the NREM apnea-hypopnea index (AHI) (with 10 events/h as a cutoff).
Estimates of the Effect of Trait Manipulation
In this study, we performed simulated experiments on the model to determine the feasibility of treating OSA with one or more non-PAP therapies. To do so, the effect size of a particular intervention on a particular trait needed to be known, and this information was drawn from the literature. If necessary, the effect size was transposed into changes in ventilation.
LG: has been reduced using supplemental oxygen (51% reduction) and acetazolamide (41%).10,11 For modeling purposes, a 45% reduction was used.
Arousal threshold: has been increased using medications such as eszopiclone (29%) and trazodone (32–48%).1,12,16 A conservative increase of 20% was assumed based on these prior measurements.
Anatomy: Improvement in anatomy with weight loss or upper airway surgery has most often been measured experimentally using pharyngeal collapsibility (Pcrit).13,14 From these prior experiments, we used the published nasal pressure versus peak flow data to estimate the change in peak flow at nasal pressure = 0 cmH2O. In order to convert the changes in peak flow into changes in minute ventilation, we assumed a plateau in flow equal to the peak flow (i.e., square wave form) lasting 1.5 sec and a respiratory rate of 15 breaths per min to estimate the change in minute ventilation. Based on these prior studies, it was estimated that weight loss (substantial, with a change in body mass index of ∼17%) could improve the passive anatomy ventilation by 2.5L/min, and uvulopharyngeoplasty by 1.5 L/min. A change of 2.0 L/min was modeled.
In considering multiple non-PAP therapies (combination therapy), we assumed no interaction between the trait manipulations.
Predicted Success Rates Using Trait Manipulation
We sought to determine the number of patients with OSA with a NREM AHI > 10 events/h in our cohort that might be adequately treated (i.e., NREM AHI reduced below 10 events/h) with each intervention. The aforementioned effect sizes were applied to the physiological model of each such patient. The effect on the distance of the equilibrium point from the arousal threshold was determined (Figure 3). For purposes of this analysis, to consider an individual's OSA “adequately treated” we required the equilibrium point to move at least 1 L/min to the left of the arousal threshold line. This is a more conservative requirement for stable breathing and allows for some noise in trait measurement as well as the response to trait manipulation. If our model is accurate, this would suggest that the trait manipulation would result in an AHI < 10 events/h during supine NREM sleep.
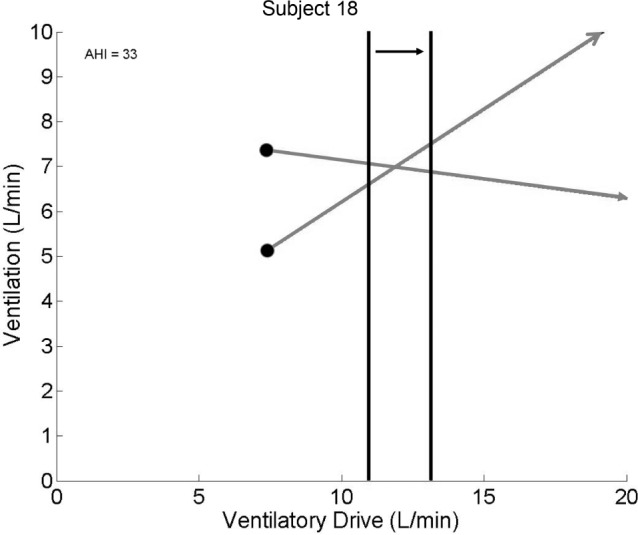
Figure 3.
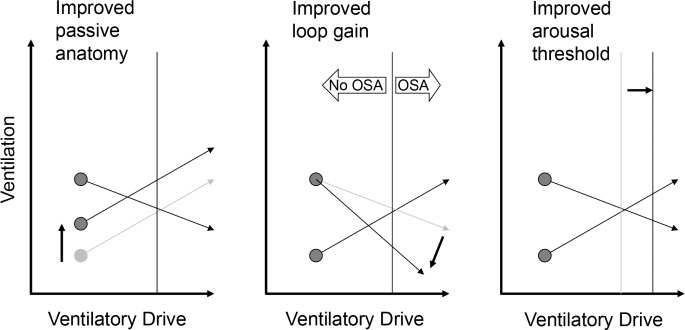
Examples of single-trait manipulation. All of the manipulations shown here move the equilibrium point to the left of the arousal threshold, suggesting that stable flow-limited hypoventilation will occur, rather than arousals. OSA, obstructive sleep apnea.
Effect of Individualized Therapy
We also compared how many patients might have their NREM AHI reduced below 10 events/h (equilibrium point > 1 L/min below the arousal threshold) using the single most effective trait manipulation from the aforementioned analysis with the number of patients predicted to be treated with any single trait manipulation. In other words, are there some patients who might be predicted to be effectively treated with one intervention (e.g., LG lowering agent), but not another (e.g., a drug that increases the arousal threshold)? If so, then knowledge of the traits and model—a targeted approach—may increase the predicted rate of non-PAP treatment success.
Statistical Analysis
The traits were compared between those with a NREM AHI < 10 events/h and those with > 10 events/h using a two-sided t test. A P value of < 0.05 was considered statistically significant. Values are presented as a mean ± standard deviation unless otherwise indicated.
RESULTS
Subjects
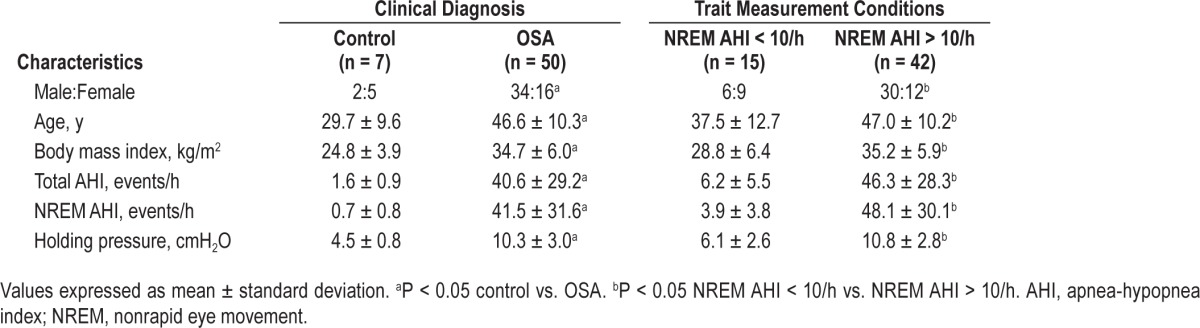
Sixty-three individuals with OSA using CPAP for at least 3 months were studied, and measurements of all four traits were obtained in 50. Thirteen subjects without OSA were also recruited, and complete data were obtained in seven. The characteristics of the subjects are shown in Table 1. Data could not be obtained in 13 individuals with OSA and seven control subjects, who could not achieve or maintain sleep during sustained pressure drops. All individual polysomnographic and trait data are included in Table S1 (supplemental material).
Table 1.
Subject characteristics.
Validity of the Model for Determining OSA
Among the 50 patients in whom OSA was diagnosed clinically, the model correctly predicted OSA in 40 (sensitivity, 80%). In the seven control subjects, the model correctly predicted no OSA in all of them (specificity 100%). The model predictions for each subject can be seen in Table S1.
Of the 10 individuals with false-negative results, 4 had mild disease (AHI < 15 events/h), and 2 had AHI < 20 events/h. In the four other cases, a very robust UAG seemed to protect against OSA. On review of these studies, the UAG measurement reflected increases in ventilation due to repetitive arousals during the pressure drop.
Because the traits were only measured during NREM supine sleep, we also assessed the validity of the model considering only those patients with a NREM AHI > 10 events/h. This yielded minor changes in sensitivity and specificity. Of the 42 subjects with supine NREM AHI > 10 events/h, the model correctly predicted OSA in 38 patients and gave a falsely negative diagnosis in five (sensitivity 88%). In those with NREM AHI < 10 events/h, the model correctly predicted the absence of OSA in 12 patients but with three false-positive results (specificity 80%).
Under these conditions, the five false negatives consisted of one patient with OSA with only mild disease (AHI = 13 events/h), and the same aforementioned four cases with the apparent very robust UAG. Of the three false positives, two had borderline OSA (AHI = 9.5 and 9.9 events/h during supine NREM sleep), and one had REM predominant OSA (NREM AHI 2.5 events/h, REM AHI 25.4 events/h, total AHI 5.3 events/h).
Several model diagrams are shown to emphasize the variability in how the traits combine to produce OSA in different individuals (Figure 4).
Figure 4.

Examples of the traits in eight different individuals. In each example, the obstructive sleep apnea (OSA) severity is listed (AHI, events/h), and a brief description of the salient model features that predispose to or protect against OSA. AHI, apnea-hypopnea index
Predicted Success Rates Using Trait Manipulation
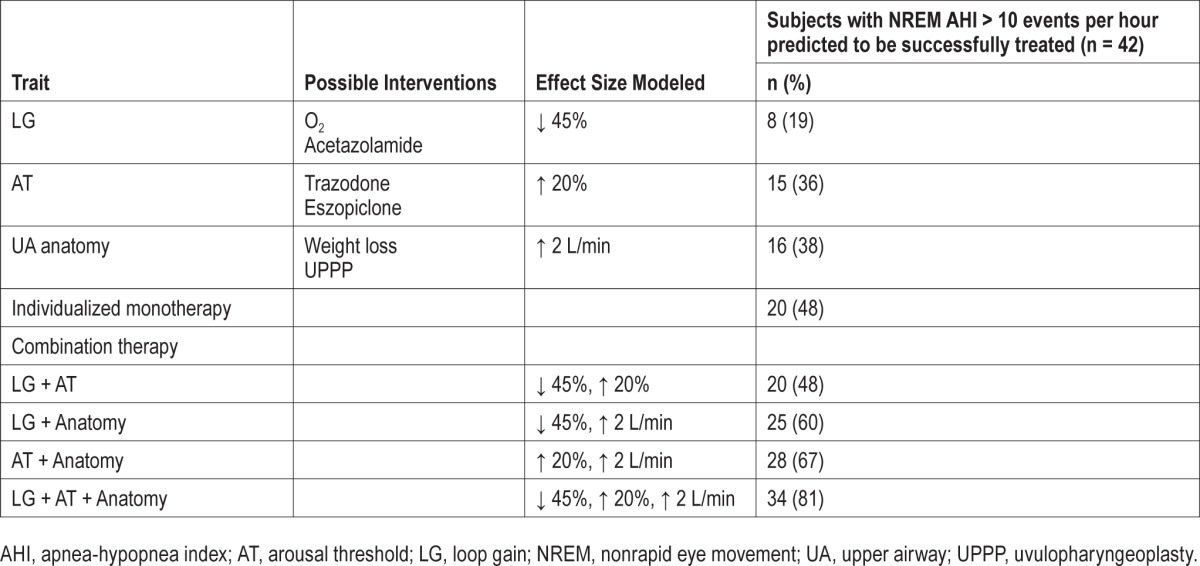
Success rates based on single and combination therapy across the OSA population are shown in Table 2, using a conservative threshold requiring that the equilibrium point be 1 L/min to the left (below) the arousal threshold. Even nonindividualized therapy on one trait would be expected to reduce the NREM AHI below 10 events/h in approximate a quarter of all patients with OSA (range 19–38%), with slight differences based on the trait targeted and the estimated effect size. The responses to a wider range of individual trait manipulations can also be seen in Figures S1 and S2 (supplemental material). Combination therapy with two interventions is predicted to effectively treat OSA in 50% of patients with OSA (range 48–67%).
Table 2.
Predicted effective treatment rates (nonrapid eye movement apnea-hypopnea index reduced below 10 events/h) using single and combination therapies.
Predicted Effect of Individualized Therapy
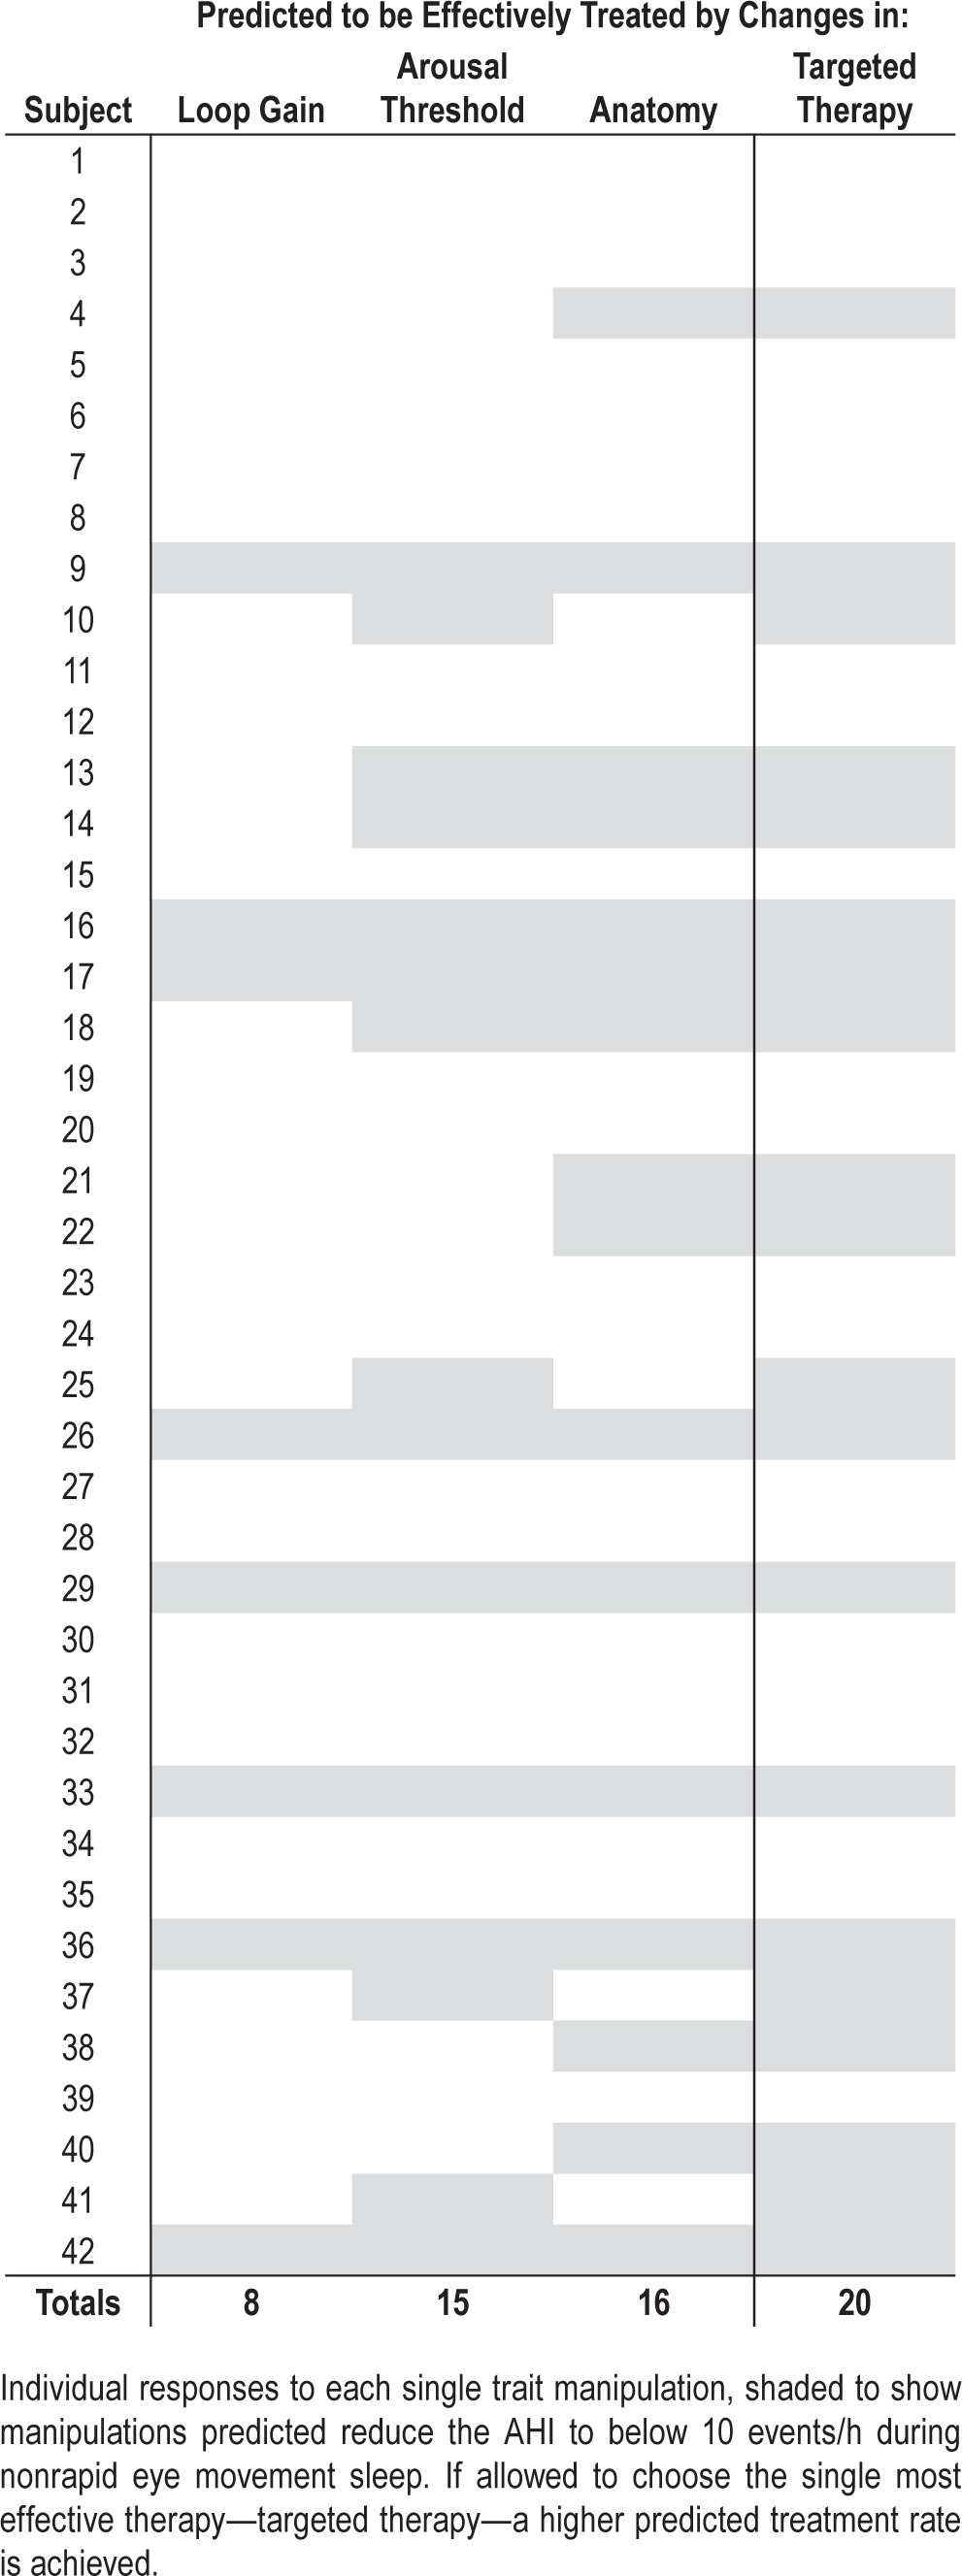
The predicted most effective single trait therapy was improvement in upper airway anatomy, which would be expected to reduce the AHI below 10 events/h in 38% of the cohort. In comparison, with knowledge of the underlying traits and model, a targeted approach using a single intervention would be even more effective and would be predicted to effectively treat OSA in 20 subjects (48% of the cohort) (Table 3).
Table 3.
Individual responses to monotherapy.
DISCUSSION
Herein we present our model that combines the physiological traits important in OSA pathogenesis, and show its high sensitivity and specificity for predicting sleep apnea. Using the model, and with the known effect sizes of trait manipulation, we are able to predict the proportion of patients with OSA who might be treated with existing non-PAP therapies. The obvious advantage of this approach is that it has the potential to reduce the need for large clinical trials, some of which have quite invasive interventions. For example, interventions such as bariatric or upper airway surgery have some morbidity, are costly, and require long-term follow-up to assess response. Using our model, with our expanding pool of patients with traits measured, and with a growing literature of trait manipulation effect sizes, a virtual experiment can be run quickly, cheaply, and with no harm to patients to predict the real world effect of an intervention.
Insights From the Model
There are three major insights from the model. First, there is great heterogeneity in how the traits combine to cause, or protect against, OSA. Although an anatomical predisposition is required (passive anatomy ventilation substantially less than eupneic ventilation) for OSA, in many people the anatomical defect is often minor, with defects in other traits combining to produce OSA (Figure 5). It is readily apparent from the model diagrams that even very abnormal single traits can be overcome by other strong traits, or vice versa, that OSA might arise as a result of a combination of borderline abnormal traits (Figure 4). Our results, we believe, are best explained by the concept of effect modification, i.e., the notion that an exposure has a different effect on an outcome in different groups of subjects. Applied to patients with OSA, the nonanatomical traits have different effects on OSA pathogenesis depending on the underlying anatomy. Specifically, the nonanatomical traits matter little in those with very bad (inevitable OSA) or very good anatomy (no OSA). Only in those with a vulnerable anatomy will the other traits become important in either contributing to or protecting against OSA (Figure 6). Effect modification is useful when considering that the nonanatomical mean trait values are usually similar in patients with and without OSA. For example, UAG is similar in control patients and those with OSA (Figure 7). Only when subjects are stratified according to underlying anatomy (e.g., ventilation “deficit” defined as the difference between eupneic and passive anatomy ventilation) is it obvious that traits more clearly protect against or predispose to OSA, with control subjects having a more robust UAG compared to those with OSA. (See Figures S3 and S4, supplemental material, for data on the remaining traits.) The model allows a graphical representation of how the anatomy and other traits interact in a single individual.
Figure 5.
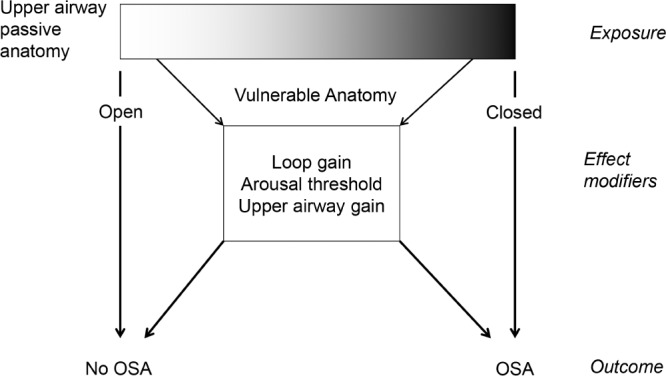
The relationship between anatomy and obstructive sleep apnea (OSA) is straightforward with very favorable (no OSA) or very poor anatomy (inevitable OSA). However, the relationship with intermediate, or vulnerable, anatomy and OSA is modified by the other traits to lead to or protect against OSA. These other traits are effect modifiers: they modify the effect of the exposure (anatomy) on the outcome (OSA status).
Figure 6.
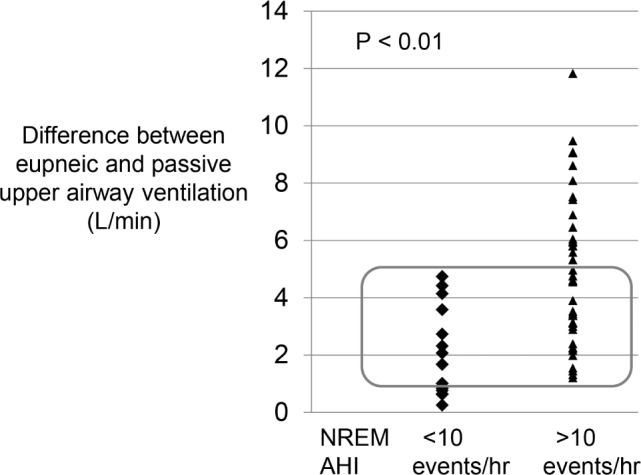
Difference between eupneic and passive upper airway ventilation, representing the deficit in ventilation that must be overcome by recruitment of upper airway muscles. As expected, subjects with NREM AHI > 10 events/h have a significantly greater deficit than those with AHI < 10 events/h. However, there is substantial overlap between the two groups when the deficit in ventilation is between 1–5 L/min. In this range, other non-anatomical traits are likely to protect or promote obstructive sleep apnea. Greater anatomical deficits in ventilation may be impossible to overcome despite other very favorable traits. AHI, apnea-hypopnea index; NREM, nonrapid eye movement.
Figure 7.

Effect modification. In all subjects, there is no significant difference in upper airway gain between subjects with an AHI < 10 events/h and those with an AHI > 10 events per hour during NREM sleep. However, among subjects with a similar ventilation deficit, those with an AHI < 10 events per hour have a substantially higher upper airway gain than those with an AHI > 10 events/h. AHI, apnea-hypopnea index; NREM, nonrapid eye movement.
Second, the major determinant for residual OSA is the distance of the equilibrium point from the arousal threshold ventilation. Any therapy that increases this distance can potentially treat OSA. Although there are patients with a single very abnormal trait, a treatment directed at another trait might still be expected to yield a satisfactory response. For example, a subject with a very high LG might be treated by raising the arousal threshold (see Figure 8). Across the entire cohort of subjects, we examined the role of progressive improvements in each individual trait (Figures S1 and S2). From these data it can be seen that relatively small improvements in arousal threshold are likely to be beneficial for many subjects, whereas relatively larger improvements in anatomy and loop gain will be required to have the same population-wide benefit. From this perspective, the model can help illustrate multiple possible treatments from which clinicians and patients might choose the most well tolerated.
Figure 8.
Although patients may have defects in one trait, therapy toward another trait may still help. This subject with severe obstructive sleep apnea and a very poor loop gain would still be expected to improve with therapy that increased the arousal threshold.
Third, an individualized approach to therapy is still important. Some patients will respond to one treatment, but not another. Knowledge of the underlying traits and model improved the expected treatment rate by 10% above the single most effective, but untargeted, trait therapy. Patients are variable both in their underlying OSA pathophysiology and in their response to treatments. Furthermore, the model can also potentially be used to protect patients from harm from certain non-PAP therapies. For example, increasing the arousal threshold may be ineffective therapy for those with an already high arousal threshold, as in Figure 4, panel C1. Instead, this intervention is likely to prolong hypopneic/apneic events with concomitant worsening in hypercapnia/hypoxemia. Thus, our model could provide the start for a personalized medicine approach to OSA therapy.
Predicted Treatment Rates Using Non-PAP Therapies
With the caveat that further validation studies are required to determine the efficacy and tolerability of non-PAP therapies, the predicted response rates in our cohort are encouraging. Prior investigations have suggested that more than half of patients with OSA have non-anatomical contributions to disease pathogenesis, and implied that such patients might be treated by therapies other than PAP. However, no prior estimate has been provided regarding the possibility of successful treatment with existing non-PAP therapies. Using our model, we predict using well-tolerated, existing monotherapies that approximately 25% of patients with OSA could be successfully treated, defined as a reduction in NREM AHI to below 10 events/hour. Progressive combination therapies are expected to yield even greater success rates. Although combination therapy has been minimally studied in OSA treatment,17–20 the concept is embraced for other chronic illnesses such as hypertension, diabetes, and in the field of oncology to maximize efficacy and minimize side effects. Use of a single medication and an oral appliance may have greater patient acceptance than PAP therapies. Our results emphasize the need to measure the underlying traits important for OSA, and for studies of non-PAP and combination approaches to OSA treatment. As with these other diseases, appropriate studies will be needed to determine whether medications affect more than one trait. In our modeling, we assumed that manipulation of one trait would not affect another trait, although it is possible, for example, that sedatives that improve arousal threshold might worsen upper airway muscle activation.
Limitations of the Model
There are several limitations in the measurement of the traits and in their modeling. First, the traits cannot be measured in all individuals, such as those subjects unable to maintain sleep during the pressure drops and periods of hypoventilation on which our method relies. These are subjects likely to have either a low arousal threshold or a very high LG. Such difficulty could be overcome by measuring the traits after administration of a sedative that would likely alter the arousal threshold, but would be unlikely to alter the other traits.16 Additionally, the methodology to measure the pathogenic traits continues to improve to allow for robust measurements in an increasingly noninvasive fashion.8 Although at this time the equipment and technical ability to measure the traits is confined to a few research sites, this will likely change in the years ahead. As it relates to the analysis here, our bias against those with a low arousal threshold or high LG may mean that we have underestimated the number of patients that could potentially be treated with non-PAP therapies. Second, this first modeling attempt focuses only on NREM and supine sleep, which were the conditions under which the traits were measured. However, the traits may be profoundly affected by changes in sleep state; for example, arousal threshold may vary throughout the night. In practice, the traits could be measured in REM sleep, or assumptions about sleep state changes could be made. The traits could certainly be measured in the lateral position during a research PSG, although this assumes that the lateral position is enforceable in the home.21,22 Third, the modeled traits are assumed to be steady state with no hysteresis and no substantial variability across the night. For example, this suggests that each arousal resets the system to the original starting state. In reality, each arousal may contribute to a cumulative activation of the upper airway musculature eventually leading to pharyngeal stability.23 This dynamic behavior is not captured in our current model and likely contributed to some of the false-negative predictions of the model. We cannot dismiss this behavior because in some patients multiple arousals may then promote stable breathing. Alternatively, the relationship between ventilatory drive and achievable ventilation (i.e., UAG) may not be linear.24 Whatever the nature of this potentially complex relationship, it is encouraging that our simplified model still appears to be useful in most patients. Fourth, the model only loosely predicts OSA severity (data not shown). Thus, treatments that might have clinical benefit (i.e., decreasing AHI from 50 to 15 events/h) will not be considered as successes using the current model. Similarly, we considered OSA to be effectively treated by a reduction in the AHI to < 10 events/h; however, there may be important implications of mild elevations in the AHI, or REM-related OSA. Fifth, the effect sizes of the interventions on the traits are mean values and may differ substantially between individuals. However, the effect size in the model can be varied, and in the aforementioned analyses we have chosen very conservative effect sizes. Finally, we obviously did not do the actual trait manipulations that were modeled to test the validity of the model. Such studies are clearly needed.
CONCLUSIONS
An integrative model of the traits important for OSA can be used to predict population-wide and individual responses to non PAP therapy. A substantial portion of patients with OSA would be expected to be successfully treated based on known trait manipulations. Individually, the model could be used to predict response to different therapies, including limiting potentially ineffective or harmful trait manipulation. However, prospective studies are needed to confirm the model predictions.
DISCLOSURE STATEMENT
This work was supported by the National Institutes of Health: R01HL102321 and K23HL105542. Dr. Edwards is supported by the National Health and Medical Research Council (NHMRC) of Australia's CJ Martin Overseas Biomedical Fellowship (1035115). Dr. Eckert was supported by the American Heart Association (10SDG3510018), an NHMRC of Australia Overseas Biomedical Fellowship (510392), and is currently supported by a NHMRC R.D. Wright Fellowship (1049814). Dr. Sands is supported by NHMRC Early Career Fellowship (1053201) and R.G. Menzies award. Dr. Jordan was supported by the American Heart Association (0840159N) and is currently supported by the Australian Research Council (FT100100203). Dr. Owens consults for Philips Respironics. Dr. Malhotra was a consultant for Philips Respironics, SHC, SGS, Apnex Medical, Pfizer, Apnicure, but has relinquished all outside personal income since May 2012. Dr. White was the chief medical officer for Philips Respironics until December 13, 2012, but is now the chief scientific officer for Apnicure Inc as of January 2013 and a consultant for Philips Respironics. Dr. Wellman has received consulting income from Apnicure, Philips Respironics, and Galleon. Dr. Wellman's interests were reviewed and are managed by the Brigham and Women's Hospital and Partners HealthCare in accordance with their conflict of interest policies. The other authors have indicated no financial conflicts of interest.
ACKNOWLEDGMENTS
The authors wish to thank Lauren Hess, Erik Smales and Karen Stevenson, RPSGTs for helping to collect the data.
SUPPLEMENTAL MATERIAL
Loop gain (LG) in those with NREM AHI < and > 10 events/h, and mean values (horizontal bars) for each group. AHI, apnea-hypopnea index; ArTH, arousal threshold; NREM, nonrapid eye movement.
Arousal Threshold Ventilation in those with NREM AHI < and > 10 events/h, and mean values (horizontal bars) for each group. Consistent with prior reports, the arousal threshold is significantly greater in those with an elevated AHI. AHI, apnea-hypopnea index; NREM, nonrapid eye movement.
The proportion of patients with an NREM AHI > 10 events/h predicted to be successfully treated by improving either loop gain (a reduction in loop gain) or the arousal threshold (an increase in the arousal threshold) by 0 – 100%. Data points in red show the amount of trait manipulation discussed in the manuscript. Please note, the proportion of patients predicted to be effectively treated includes 3 OSA subjects predicted by the model to have no OSA (i.e. false negatives). AHI, apnea-hypopnea index; NREM, nonrapid eye movement; OSA, obstructive sleep apnea.
The proportion of patients with an NREM AHI > 10 events/h predicted to be effectively treated by improvements in the passive anatomy ventilation. The data point in red shows the amount of trait manipulation discussed in the manuscript. Please note, the proportion of patients predicted to be effectively treated includes three OSA subjects predicted by the model to have no OSA (i.e. false negatives). AHI, apnea-hypopnea index; LG, loop gain; NREM, nonrapid eye movement; OSA, obstructive sleep apnea.
Clinical diagnosis, polysomnography data, trait measurements, and model predication for each subject.
REFERENCES
- 1.Eckert DJ, Owens RL, Kehlmann GB, et al. Eszopiclone increases the respiratory arousal threshold and lowers the apnoea/hypopnoea index in obstructive sleep apnoea patients with a low arousal threshold. Clin Sci (Lond) 2011;120:505–14. doi: 10.1042/CS20100588. [DOI] [PMC free article] [PubMed] [Google Scholar]
- 2.Smith PL, Wise RA, Gold AR, Schwartz AR, Permutt S. Upper airway pressure-flow relationships in obstructive sleep apnea. J Appl Physiol. 1988;64:789–95. doi: 10.1152/jappl.1988.64.2.789. [DOI] [PubMed] [Google Scholar]
- 3.White DP. Pathogenesis of obstructive and central sleep apnea. Am J Respir Crit Care Med. 2005;172:1363–70. doi: 10.1164/rccm.200412-1631SO. [DOI] [PubMed] [Google Scholar]
- 4.Younes M, Ostrowski M, Thompson W, Leslie C, Shewchuk W. Chemical control stability in patients with obstructive sleep apnea. Am J Respir Crit Care Med. 2001;163:1181–90. doi: 10.1164/ajrccm.163.5.2007013. [DOI] [PubMed] [Google Scholar]
- 5.Engleman HM, Wild MR. Improving CPAP use by patients with the sleep apnoea/hypopnoea syndrome (SAHS) Sleep Med Rev. 2003;7:81–99. doi: 10.1053/smrv.2001.0197. [DOI] [PubMed] [Google Scholar]
- 6.Kribbs NB, Pack AI, Kline LR, et al. Objective measurement of patterns of nasal CPAP use by patients with obstructive sleep apnea. Am Rev Respir Dis. 1993;147:887–95. doi: 10.1164/ajrccm/147.4.887. [DOI] [PubMed] [Google Scholar]
- 7.Wellman A, Eckert DJ, Jordan AS, et al. A method for measuring and modeling the physiological traits causing obstructive sleep apnea. J Appl Physiol. 2011;110:1627–37. doi: 10.1152/japplphysiol.00972.2010. [DOI] [PMC free article] [PubMed] [Google Scholar]
- 8.Wellman A, Edwards BA, Sands SA, et al. A simplified method for determining phenotypic traits in patients with obstructive sleep apnea. J Appl Physiol. 2013;114:911–22. doi: 10.1152/japplphysiol.00747.2012. [DOI] [PMC free article] [PubMed] [Google Scholar]
- 9.Eckert DJ, White DP, Jordan AS, Malhotra A, Wellman A. Defining phenotypic causes of obstructive sleep apnea. Identification of novel therapeutic targets. Am J Respir Crit Care Med. 2013;188:996–1004. doi: 10.1164/rccm.201303-0448OC. [DOI] [PMC free article] [PubMed] [Google Scholar]
- 10.Edwards BA, Sands SA, Eckert DJ, et al. Acetazolamide improves loop gain but not the other physiological traits causing obstructive sleep apnoea. J Physiol. 2012;590:1199–211. doi: 10.1113/jphysiol.2011.223925. [DOI] [PMC free article] [PubMed] [Google Scholar]
- 11.Wellman A, Malhotra A, Jordan AS, Stevenson KE, Gautam S, White DP. Effect of oxygen in obstructive sleep apnea: role of loop gain. Respir Physiol Neurobiol. 2008;162:144–51. doi: 10.1016/j.resp.2008.05.019. [DOI] [PMC free article] [PubMed] [Google Scholar]
- 12.Heinzer RC, White DP, Jordan AS, et al. Trazodone increases arousal threshold in obstructive sleep apnoea. Eur Respir J. 2008;31:1308–12. doi: 10.1183/09031936.00067607. [DOI] [PMC free article] [PubMed] [Google Scholar]
- 13.Schwartz AR, Gold AR, Schubert N, et al. Effect of weight loss on upper airway collapsibility in obstructive sleep apnea. Am Rev Respir Dis. 1991;144:494–8. doi: 10.1164/ajrccm/144.3_Pt_1.494. [DOI] [PubMed] [Google Scholar]
- 14.Schwartz AR, Schubert N, Rothman W, et al. Effect of uvulopalatopharyngoplasty on upper airway collapsibility in obstructive sleep apnea. Am Rev Respir Dis. 1992;145:527–32. doi: 10.1164/ajrccm/145.3.527. [DOI] [PubMed] [Google Scholar]
- 15.Berry RB, Budhiraja R, Gottlieb DJ, et al. Rules for scoring respiratory events in sleep: update of the 2007 AASM Manual for the Scoring of Sleep and Associated Events. Deliberations of the Sleep Apnea Definitions Task Force of the American Academy of Sleep Medicine. J Clin Sleep Med. 2012;8:597–619. doi: 10.5664/jcsm.2172. [DOI] [PMC free article] [PubMed] [Google Scholar]
- 16.Eckert DJ, Malhotra A, Wellman A, White DP. Trazodone increases the respiratory arousal threshold in patients with obstructive sleep apnea and a low arousal threshold. Sleep. 2014;37:811–9. doi: 10.5665/sleep.3596. [DOI] [PMC free article] [PubMed] [Google Scholar]
- 17.Edwards BA, Sands SA, Owens RL, et al. Combination therapy for the treatment of obstructive sleep apnea. Am J Respir Crit Care Med. 2013;187:A2759. [Google Scholar]
- 18.Oliven R, Tov N, Odeh M, et al. Interacting effects of genioglossus stimulation and mandibular advancement in sleep apnea. J Appl Physiol. 2009;106:1668–73. doi: 10.1152/japplphysiol.91501.2008. [DOI] [PubMed] [Google Scholar]
- 19.Yang D, Zhou HF, Xie Y. Efficacy of uvulopalatopharyngoplasty combined with oral appliance in treatment of obstructive sleep apneahypopnea syndrome. Ir J Med Sci. 2014 Apr 16; doi: 10.1007/s11845-014-1112-5. [Epub ahead of print] [DOI] [PubMed] [Google Scholar]
- 20.Inoue Y, Takata K, Sakamoto I, Hazama H, Kawahara R. Clinical efficacy and indication of acetazolamide treatment on sleep apnea syndrome. Psychiatry Clin Neurosci. 1999;53:321–2. doi: 10.1046/j.1440-1819.1999.00551.x. [DOI] [PubMed] [Google Scholar]
- 21.Oksenberg A, Gadoth N. Are we missing a simple treatment for most adults sleep apnea patients? The avoidance of the supine sleep position. J Sleep Res. 2014;23:204–10. doi: 10.1111/jsr.12097. [DOI] [PubMed] [Google Scholar]
- 22.Joosten SA, Edwards BA, Wellman A, et al. The effect of body position on physiological factors that contribute to obstructive sleep apnea. Sleep. 2015 Jan 31; doi: 10.5665/sleep.4992. [Epub ahead of print] [DOI] [PMC free article] [PubMed] [Google Scholar]
- 23.Syed Z, Lin HS, Mateika JH. The impact of arousal state, sex, and sleep apnea on the magnitude of progressive augmentation and ventilatory long-term facilitation. J Appl Physiol. 2013;114:52–65. doi: 10.1152/japplphysiol.00985.2012. [DOI] [PMC free article] [PubMed] [Google Scholar]
- 24.Loewen AH, Ostrowski M, Laprairie J, Maturino F, Hanly PJ, Younes M. Response of genioglossus muscle to increasing chemical drive in sleeping obstructive apnea patients. Sleep. 2011;34:1061–73. doi: 10.5665/SLEEP.1162. [DOI] [PMC free article] [PubMed] [Google Scholar]
Associated Data
This section collects any data citations, data availability statements, or supplementary materials included in this article.
Supplementary Materials
Loop gain (LG) in those with NREM AHI < and > 10 events/h, and mean values (horizontal bars) for each group. AHI, apnea-hypopnea index; ArTH, arousal threshold; NREM, nonrapid eye movement.
Arousal Threshold Ventilation in those with NREM AHI < and > 10 events/h, and mean values (horizontal bars) for each group. Consistent with prior reports, the arousal threshold is significantly greater in those with an elevated AHI. AHI, apnea-hypopnea index; NREM, nonrapid eye movement.
The proportion of patients with an NREM AHI > 10 events/h predicted to be successfully treated by improving either loop gain (a reduction in loop gain) or the arousal threshold (an increase in the arousal threshold) by 0 – 100%. Data points in red show the amount of trait manipulation discussed in the manuscript. Please note, the proportion of patients predicted to be effectively treated includes 3 OSA subjects predicted by the model to have no OSA (i.e. false negatives). AHI, apnea-hypopnea index; NREM, nonrapid eye movement; OSA, obstructive sleep apnea.
The proportion of patients with an NREM AHI > 10 events/h predicted to be effectively treated by improvements in the passive anatomy ventilation. The data point in red shows the amount of trait manipulation discussed in the manuscript. Please note, the proportion of patients predicted to be effectively treated includes three OSA subjects predicted by the model to have no OSA (i.e. false negatives). AHI, apnea-hypopnea index; LG, loop gain; NREM, nonrapid eye movement; OSA, obstructive sleep apnea.
Clinical diagnosis, polysomnography data, trait measurements, and model predication for each subject.