Abstract
The amounts of carbon allocated to the fungal partner in ectomycorrhizal associations can vary substantially depending on the plant growth and the soil nutrient conditions, and the fungus may frequently be confronted with limitations in carbon. We used chemical analysis and transcriptome profiling to examine the physiological response of the ectomycorrhizal fungus Paxillus involutus to carbon starvation during axenic cultivation. Carbon starvation induced a decrease in the biomass. Concomitantly, ammonium, cell wall material (chitin) and proteolytic enzymes were released into the medium, which suggest autolysis. Compared with the transcriptome of actively growing hyphae, about 45% of the transcripts analyzed were differentially regulated during C-starvation. Induced during starvation were transcripts encoding extracellular enzymes such as peptidases, chitinases and laccases. In parallel, transcripts of N-transporters were upregulated, which suggest that some of the released nitrogen compounds were re-assimilated by the mycelium. The observed changes suggest that the carbon starvation response in P. involutus is associated with complex cellular changes that involves autolysis, recycling of intracellular compounds by autophagy and reabsorption of the extracellular released material. The study provides molecular markers that can be used to examine the role of autolysis for the turnover and survival of the ectomycorrhizal mycelium in soils.
Keywords: autolysis, autophagy, ammonium release, basidiomycete, transcriptome
The mycelium of an ectomycorrhizal fungus responds rapidly to carbon starvation by disruptions of cell walls and release of cellular material.
Graphical Abstract Figure.
The mycelium of an ectomycorrhizal fungus responds rapidly to carbon starvation by disruptions of cell walls and release of cellular material.
INTRODUCTION
Most boreal and northern temperate forest tree species live in symbiosis with ectomycorrhizal (ECM) fungi (Smith and Read 2008). In these ecologically important associations, the fungus provides the plant with mineral nutrients, and in return the plant supplies the fungus with photosynthetically derived carbohydrates. This carbon (C) supports the growth of an extramatrical mycelium (EMM) (Smith and Read 2008). It is known that the growth and turnover of the EMM is dependent on the plant C (Högberg and Högberg 2002; Högberg et al. 2010). A laboratory study by Leake et al. (2001) showed, using 14C pulse labeling of tree seedlings, that the plant C was rapidly allocated through the EMM network and preferentially to the mycelium colonizing litter patches in the soil. When the mycelium had assimilated the nutrients, the flow of plant C ceased and the biomass of the mycelium in the litter patches declined. The plant C supply for EMM production can be affected by many biotic and abiotic factors, such as plant properties, forest management, growth season, nutrient conditions in the soil and global change including elevated CO2 levels and increased nitrogen (N) deposition (Ericsson 1995; Högberg et al. 2010; Ekblad et al. 2013). For example, both field studies (Arnebrant and Söderström 1992; Kjøller et al. 2012; Bahr et al. 2013) and microcosm studies (Wallander and Nylund 1992; Arnebrant 1994) have shown that the biomass of EMM decreases under increased N loads.
The physiological mechanisms by which ECM fungi respond to conditions of reduced C supplies are poorly characterized. However, there have been studies of this process in other kinds of filamentous fungi, particularly in industrially important fungi, such as the ascomycetes Aspergillus niger and Penicillium chrysogenum, and in the model species Aspergillus nidulans (White et al. 2002; Shin et al. 2009; Nitsche et al. 2012). C-starvation in these fungi leads to autolysis, autophagy and recycling of nutrients (White et al. 2002; Pocsi et al. 2003; Sami et al. 2003; Nitsche et al. 2012; Nitsche et al. 2013).
Autolysis is the multistage self-degradation of cells by hydrolytic enzymes, which leads to leakage of intracellular material (White et al. 2002; Shin et al. 2009). It involves a reduction in biomass, release of ammonium and production of cell wall hydrolytic enzymes and proteases (Nitsche et al. 2012). Autolysis is induced not only by C-starvation but also by limitations in other nutrients, physical stress and aging (White et al. 2002; Shin et al. 2009). It can promote the survival of the mycelium, because actively growing hyphal tips can assimilate the organic compounds liberated from the lysing parts of the culture (Schrickx et al. 1993; White et al. 2002), a process called cryptic growth (Trinci and Righelato 1970; White et al. 2002).
Autophagy is a conserved recycling process found in all eukaryotic cells in which intracellular components are degraded within the vacuole and the resulting compounds are recycled (Pollack, Harris and Marten 2009; Sharon et al. 2009; Feng et al. 2014). The term autophagy can refer to several different phenomena; it can be divided into macro- and microautophagy and can be either selective or non-selective (Pollack, Harris and Marten 2009). Microautophagy is the direct introversion of cytosolic material into the vacuole whereas macroautophagy is the engulfment of cytosolic material by autophagosomes, which subsequently fuse with the vacuole (Pollack, Harris and Marten 2009). Hereafter in this paper, we use autophagy to mean macroautophagy. The autophagy pathways are highly conserved in eukaryotes, and to date over 30 autophagy-related (atg) genes have been identified in Saccharomyces cerevisiae (Voigt and Poeggeler 2013; Feng et al. 2014). In filamentous fungi, autophagy appears to be involved in nutrient recycling during nutrient starvation and in cellular differentiation (Pollack, Harris and Marten 2009). C-starvation in A. niger and A. nidulans is accompanied by the induction of genes related to autophagy (Nitsche et al. 2012; Szilagyi et al. 2013). Most likely, autophagy has an important role in nutrient recycling during C-starvation in these fungi. In addition, studies using A. niger atg mutants suggest that autophagy promotes the survival of the mycelium during C depletion by organelle turnover and protection against cell death (Nitsche et al. 2013).
In this study, we have investigated the physiological response to C-starvation by the EMF Paxillus involutus, by using biochemical analyses and transcriptome profiling. Paxillus involutus is a common ECM basidiomycete, widely distributed throughout the Northern Hemisphere and forms ectomycorrhizae with numerous coniferous and deciduous tree species (Wallander and Söderström 1999). In particular, we assessed whether the physiological and transcriptional changes caused by carbon starvation in P. involutus in axenic cultures is similar to those observed in well-studied ascomycetes; and whether at least some of the released cellular components can be recycled by autophagy, degradation and assimilation. The study is the first system-wide analysis of the carbon starvation response in an ECM fungus and provides molecular markers that can be used to examine the role of autolysis for the turnover and survival of the ECM mycelium in soils.
MATERIALS AND METHODS
Fungal strain and culture conditions
Cultures of P. involutus (Batsch) Fr. (strain ATCC 200175 (www.atcc.org)) (Basidiomycota, Boletales) were maintained aseptically on 1.5% agar plates containing Modified Melin–Norkrans (MMN) medium (composition: 2.5 g l−1 glucose, 500 mg l−1 KH2PO4, 250 mg l−1 (NH4)2HPO4, 150 mg l−1 MgSO4 × 7H2O, 25 mg l−1 NaCl, 50 mg l−1 CaCl2 × 2H2O, 12 mg l−1 FeCl3 × 6H2O and 1 mg l−1 thiamine-HCl; pH 4.0, C/N ratio 18). Inoculum pieces (5 × 5 mm) of P. involutus, from the edge of 7-day-old actively growing cultures, were transferred to Petri dishes (diameter 10 cm) containing 10 ml of liquid MMN medium and a monolayer of glass beads (diameter 4 mm) for fungal growth support (Rineau et al. 2012). All cultures were kept in the dark at 18°C throughout the experiment. After 10 days of incubation, the liquid MMN medium was replaced with liquid MMN medium without (NH4)2HPO4 (pH 3.3) to produce an N-deprived mycelia (Shah et al. 2013). After 24 h, the MMN medium was replaced with new liquid MMN medium modified to 1.5 g l−1 (NH4)2HPO4, generating a C/N ratio of 3. The cultures were incubated for 15 days. At seven time points (day 0, 2, 6, 8, 10, 13 and 15), fungal mycelia and liquid media from three Petri dishes (three biological replicates) were collected for analysis.
At the time of harvest, the diameter of each culture was measured. Each mycelium was collected, rinsed in MilliQ water and lyophilized. The dry weight of the mycelium was subsequently measured. The liquid culture medium was stored at –20°C until analysis.
Chemical analyses
Glucose content of the culture medium was measured colorimetrically using the Glucose Assay Kit (GO) (Sigma-Aldrich, Germany). Ammonium in the culture medium was measured by flow injection analysis (FIA) using an FIAstar 5000 Analyzer (Foss Tecator, Sweden).
The culture medium was analyzed using ATR-FTIR (attenuated total reflectance-Fourier transform infrared) spectroscopy. A total of 20 μl of the culture medium, which had been vacuum concentrated from 1 ml to 50 μl using an AES 1000 SpeedVac (Thermo Scientific, USA), was allowed to evaporate on an ATR crystal (ZnSe, Harrick Scientific Products Inc. USA). The FTIR spectrum was recorded using a Vertex 80v (Bruker, USA) set at continuous sampling and each spectrum was the result of 300 consecutive scans at a resolution of 4 cm−1. The spectrum of the sample in close contact with the ATR crystal was recorded continuously every 5 min until no change in the spectrum was detectable; this change was primarily related to water evaporation.
The chemical changes in the culture medium were also assayed using synchronous fluorescence spectroscopy. The spectra were obtained using an LS50B fluorescence spectrometer (Perkin Elmer, USA) set at 10 nm bandwidth and 25 nm offset (Dl = 25 nm) between excitation and emission.
The concentration of chitin in the medium was measured colorimetrically as previously described (Tsuji, Kinoshita and Hoshino 1969; Plassard, Mousain and Salsac 1982) with the following modification to volumes. One milliliter of lyophilized liquid growth media was hydrolyzed overnight in 100 μl 6 N HCl at 80°C, transforming chitin to glucosamine. After the hydrolysis, 500 μl 1.25 M Na acetate was added to the sample to increase the pH to 3.0. A method previously described (Tsuji, Kinoshita and Hoshino 1969) was then followed using 5-fold reduced volumes, keeping all ratios unaltered. Known concentrations (1–100 μg ml−1) of chitosan (Fluka, Switzerland), dissolved in 1% acetic acid (v/v) were lyophilized and used as standard.
Proteolytic activity was measured using a modified fluorescent method as previously described (Twining 1984; Shah et al. 2013). Fluorescence was measured using an LS50B fluorescence spectrometer (Perkin Elmer) with excitation set to 490 nm and emission set to 525 nm. The protease activity is expressed in trypsin equivalents: one trypsin equivalent corresponds to the fluorescence produced by 1 μg ml−1 of trypsin (Sigma-Aldrich, Germany).
RNA extraction and microarray analysis
Fungal mycelia from four of the time points representing different growth stages: active growth phase (AG, day 2), onset of C-starvation (CS (O), day 6), medium C-starvation (CS (M), day 8) and late C-starvation (CS (L), day 13) were collected. From each time point three biological replicates were collected (for each replicate, mycelia from two Petri dishes were pooled). The mycelia were immediately submerged in liquid N, ground to a fine powder, and stored at –80°C. Total RNA was isolated using the RNeasy Plant Mini Kit (Qiagen, USA) using the RLC buffer and the on-column DNase treatment according to the manufacturer's instructions. Total RNA was eluted in H2O and stored at –20°C. For quality assessments, all samples were inspected using an RNA 6000 Nano kit on a 2100 Bioanalyzer (Agilent, USA).
Transcriptional profiling was performed using a custom-designed microarray (12-plex 135K-oligonucleotide microarray, DesignID: 546871; NimbleGen/Roche, Switzerland) containing probes representing 12 214 transcripts (isotigs) that had been obtained by 454/Roche DNA sequencing and Sanger sequencing (Applied BioSystems, USA) of a number of P. involutus transcriptomes collected during growth on various organic matter extracts and MMN medium (Rineau et al. 2012). Each isotig is represented by up to 10 probes (60-mers) in a tiled design, which is deposited at NCBI Gene Expression Omnibus (GEO accession GPL14950; Edgar, Domrachev and Lash 2002; Ball et al. 2004). Isotig sequence information and putative annotations are available from the Paxillus EST database: http://mbio-serv2.mbioekol.lu.se/Paxillus/Hybrid/ (add ‘paxillus_’ to the isotig ID when searching).
The microarray analyses were performed as single-label hybridizations. For each hybridization and each sample, 10 μg total RNA was used for cDNA synthesis using the SuperScript Double-Stranded cDNA Synthesis Kit (Invitrogen, USA) according to the manufacturer's instructions. Quality of the produced cDNA was assessed using a High Sensitivity DNA Kit on a 2100 Bioanalyzer (Agilent). Samples were labeled using a One-Color DNA Labeling Kit (Cy3) (NimbleGen/Roche) according to the manufacturer's instructions. After labeling, each sample received a Sample Tracking Control (NimbleGen/Roche) and hybridizations were immediately performed in a Hybridization System 4 (NimbleGen/Roche) for at least 16 h according to the manufacturer's instructions. The washing procedure was performed according to the manufacturer's instructions (NimbleGen/Roche) and the slides were finally scanned using an Agilent High-Resolution Microarray Scanner set at 20% PMT and 2 μm of resolution. The raw images were bursted and processed using the NimbleScan software v8.0 (NimbleGen/Roche) and the built-in Robust Multichip Average (RMA) algorithm including quantile normalization for the purpose of removing the effects of systematic variation in the measured fluorescence intensities (Bolstad et al. 2003; Irizarry et al. 2003).
Principal component analysis (PCA) and statistical analyses were performed on normalized (log2-transformed) transcriptional values in Omics Explorer v2.2 (Qlucore, Sweden). The Bejmanini–Hochberger false discovery rate (q) was used to correct for multiple comparisons (Benjamini and Hochberg 1995). The transcriptional data have been deposited at NCBI GEO and are accessible through the GEO SuperSeries accession number GSE54940.
Bioinformatic analyses
Isotig sequences were annotated using information from the Paxillus EST database (see above). The database allows access to UniProt annotations (Apweiler et al. 2004) and Pfam domains (Finn et al. 2014). Isotigs encoding putative peptidases, N-transporters and enzymes and proteins with a possible role in the degradation of organic material were identified as previously described (Rineau et al. 2012; Rineau et al. 2013; Shah et al. 2013). Annotations of transcripts encoding enzymes active on carbohydrates (CAZymes) and those of auxiliary redox activities/enzymes (AAs) were retrieved from the Carbohydrate-Active Enzymes Database (http://www.cazy.org/) (Cantarel et al. 2009; Levasseur et al. 2013). Autophagy-related (atg) genes in the P. involutus genome were identified using annotation of such genes in the Serpula lacrymans and A. niger genomes (Eastwood et al. 2011; Nitsche et al. 2012). Relevant gene models were used as queries to identify putative homologs using the blastp tools available at the JGI P. involutus genome database (http://genome.jgi.doe.gov/Paxin1/Paxin1.home.html). Functional subgroups of the ATG proteins were inferred using information from Feng et al. (2014). Isotigs that were differentially expressed during C-starvation were mapped to the corresponding gene model in the P. involutus genome (Kohler et al. 2015) using blastn. In the manuscript, the protein models are designated Pi:XXXX. Predictions of putative secretory signals were conducted on protein models using SignalP 4.0 (Petersen et al. 2011).
Upregulated transcripts were revealed by comparison of expression levels from the different phases of starvation (CS (O), CS (M), CS (L)) with the levels in the actively growing (AG) mycelium (false discovery rate q ≤ 0.01). Pfam enrichment analysis was done by calculating the number of occurrences of each Pfam domain in the proteins encoded by the upregulated transcripts and in the whole predicted proteome. Frequencies are given as the number of occurrences over the total number of Pfam domains among the upregulated and whole proteome. The probability (P) of observing the frequency of Pfam domains in the secretome and among the upregulated genes by chance was estimated using the hypergeometric distribution. Probabilities were corrected for multiple testing using the Benjamini–Hochberg false discovery rate approach with a threshold of 0.10.
RESULTS
Induction of C-starvation
Transferring mycelium of P. involutus to medium with low C/N ratio induced an initial phase of active growth (Fig. 1a). The biomass and the radial growth of the mycelium increased during the first 6 days of incubation. At day 6, the biomass started to decline while the area of the mycelium continued to increase until ∼10 days of growth. The uncoupled response in biomass and area suggests a thinning of the mycelium.
Figure 1.
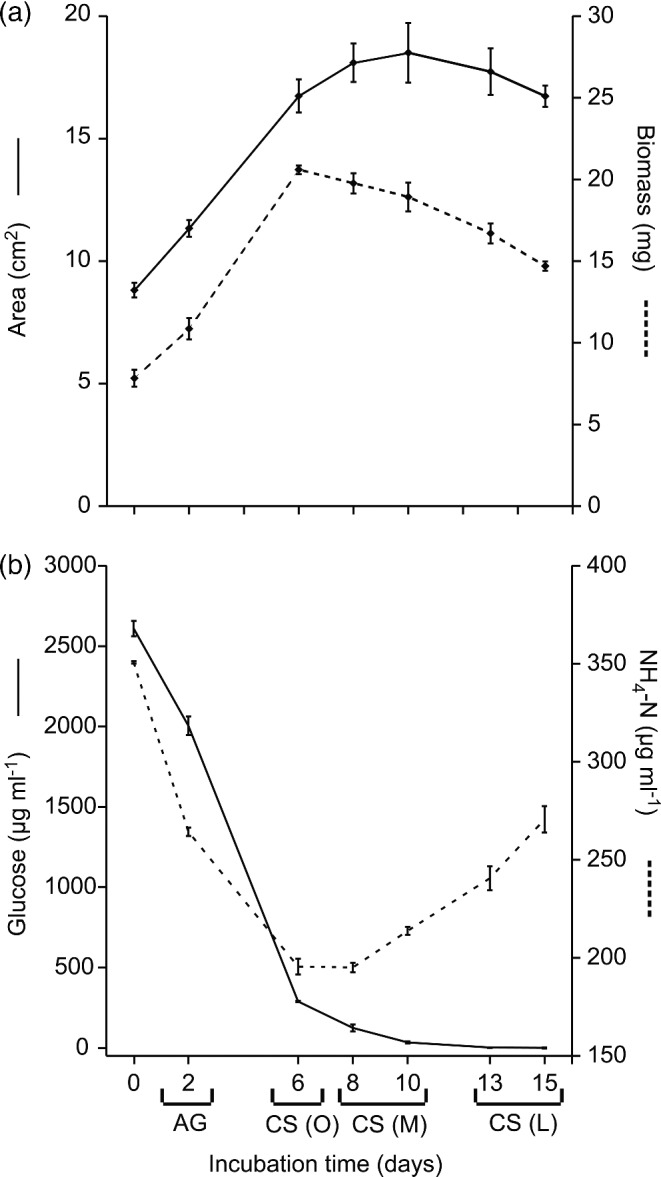
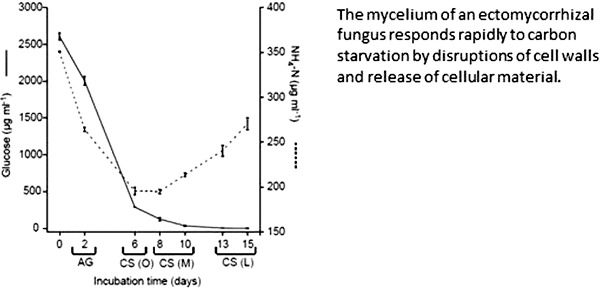
Induction of C-starvation in P. involutus. The fungus was grown on MMN medium (C/N ratio = 18) for 10 days. The medium was then replaced with a modified MMN medium having a C/N ratio of 3 and the mycelium was incubated for up to 15 days; times shown are days after the start of incubation. (a) Biomass and radial growth (n = 3, bars indicate SE). (b) Concentrations of glucose and ammonium in the medium (n = 3, bars indicate SE). (AG) denotes the active growth phase; CS (O), the onset of the C-starvation; CS (M), the medium C-starvation phase; CS (L), the late C-starvation phase.
During the initial phase of active growth, glucose and ammonium were assimilated from the medium by the fungus (Fig. 1b). At day 6, when the biomass started to decline, almost all glucose and a large part of the ammonium had been assimilated by the fungus (Fig. 1b). Thus, at day 6, the C source was no longer sufficient to maintain vegetative growth of the fungus, and we denoted samples from this day as being from the onset of the C-starvation phase (CS (O)). In the following days, concomitant with the decrease in biomass, ammonium was released into the medium and samples collected at day 8 and 10 were denoted as being from the medium C-starvation phase (CS (M)). Samples from day 13 and 15, when both the biomass and area of the mycelium were declining, were designated as being from the late C-starvation phase (CS (L)).
Release of compounds and peptidases in the medium
Analysis of the medium during C-starvation using synchronous fluorescence spectroscopy showed that there was a significant increase in the intensity of a peak located around 280–300 nm (Fig. 2a), which suggests that the fungus were releasing compounds containing monoaromatic functional groups like the amino-acids tyrosine, tryptophan and phenylalanine (Yamashita and Tanoue 2003).
Figure 2.
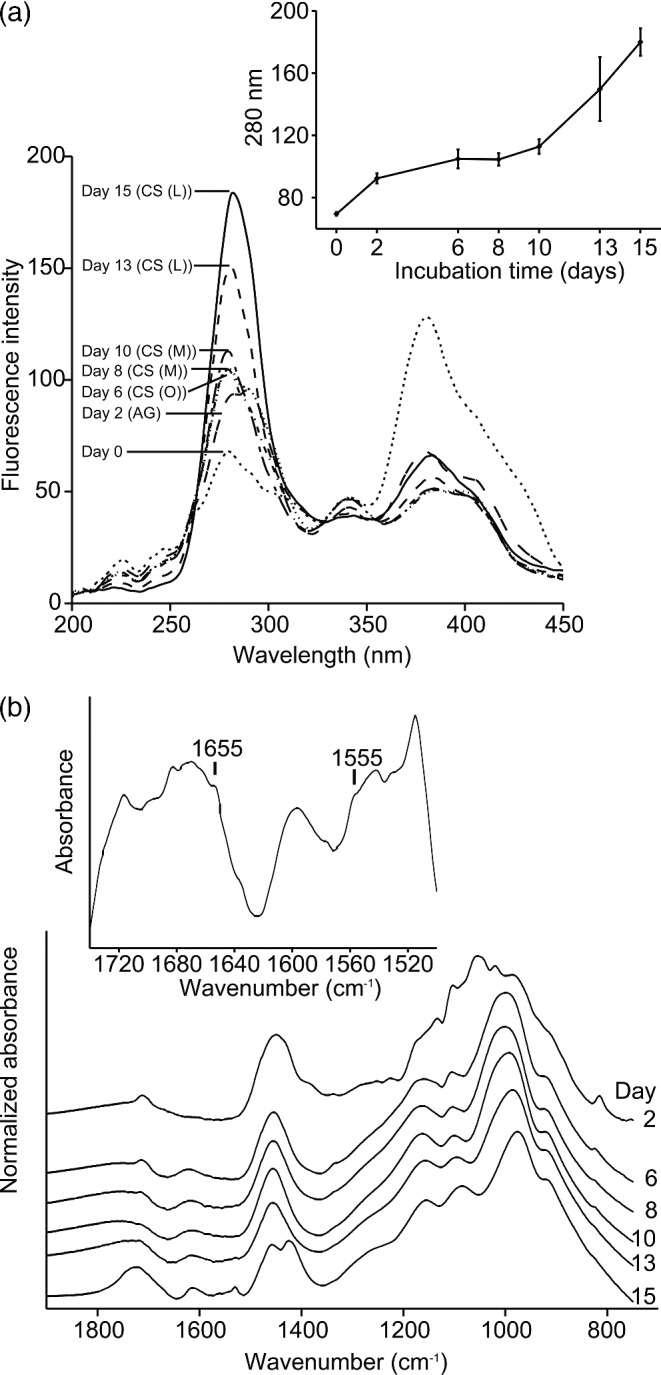
Analysis of compounds released into the medium during C-starvation. (a) Synchronous fluorescence spectroscopy. Inset shows the intensity change of the peak at 280 nm (n = 3, bars indicate SE). (b) FTIR-ATR spectroscopy. Inset shows the difference spectrum: spectrum (day 15)–spectrum (day 13). (AG) denotes the active growth phase; CS (O), the onset of the C-starvation; CS (M), the medium C-starvation phase; CS (L), the late C-starvation phase.
Infrared spectra also indicated compositional changes of the growth medium during the C-starvation phase (Fig. 2b). The initial changes were primarily associated with the disappearance of glucose (bands at 1075, 1104 and 1150 cm−1) in agreement with Fig. 1b. At the end of the starvation phase new bands appeared in the region 1400–1800 cm−1, especially for day 15. The band around 1400 cm−1 could be related to the release of ammonium ions (Fig. 2b) whereas those between 1500–1800 cm−1 likely originated from biopolymers such as polysaccharides and proteins (Colthup, Daly and Wiberley 1990) (Fig. 2b, insert). The shoulders at 1555 and 1655 cm−1 were consistent with chitin (Brugnerotto et al. 2001), but the overlap with protein bands were substantial (Barth 2007). Thus, to verify the presence of chitin, the concentration of chitin in the culture filtrate was estimated using a colorimetric assay. The mean concentration of chitin at day 15 was 17.2 μg ml−1 (SE = 2.5, n = 2) which is considerably higher than the concentration at earlier stages of the starvation [day 13: 6.2 μg ml−1 (SE = 1.1, n = 3); day 10: 6.4 μg ml−1 (SE = 1.4, n = 3); day 8: 7.0 μg ml−1 (SE = 1.8, n = 3); day 6: 9.1 μg ml−1 (SE = 2.5, n = 3)].
The proteolytic activity in the growth medium increased during C-starvation (Fig. 3). The highest level of extracellular proteolytic activity was detected at the late C-starvation phase.
Figure 3.
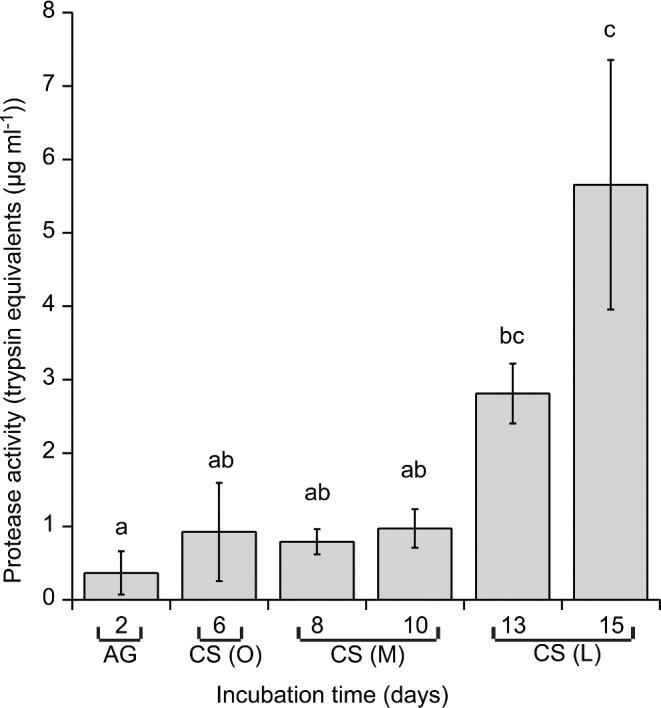
Proteolytic activity released into the media during C-starvation. Different letters indicate significant differences at the 0.05 level according to Tukey's post hoc test on log (sample + 1) transformed values (n = 3, bars indicate SE). (AG) denotes the active growth phase; CS (O), the onset of the C-starvation; CS (M), the medium C-starvation phase; CS (L), the late C-starvation phase.
Transcriptional response
RNA samples from the actively growing mycelium and the different phases of C-starvation were subjected to transcriptome analysis using a DNA microarray. A bioinformatics analysis showed that the microarray contained probes for 41% (7322 out of 17 968) of the predicted protein models in the genome sequence of P. involutus (Kohler et al. 2015) (Table S1, Supporting Information). The cohort of the 7322 proteins contained a large proportions of the genome models assigned to Eukaryotic Orthologous Groups (KOGs) (61% of all models with KOG assignments), enzymes with EC numbers (74%), proteins with Pfam domains (61%), CAZymes (63%), AAs (79%), peptidases (73%) and N-transporters (82%).
A PCA based on gene expression levels showed that C-starvation induced a distinct change in the transcriptome (Fig. 4a). The first axis (explaining 54% of the variability) separated the samples according to their time of C-starvation. The second axis (31%) separates the initial phases of C-starvation (CS (O) and CS (M)) from the AG and late stage of C-starvation (CS (L)). Compared with the active growth phase, 5498 of totally 12 214 transcripts (45%) were differentially expressed during at least one of the starvation phases (Fig. 4b). In total 1986 of the differentially expressed transcripts were up- or downregulated more than 2-fold; 194 transcripts were regulated more than 5-fold. Though, a majority of the regulated transcripts were differentially expressed at specific stages of the starvation, a fraction (723 out of 5498 transcripts) were commonly regulated during all stages (Fig. 4b). A large portion of the commonly regulated transcripts were found to encode proteins with basic cellular functions; 72% of these transcripts were assigned to KOGs, in contrast to 55% of the transcripts that were differentially regulated during starvation (Fig. S1, Supporting Information). The frequencies of transcripts assigned to the KOG classes ‘Translation, ribosomal structure and biogenesis’ and ‘Replication, recombination and repair’ were higher in the cohort of the commonly regulated genes than in the differentially regulated genes.
Figure 4.
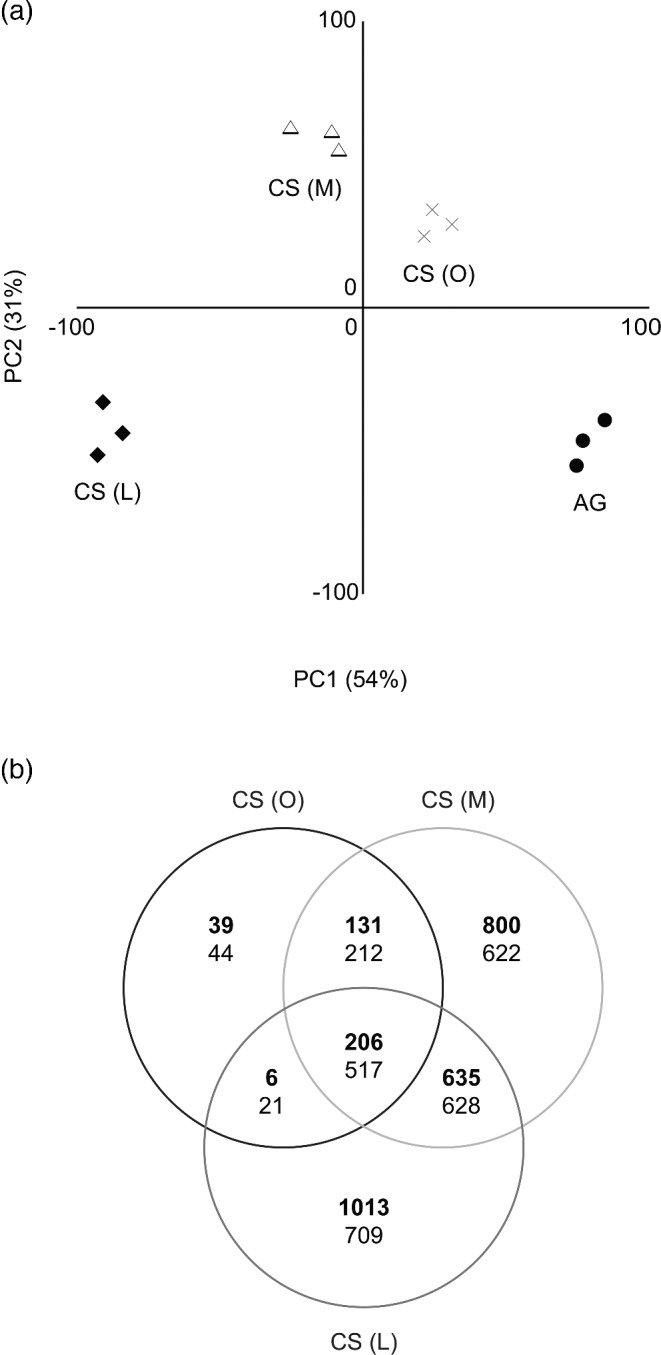
Transcriptional response during C-starvation in P. involutus. (a) PCA plot of the expression levels. The analysis was performed on the expression levels (log2 normalized) of 7677 transcripts out of 12 214 that had a false discovery rate q ≤ 0.01 (n = 3, f-test). Each point in the PCA represents a replicate from one of the different growth phases: active growth phase (AG, day 2), onset of C-starvation (CS (O), day 6), after 2 days (CS (M), day 8), and 7 days (CS (L), day 13) of starvation. (b) Venn diagram showing the number of upregulated transcripts (bold letters) and downregulated transcripts. Differential expression was revealed by pair-wise comparisons of expression levels from the different phases of starvation (CS (O), CS (M), CS (L)) with the levels in the actively growing mycelium (AG) (q ≤ 0.01, n = 3, t-test). In total 5498 transcripts were differentially expressed during at least one of the starvation phases.
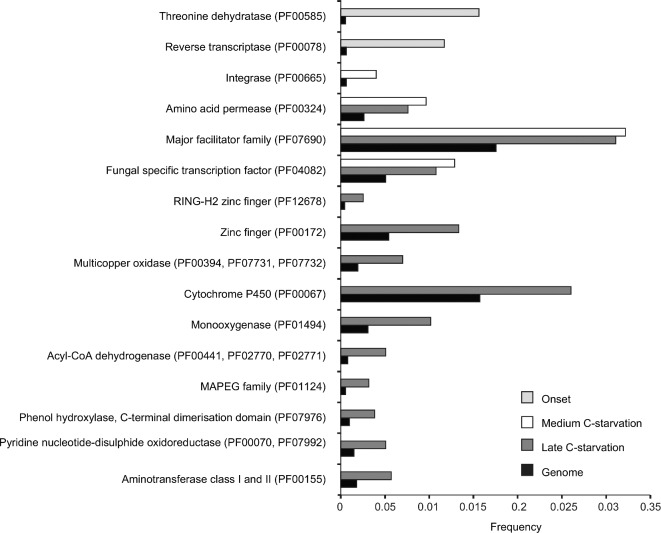
To get an insight into the biological functions that were enriched in P. involutus during C-starvation, we compared the frequency of occurrence of Pfam domains encoded by the upregulated transcripts with those of the proteome. We identified 21 Pfam domains to be enriched during C-starvation (Fig. 5). Among the enriched Pfam domains were those of transporters (amino-acid permease and the major facilitator superfamily), oxidases (multicopper oxidases and the cytochrome P450 superfamily of monoxidases), enzymes of fatty acid β-oxidation (acyl-CoA dehydrogenases) and transcription factors.
Figure 5.
Pfam domains enriched during C-starvation in P. involutus. Shown are the frequencies of the Pfam domains that were significantly (q < 0.10, n = 3) enriched in the upregulated transcriptome in at least one of the pair-wise comparisons between mycelium at the onset of C-starvation, medium C-starvation phase, and the late C-starvation phase versus actively growing mycelium. ‘Genome’ refers to the frequencies of Pfam domain s in the whole proteome.
Secreted enzymes
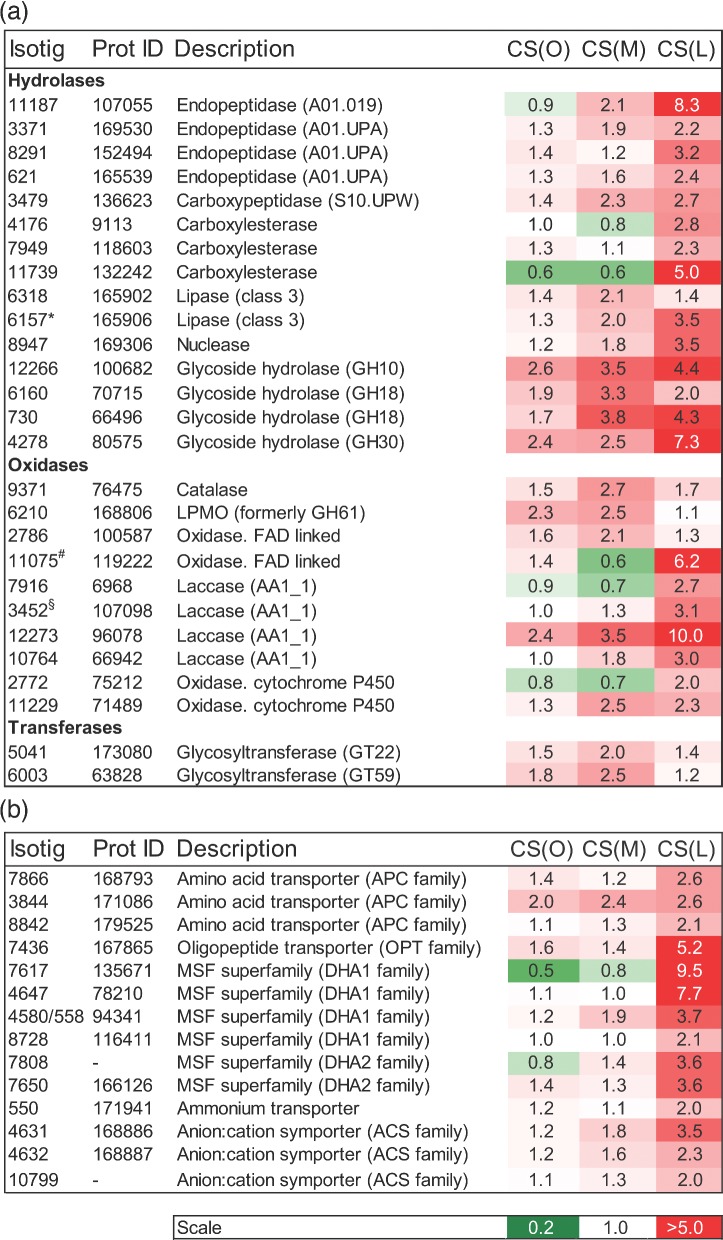
Analyses of the most highly upregulated transcripts during C-starvation showed that many of them encoded extracellular enzymes such as hydrolases, oxidases and transferases (Fig. 6a). Among the hydrolases were four aspartate endopeptidases that were classified into two MEROPS A1 subfamilies: the polyporopepsin (A01.019) and the A01 assigned peptidases. A carboxypeptidase of the S10 subfamily was also upregulated. Three glycoside hydrolases of the GH10, GH18 and GH30 families were significantly upregulated. Family GH18 contains glycoside hydrolases that are both catalytically active chitinases and endo-β-N-acetylglucosaminidases; family GH10 contains endoglucanases/exoglucanases and xylanases; and GH30 has members with three known enzyme activities: β-glucosylceramidase, β-1,6-glucanase and β-xylosidase (Cantarel et al. 2009). The most highly upregulated oxidases encompassed laccases, an oxidase containing the FAD domain and two members of the cytochrome P450 superfamily of monooxygenases.
Figure 6.
Regulation of transcripts predicted to encode extracellular enzymes and nitrogen transporters during C-starvation in P. involutus. Shown are the mean fold values (n = 3) of such transcripts that were differentially regulated (q ≤ 0.01, t-test) and upregulated more than 2-fold in at least one of the pair-wise comparisons between mycelium at the onset of C-starvation (CS (O), day 6), after 2 days (CS (M), day 8), and 7 days (CS (L), day 13) of starvation versus actively growing mycelium ((AG), day 2). ‘Isotig’ refers to transcript ID in the Paxillus EST database. ‘Prot ID’ refers to the predicted protein ID in the P. involutus genome. (a) Extracellular enzymes. The codes in the parentheses following the peptidase names refer to the ID of the families in the MEROPS peptidase database (Rawlings, Barrett and Bateman 2012), those of glycoside hydrolases and glycoside transferases to the families of the CAZy database (Cantarel et al. 2009), and those of auxiliary redox activities/enzymes (Levasseur et al. 2013). LPMO indicates lytic polysaccharide monooxygenase. *Expression values shown are the mean of isotigs 6157, 6158 and 11 305 (all these isotigs matched equally well to the sequence of the protein); #the mean of isotigs 11 075, 11 828, 11 741; §the mean of isotigs 3452 and 3450. (b) Nitrogen transporters. The transporters are classified according to the system previously described (Saier 2000): APC family, the amino-acid-polyamine-organocation superfamily (TC 2.A.3); OPT family, the oligopeptide transporter superfamily (TC 2.A.67); DHA1, Drug:H+ antiporter family (TC 2.A.1.2); DHA2, Drug:H+ antiporter family (TC 2.A.1.3); the ammonium channel transporter family (TC 1.A.11); ACS, the anion:cation symporter family (TC 2.A.1.14).
N-transporters
We identified 14 N-transporters that were significantly upregulated at least 2-fold during C-starvation (Fig. 6b). Similar to the extracellular peptidases, the putative amino-acid transporters were most highly upregulated at the late stage of C-starvation. The upregulated N-transporters included several putative amino-acid and oligopeptide transporters (OPTs) including members of the amino-acid/polyamine/organocation (APC) transporter superfamily (which contains the amino-acid permease Pfam domain PF00324), the OPT superfamily and MFS transporters of the Drug:H+ antiporter (DHA1 and DHA2) families (Fig. 6b). Similar to the extracellular peptidases, these transporters were most prominent at the late stages of C-starvation. A transcript encoding a putative ammonium transporter was also upregulated at this stage.
Autophagy-related proteins
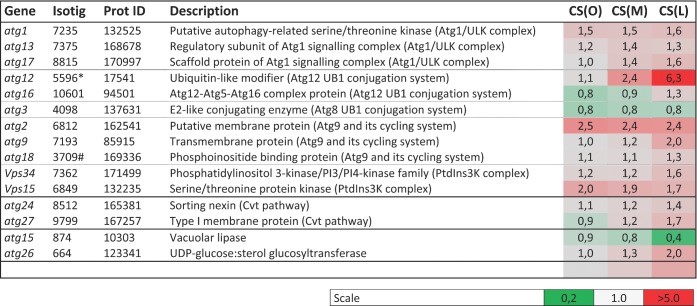
Based on manual annotations, 20 putative atg genes were identified in the genome of P. involutus. Thirteen of these atg genes were significantly upregulated during C-starvation in P. involutus (Fig. 7). Ten of them encode proteins that are required for autophagosome formation, i.e. the core autophagy machinery (Feng et al. 2014). In addition, two of the upregulated atg genes are components of the cytoplasm-to-vacuole-targeting pathway.
Figure 7.
Regulation of transcripts predicted to encode proteins involved in autophagy responses during C-starvation in P. involutus. Shown are the mean fold values (n = 3) of transcripts that were differentially regulated (q ≤ 0.05, t-test) in at least one of the pair-wise comparisons between mycelium at the onset of C-starvation (CS (O), day 6), after 2 days (CS (M), day 8), and 7 days (CS (L), day 13) of starvation versus actively growing mycelium ((AG), day 2). ‘Isotig’ refers to transcript ID in the Paxillus EST database. ‘Prot ID’ refers to the predicted protein ID in the P. involutus genome.*Expression values shown are the mean of isotigs 5996 and 5995 (the isotigs matched equally well to the sequence of the protein); #the mean of isotigs 3709, 413 and 414.
DISCUSSION
Here, we have used chemical and transcriptomic profiling to investigate the response to C-starvation in the ECM basidiomycete P. involutus. The results suggest that this process in P. involutus is similar to that previously observed in saprophytic ascomycetes (White et al. 2002; Pocsi et al. 2003; Pollack, Harris and Marten 2009; Nitsche et al. 2012; Nitsche et al. 2013; Voigt and Poeggeler 2013): initiation of C-starvation-induced autolysis, autophagy and recycling of nutrients. Autolysis was revealed by the appearance of several morphological and molecular markers such as a reduction in biomass, degradation of hyphae, release of ammonium and production of hydrolytic enzymes such as chitinases and peptidases. During later stages of the starvation, components of the core autophagy machinery and various transporters for amino acids and peptides were upregulated which suggest that components released during autolysis can be recycled and hence promote the survival of the mycelium upon C-starvation.
During the early phase of C-starvation in ascomycetes it has been observed that the diameter of the growing hyphae decrease and the hyphal compartments become empty (White et al. 2002; Nitsche et al. 2012). Though, the morphological changes of the starving mycelium of P. involutus was not examined in detail, the observation that the biomass of the mycelium started to decline at the onset of C-starvation while the area continued to increase suggested that C-starvation induced a thinning of the mycelium. During the days following induction of C-starvation, chitin was released into the medium, probably due to fragmentation and/or hydrolysis of cell wall material. Among the upregulated transcripts encoding hydrolytic enzymes were two putative chitinases of the GH18 family, which might have a role in degrading the chitin present in the hyphae of the C-starving cultures of P. involutus. A strong transcriptional induction of chitinases during C-starvation has been observed in several filamentous ascomycetes, such as A. nidulans and A. niger (Nitsche et al. 2012; Szilagyi et al. 2013).
The release of ammonium into the medium during C-starvation in P. involutus suggests that organic N-compounds were degraded and their C-skeletons were used for energy production. Both arginase (EC 3.5.3.1) and urease (3.5.1.5) were significantly upregulated at the time when ammonium was accumulated in the medium (Fig. S2, Supporting Information), suggesting that the ammonium was derived from the degradation of arginine and urea. An alternative pathway for the generation of ammonium is by the activity of glutamate dehydrogenase (EC 1.4.1.2), which catalyzes the deamination of glutamate to ammonium and oxoglutarate. However, this enzyme was not significantly upregulated during C-starvation in P. involutus (Fig. S2, Supporting Information). Hence, a large part of the released ammonium appears to originate from the hydrolysis of arginine and urea. The mechanism by which the produced ammonium is released into the medium by the C-starving mycelium of P. involutus is not known. Two candidates of transporters that could transfer ammonia from the cytosol to the medium are aquaporins and members of the Gpr1/Fun34/yaaH family; the latter includes the ato2/ato3 (ammonium transporter outwards) genes of S. cerevisiae (Guaragnella and Butow 2003; Chalot, Blaudez and Brun 2006; Dietz et al. 2011). We identified two isotigs (13615 and 13585) displaying significant sequence similarity to ato3/ato4 genes and three isotigs (5306, 3967 and 3969) encoding putative aquaporins. However, none of these transcripts were significantly regulated during C-starvation in P. involutus (data not shown). Hence, it is tempting to speculate that the ammonium is not secreted by transporters but is directly released into the medium from the lysed part of the mycelium.
Similarly to recent transcriptome analyses of A. niger (Nitsche et al. 2012) and A. nidulans (Szilagyi et al. 2013), the C-starvation response of P. involutus induced transcription of a number of genes encoding components of the autophagy machinery. Most of them are putative homologs of proteins known to be involved in non-selective autophagy and the formation of the autophagosome (Feng et al. 2014). Thus, autophagy is probably used by P. involutus for the recycling of components in the cytoplasm and for maintaining metabolic capacity during C-starvation.
Analysis of the culture medium suggested that peptides were released into the medium by P. involutus during C-starvation, particularly during the later stages, and proteolytic activity was detected in the culture medium at the same time. It is known that protease induction in P. involutus occurs only in the presence of protein substrate (Shah et al. 2013), so our detection of extracellular proteolytic activity is most likely due to the presence of peptides in the medium. Extracellular proteinaceous material is degraded and assimilated in several steps which has been characterized in detail in P. involutus (Shah et al. 2013). The transcriptome analysis showed that several of those components were significantly upregulated during carbon starvation including extracellular endo- and exopeptidases, as well as several transporters for amino acids and oligopeptides. We found four aspartate endopeptidases to be highly upregulated during the later stages of C-starvation, of which three, the polyporopepsin (Pi:107055) and the unassigned peptidases Pi:169530 and Pi:165539, were previously found to be significantly upregulated in P. involutus during growth on various protein substrates and complex organic matter (Shah et al. 2013). Among the starvation-induced N-transporters were a homolog (Pi:168793) of the well-characterized AAT1 transporter of Amanita muscaria, which is a high-affinity amino-acid transporter with broad substrate affinity (Nehls et al. 1999) as well as a homolog (Pi:171086) to a high-affinity methionine permease in Laccaria bicolor (Lucic et al. 2008). The coordinated regulations of extracellular peptidases and N-transporters during C-starvation support the hypothesis that proteinaceous material being released from lysed hyphae was recycled by intact parts of the mycelium.
We have recently shown that P. involutus has an extensive capacity to degrade complex organic matter using an oxidative mechanism, involving Fenton chemistry similar to that of brown rot wood-decaying fungi (Rineau et al. 2012, Rineau et al. 2013). Based on homology searches, we identified 267 transcripts in the P. involutus EST database that encode enzymes and proteins with a possible role in the degradation of litter material (polysaccharide modifications, aromatic compound degradation, iron reduction, homeostasis and H2O2 production) (Rineau et al. 2012). In total, 30 of these transcripts were upregulated at least 2-fold during C-starvation in P. involutus and 14 of them were also upregulated in P. involutus during litter decomposition (Fig. S3, Supporting Information). These transcripts encoded various oxidases [laccases, aromatic peroxygenases, cytochrome P450 oxidases, tyrosinases and AA9 (formerly GH61)], and a benzoquinone reductase. Based on the similarity of the expression profiles between litter decomposition (Rineau et al. 2012, 2013) and C-starvation (this study), we hypothesize that a radical-based, oxidative decomposition system is induced during the later stages of the C-starvation in P. involutus. Due to the fact that hydroxyl radicals are potent oxidants to a range of different macromolecules including cell wall carbohydrates, membrane lipids, proteins and nucleic acids, the Fenton based decomposing pathway may be of key importance for the recycling of the cellular material that is released during the autolysis of the C-starved mycelium of P. involutus.
The EMM comprise a considerable part of the microbial biomass in forest soils (Högberg and Högberg 2002), and recent studies suggest that the mycelium has a major impact on C-cycling by influencing decomposition as well as formation of soil organic matter (Lindahl and Tunlid 2015). Likely autolysis following C-starvation represents an important pathway leading to the release of mycelial derived material into the soil organic matter pool. The molecular signatures identified in this study can be used as markers to examine this hypothesis in more complex soil systems, and ultimately in the field.
Supplementary Material
Acknowledgments
We thank Dr. Francis Martin for support with the genome sequencing project of P. involutus.
SUPPLEMENTARY DATA
FUNDING
The work was supported by grants from the Swedish Research Council (VR) and the strategic research program Biodiversity and Ecosystem Services in a Changing Climate (BECC). Genome sequencing was conducted by the US Department of Energy Joint Genome Institute, supported by the Office of Science of the US Department of Energy under Contract No. DE-AC02-05CH1123.1.
Conflict of interest. None declared.
REFERENCES
- Apweiler R, Bairoch A, Wu CH, et al. UniProt: the Universal Protein knowledgebase. Nucleic Acids Res. 2004;32:D115–9. doi: 10.1093/nar/gkh131. [DOI] [PMC free article] [PubMed] [Google Scholar]
- Arnebrant K. Nitrogen amendments reduce the growth of extramatrical ectomycorrhizal mycelium. Mycorrhiza. 1994;5:7–15. [Google Scholar]
- Arnebrant K, Söderström B. Effects of different fertilizer treatments on ectomycorrhizal colonization potential in 2 Scots pine forests in Sweden. Forest Ecol Manag. 1992;53:77–89. [Google Scholar]
- Bahr A, Ellström M, Akselsson C, et al. Growth of ectomycorrhizal fungal mycelium along a Norway spruce forest nitrogen deposition gradient and its effect on nitrogen leakage. Soil Biol Biochem. 2013;59:38–48. [Google Scholar]
- Ball CA, Brazma A, Causton H, et al. Submission of microarray data to public repositories. PLoS Biol. 2004;2:1276–7. doi: 10.1371/journal.pbio.0020317. [DOI] [PMC free article] [PubMed] [Google Scholar]
- Barth A. Infrared spectroscopy of proteins. BBA-Bioenergetics. 2007;1767:1073–101. doi: 10.1016/j.bbabio.2007.06.004. [DOI] [PubMed] [Google Scholar]
- Benjamini Y, Hochberg Y. Controlling the false discovery rate: a practical and powerful approach to multiple testing. J Roy Stat Soc B. 1995;57:289–300. [Google Scholar]
- Bolstad BM, Irizarry RA, Åstrand M, et al. A comparison of normalization methods for high density oligonucleotide array data based on variance and bias. Bioinformatics. 2003;19:185–93. doi: 10.1093/bioinformatics/19.2.185. [DOI] [PubMed] [Google Scholar]
- Brugnerotto J, Lizardi J, Goycoolea FM, et al. An infrared investigation in relation with chitin and chitosan characterization. Polymer. 2001;42:3569–80. [Google Scholar]
- Cantarel BL, Coutinho PM, Rancurel C, et al. The Carbohydrate-Active EnZymes database (CAZy): an expert resource for Glycogenomics. Nucleic Acids Res. 2009;37:D233–8. doi: 10.1093/nar/gkn663. [DOI] [PMC free article] [PubMed] [Google Scholar]
- Chalot M, Blaudez D, Brun A. Ammonia: a candidate for nitrogen transfer at the mycorrhizal interface. Trends Plant Sci. 2006;11:263–6. doi: 10.1016/j.tplants.2006.04.005. [DOI] [PubMed] [Google Scholar]
- Colthup NB, Daly LH, Wiberley SE. Introduction to Infrared and Raman Spectroscopy. San Diego, CA: Academic Press; 1990. [Google Scholar]
- Dietz S, von Buelow J, Beitz E, et al. The aquaporin gene family of the ectomycorrhizal fungus Laccaria bicolor: lessons for symbiotic functions. New Phytol. 2011;190:927–40. doi: 10.1111/j.1469-8137.2011.03651.x. [DOI] [PubMed] [Google Scholar]
- Eastwood DC, Floudas D, Binder M, et al. The plant cell wall-decomposing machinery underlies the functional diversity of forest fungi. Science. 2011;333:762–5. doi: 10.1126/science.1205411. [DOI] [PubMed] [Google Scholar]
- Edgar R, Domrachev M, Lash AE. Gene Expression Omnibus: NCBI gene expression and hybridization array data repository. Nucleic Acids Res. 2002;30:207–10. doi: 10.1093/nar/30.1.207. [DOI] [PMC free article] [PubMed] [Google Scholar]
- Ekblad A, Wallander H, Godbold DL, et al. The production and turnover of extramatrical mycelium of ectomycorrhizal fungi in forest soils: role in carbon cycling. Plant Soil. 2013;366:1–27. [Google Scholar]
- Ericsson T. Growth and shoot: root ratio of seedlings in relation to nutrient availability. Plant Soil. 1995;168–9:205–14. [Google Scholar]
- Feng Y, He D, Yao Z, et al. The machinery of macroautophagy. Cell Res. 2014;24:24–41. doi: 10.1038/cr.2013.168. [DOI] [PMC free article] [PubMed] [Google Scholar]
- Finn RD, Bateman A, Clements J, et al. Pfam: the protein families database. Nucleic Acids Res. 2014;42:D222–30. doi: 10.1093/nar/gkt1223. [DOI] [PMC free article] [PubMed] [Google Scholar]
- Guaragnella N, Butow RA. ATO3 encoding a putative outward ammonium transporter is an RTG-independent retrograde responsive gene regulated by GCN4 and the Ssy1-Ptr3-Ssy5 amino acid sensor system. J Biol Chem. 2003;278:45882–7. doi: 10.1074/jbc.M309301200. [DOI] [PubMed] [Google Scholar]
- Högberg MN, Briones MJI, Keel SG, et al. Quantification of effects of season and nitrogen supply on tree below-ground carbon transfer to ectomycorrhizal fungi and other soil organisms in a boreal pine forest. New Phytol. 2010;187:485–93. doi: 10.1111/j.1469-8137.2010.03274.x. [DOI] [PubMed] [Google Scholar]
- Högberg MN, Högberg P. Extramatrical ectomycorrhizal mycelium contributes one-third of microbial biomass and produces, together with associated roots, half the dissolved organic carbon in a forest soil. New Phytol. 2002;154:791–5. doi: 10.1046/j.1469-8137.2002.00417.x. [DOI] [PubMed] [Google Scholar]
- Irizarry RA, Bolstad BM, Collin F, et al. Summaries of affymetrix GeneChip probe level data. Nucleic Acids Res. 2003;31:e15. doi: 10.1093/nar/gng015. [DOI] [PMC free article] [PubMed] [Google Scholar]
- Kohler A, Kuo A, Nagy LG, et al. Convergent losses of decay mechanisms and rapid turnover of symbiosis genes in mycorrhizal mutualists. Nat Genet. 2015 doi: 10.1038/ng.3223. DOI: 10.1038/ng.3223. [DOI] [PubMed] [Google Scholar]
- Kjøller R, Nilsson LO, Hansen K, et al. Dramatic changes in ectomycorrhizal community composition, root tip abundance and mycelial production along a stand-scale nitrogen deposition gradient. New Phytol. 2012;194:278–86. doi: 10.1111/j.1469-8137.2011.04041.x. [DOI] [PubMed] [Google Scholar]
- Leake JR, Donnelly DP, Saunders EM, et al. Rates and quantities of carbon flux to ectomycorrhizal mycelium following C-14 pulse labeling of Pinus sylvestris seedlings: effects of litter patches and interaction with a wood-decomposer fungus. Tree Physiol. 2001;21:71–82. doi: 10.1093/treephys/21.2-3.71. [DOI] [PubMed] [Google Scholar]
- Levasseur A, Drula E, Lombard V, et al. Expansion of the enzymatic repertoire of the CAZy database to integrate auxiliary redox enzymes. Biotechnol Biofuels. 2013;6:1–14. doi: 10.1186/1754-6834-6-41. [DOI] [PMC free article] [PubMed] [Google Scholar]
- Lindahl BD, Tunlid A. Ectomycorrhizal fungi—potential organic matter decomposers, yet not saprophytes. New Phytol. 2015;205:1443–7. doi: 10.1111/nph.13201. [DOI] [PubMed] [Google Scholar]
- Lucic E, Fourrey C, Kohler A, et al. A gene repertoire for nitrogen transporters in Laccaria bicolor. New Phytol. 2008;180:343–64. doi: 10.1111/j.1469-8137.2008.02580.x. [DOI] [PubMed] [Google Scholar]
- Nehls U, Kleber R, Wiese J, et al. Isolation and characterization of a general amino acid permease from the ectomycorrhizal fungus Amanita muscaria. New Phytol. 1999;144:343–9. [Google Scholar]
- Nitsche B, Jørgensen T, Akeroyd M, et al. The carbon starvation response of Aspergillus niger during submerged cultivation: Insights from the transcriptome and secretome. BMC Genomics. 2012;13:380. doi: 10.1186/1471-2164-13-380. [DOI] [PMC free article] [PubMed] [Google Scholar]
- Nitsche BM, Burggraaf-van Welzen A-M, Lamers G, et al. Autophagy promotes survival in aging submerged cultures of the filamentous fungus Aspergillus niger. Appl Microbiol Biot. 2013;97:8205–18. doi: 10.1007/s00253-013-4971-1. [DOI] [PubMed] [Google Scholar]
- Petersen TN, Brunak S, von Heijne G, et al. SignalP 4.0: discriminating signal peptides from transmembrane regions. Nat Methods. 2011;8:785–6. doi: 10.1038/nmeth.1701. [DOI] [PubMed] [Google Scholar]
- Plassard CS, Mousain DG, Salsac LE. Estimation of mycelial growth of basidiomycetes by means of chitin determination. Phytochemistry. 1982;21:345–8. [Google Scholar]
- Pocsi I, Pusztahelyi T, Sami L, et al. Autolysis of Penicillium chrysogenum: A holistic approach. Indian J Biotechnol. 2003;2:293–301. [Google Scholar]
- Pollack JK, Harris SD, Marten MR. Autophagy in filamentous fungi. Fungal Genet Biol. 2009;46:1–8. doi: 10.1016/j.fgb.2008.10.010. [DOI] [PubMed] [Google Scholar]
- Rawlings ND, Barrett AJ, Bateman A. MEROPS: the database of proteolytic enzymes, their substrates and inhibitors. Nucleic Acids Res. 2012;40:D343–50. doi: 10.1093/nar/gkr987. [DOI] [PMC free article] [PubMed] [Google Scholar]
- Rineau F, Roth D, Shah F, et al. The ectomycorrhizal fungus Paxillus involutus converts organic matter in plant litter using a trimmed brown-rot mechanism involving Fenton chemistry. Environ Microbiol. 2012;14:1477–87. doi: 10.1111/j.1462-2920.2012.02736.x. [DOI] [PMC free article] [PubMed] [Google Scholar]
- Rineau F, Shah F, Smits MM, et al. Carbon availability triggers the decomposition of plant litter and assimilation of nitrogen by an ectomycorrhizal fungus. ISME J. 2013;7:2010–22. doi: 10.1038/ismej.2013.91. [DOI] [PMC free article] [PubMed] [Google Scholar]
- Saier MH. A functional-phylogenetic classification system for transmembrane solute transporters. Microbiol Mol Biol R. 2000;64:354–411. doi: 10.1128/mmbr.64.2.354-411.2000. [DOI] [PMC free article] [PubMed] [Google Scholar]
- Sami L, Karaffa L, Emri T, et al. Autolysis and ageing of Penicillium chrysogenum under carbon starvation: Respiration and glucose oxidase production. Acta Microbiol Imm H. 2003;50:67–76. doi: 10.1556/AMicr.50.2003.1.7. [DOI] [PubMed] [Google Scholar]
- Schrickx JM, Krave AS, Verdoes JC, et al. Growth and product formation in chemostat and recycling cultures by Aspergillus niger N402 and a glucoamylase overproducing transformant, provided with multiple copies of the glaA gene. J Gen Microbiol. 1993;139:2801–10. doi: 10.1099/00221287-139-11-2801. [DOI] [PubMed] [Google Scholar]
- Shah F, Rineau F, Canbäck B, et al. The molecular components of the extracellular protein-degradation pathways of the ectomycorrhizal fungus Paxillus involutus. New Phytol. 2013;200:875–87. doi: 10.1111/nph.12425. [DOI] [PMC free article] [PubMed] [Google Scholar]
- Sharon A, Finkelstein A, Shlezinger N, et al. Fungal apoptosis: function, genes and gene function. FEMS Microbiol Rev. 2009;33:833–54. doi: 10.1111/j.1574-6976.2009.00180.x. [DOI] [PubMed] [Google Scholar]
- Shin K-S, Kwon N-J, Kim YH, et al. Differential roles of the ChiB chitinase in autolysis and cell death of Aspergillus nidulans. Eukaryot Cell. 2009;8:738–46. doi: 10.1128/EC.00368-08. [DOI] [PMC free article] [PubMed] [Google Scholar]
- Smith SE, Read DJ. Mycorrhizal Symbiosis. London: Academic Press; 2008. [Google Scholar]
- Szilagyi M, Miskei M, Karanyi Z, et al. Transcriptome changes initiated by carbon starvation in Aspergillus nidulans. Microbiology. 2013;159:176–90. doi: 10.1099/mic.0.062935-0. [DOI] [PubMed] [Google Scholar]
- Trinci APJ, Righelato RC. Changes in constituents and ultrastructure of hyphal compartments during autolysis of glucose starved Penicillium chrysogenum. J Gen Microbiol. 1970;60:239–49. doi: 10.1099/00221287-60-2-239. [DOI] [PubMed] [Google Scholar]
- Tsuji A, Kinoshita T, Hoshino M. Analytical chemical studies on amino sugars. II. Deterimation of hexosamines using 3-Methyl-2-benzothiazolone Hydrazone Hydrochloride. Chem Pharm Bull. 1969;17:1505–10. doi: 10.1248/cpb.17.1505. [DOI] [PubMed] [Google Scholar]
- Twining SS. Fluorescein isothiocyanate-labeled casein assay for proteolytic-enzymes. Anal Biochem. 1984;143:30–4. doi: 10.1016/0003-2697(84)90553-0. [DOI] [PubMed] [Google Scholar]
- Wallander H, Nylund JE. Effects of excess nitrogen and phosphorus starvation on the extramatrical mycelium of ectomycorrhizas of Pinus sylvestris L. New Phytol. 1992;120:495–503. [Google Scholar]
- Wallander H, Söderström B. Paxillus. In: Cairney JWG, Chambers SM, editors. Ectomycorrhizal Fungi: Key Genera in Profile. Berlin, UK: Springer; 1999. pp. 231–52. [Google Scholar]
- White S, McIntyre M, Berry DR, et al. The autolysis of industrial filamentous fungi. Crit Rev Biotechnol. 2002;22:1–14. doi: 10.1080/07388550290789432. [DOI] [PubMed] [Google Scholar]
- Voigt O, Poeggeler S. Self-eating to grow and kill: autophagy in filamentous ascomycetes. Appl Microbiol Biot. 2013;97:9277–90. doi: 10.1007/s00253-013-5221-2. [DOI] [PubMed] [Google Scholar]
- Yamashita Y, Tanoue E. Chemical characterization of protein-like fluorophores in DOM in relation to aromatic amino acids. Mar Chem. 2003;82:255–71. [Google Scholar]
Associated Data
This section collects any data citations, data availability statements, or supplementary materials included in this article.


