

ABSTRACT
Impaired biogenesis of microRNAs disrupts spermatogenesis and leads to infertility in male mice. Spermatogonial differentiation is a key step in spermatogenesis, yet the mechanisms that control this event remain poorly defined. In this study, we discovered microRNA 146 (Mir146) to be highly regulated during spermatogonial differentiation, a process dependent on retinoic acid (RA) signaling. Mir146 transcript levels were diminished nearly 180-fold in differentiating spermatogonia when compared with undifferentiated spermatogonia. Luciferase assays revealed the direct binding of Mir146 to the 3′ untranslated region of the mediator complex subunit 1 (Med1), a coregulator of retinoid receptors (RARs and RXRs). Overexpression of Mir146 in cultured undifferentiated spermatogonia reduced Med1 transcript levels, as well as those of differentiation marker kit oncogene (Kit). MED1 protein was also diminished. Conversely, inhibition of Mir146 increased the levels of Kit. When undifferentiated spermatogonia were exposed to RA, Mir146 was downregulated along with a marker for undifferentiated germ cells, zinc finger and BTB domain containing 16 (Zbtb16; Plzf); Kit was upregulated. Overexpression of Mir146 in RA-treated spermatogonia inhibited the upregulation of Kit, stimulated by retinoic acid gene 8 (Stra8), and spermatogenesis- and oogenesis-specific basic helix-loop-helix 2 (Sohlh2). Inhibition of Mir146 in RA-treated spermatogonia greatly enhanced the upregulation of these genes. We conclude that Mir146 modulates the effects of RA on spermatogonial differentiation.
Keywords: Med1, microRNA, Mir146, retinoic acid, spermatogonial differentiation
INTRODUCTION
The process of spermatogenesis depends upon the establishment and maintenance of undifferentiated spermatogonia, consisting of the cell types A single (As), A paired (Apr), and A aligned (Aal) in mice [1, 2]. A subset of these undifferentiated spermatogonia exhibit stem cell activity, with the ability to repopulate seminiferous tubules depleted of germ cells [3]. To initiate spermatogenesis, undifferentiated spermatogonia transition into type A1 cells, a process known as spermatogonial differentiation [1]. This transition is accompanied by a functional loss of stem cell activity [4]. The differentiating A1 cells then proceed through additional rounds of mitosis to generate successive cell types: A2, A3, A4, intermediate, and B spermatogonia [1]. The differentiation of As, Apr, and Aal cells into A1–A4 cells is tightly controlled, but the regulatory mechanisms underlying this event are poorly characterized.
MicroRNAs are short, noncoding RNAs that regulate a wide variety of cellular processes. A number of recent studies have highlighted the importance of microRNAs in regulating spermatogenesis [5–7]. Germ cell-specific deletion of dicer 1, ribonuclease type III (Dicer1), encoding an enzyme required for microRNA biogenesis, results in significant germ cell loss, abnormal morphology and motility of sperm, and reduced fertility [5, 6]. When Dicer1 is conditionally deleted from perinatal gonocytes and undifferentiated spermatogonia, an increase in pachytene spermatocyte defects and a decrease in round spermatid formation occurs [8, 9]. Collectively, these reports suggest that microRNAs are required for normal spermatogenesis. Additional studies have shown that microRNAs, in general, are highly expressed in the testis, while some microRNAs exhibit exclusive testicular expression [10–12]. The microRNA transcriptome exhibits dynamic expression during prepubescent mouse testis development [13]. When undifferentiated spermatogonia are compared to somatic testicular cells, several microRNAs exhibit significant enrichment in the spermatogonia [14]. However, to date, few specific microRNAs have been shown to directly influence spermatogonial differentiation [14, 15].
Retinoic acid (RA) signaling is important for both the initiation of differentiation and the entry into meiosis in male germ cells, with testes deficient in RA exhibiting a block in the Aal to A1 spermatogonial transition [16–19]. Exposure of spermatogonia to RA upregulates the Mirlet7 family of microRNAs and downregulates members of the Mir-17-92 (Mirc1) and Mir-106b-25 (Mirc3) clusters [15, 20]. In the current study, we searched for additional microRNAs that have distinct expression patterns between undifferentiated and differentiating spermatogonia, and identified Mir146 as a candidate that inhibits prodifferentiation transcripts.
MATERIALS AND METHODS
Mice and Spermatogonial Cell Enrichment
All procedures and care of animals were carried out in accordance with the Children's Hospital of Chicago Research Center Animal Care and Use Committee. Wild-type mice used in these studies were of the strains C57BL/6J, 129S1/SvImJ, and hybrid B6129SF2 (The Jackson Laboratory). Tg(Pou5f1-EGFP)2Mnn mice were maintained on the C57BL/6J background. Preparation of single-cell suspensions from testes and subsequent enrichment of both undifferentiated and differentiating spermatogonia were performed as previously described [21–23]. Briefly, testes from wild-type mice were decapsulated and minced in 1:1 Dulbecco modified Eagle medium-Ham F-12 Medium. An initial enzymatic digestion using collagenase I (1 mg/ml) and DNase I (2 mg/ml) at 37°C for 30 min was carried out to remove interstitial Leydig cells and peritubular myoid cells from the seminiferous tubules. A second enzymatic digestion using collagenases I and IV (1 mg/ml), DNase I (2 mg/ml), hyaluronidase (1.5 mg/ml), and trypsin (1 mg/ml) at 37°C for 30 min was undertaken to isolate germ cells and Sertoli cells from the remaining tissue. Final suspensions of single cells were prepared in ice-cold PBS containing 0.5% BSA and 2 mM EDTA for subsequent germ cell enrichment by magnetic-activated cell sorting (MACS). PBS containing 0.5% BSA and 2mM EDTA is referred to as MACS buffer.
Single-cell suspensions containing germ cells in 80 μl MACS buffer were first incubated with 20 μl rabbit anti-glial cell line-derived neurotrophic factor family receptor alpha 1 (GFRA1) antibodies (Santa Cruz Biotechnology) at 4°C for 20 min with rotation. After washes, a second incubation of cells in 80 μl MACS buffer with 10 μl goat anti-rabbit antibody-conjugated MicroBeads (Miltenyi Biotech, Auburn, CA) and 10 μl anti-thymus cell antigen 1, theta (THY1) antibody-conjugated MicroBeads was administered at 4°C for 20 min with rotation. The labeled cells were filtered through 30-μm pore size mesh to remove cell aggregates, and then sorted through a separation LS column attached to a MidiMACS separator (Miltenyi Biotec). THY1+ and GFRA1+ cells were retained inside the column within the magnetic field, while unlabeled cells passed through the column and were collected as the column-depleted THY1−/GFRA1− cell fraction (CD fraction). After washes with MACS buffer, the LS column was removed from the magnetic field and the THY1+ and GFRA1+ cells representing the undifferentiated spermatogonial fraction were flushed out. For the enrichment of differentiating spermatogonia, CD fraction cells were subsequently reconstituted in 90 μl MACS buffer and incubated with 10 μl anti-CD117 (KIT) antibody-conjugated MicroBeads at 4°C for 20 min with rotation. These samples were then sorted through a MidiMACS LS column to collect the KIT+ cells.
Cell Culture
The P19 mouse cell line was maintained in Alpha Minimum Essential Medium supplemented with 10% FBS according to standard protocols. Primary THY1+ spermatogonia were enriched by MACS and seeded onto dishes containing irradiated mouse embryonic fibroblast (MEF) feeder cells. These THY1+ undifferentiated spermatogonia were maintained in optimized culture medium (StemPro-34 [Life Technologies, Grand Island, NY] supplemented with 1% FBS, 10 μg/ml glial cellline-derived neurotrophic factor [GDNF; R&D Systems Inc., Minneapolis, MN], 1 ng/ml recombinant human basic fibroblast growth factor [bFGF; BD Biosciences, San Jose, CA], 20 ng/ml epidermal growth factor [EGF; BD Biosciences], and 1000 units/ml leukemia inhibitory factor [LIF/ESGRO; Millipore, Billerica, MA]). Cells were propagated for >6 mo, and passaged approximately every 7 days.
For transfections, cultured undifferentiated spermatogonia were passaged onto new MEFs 24 h prior to the experiment. Pre-microRNA (miR) Mir146 and nontargeting control (NTC) mimics were purchased from Ambion (Life Technologies). The miRIDIAN Mir146 and NTC inhibitors were purchased from ThermoScientific (Wilmington, DE). Transfections were performed using Lipofectamine 2000 (Invitrogen/Life Technologies) and approximately 100 pmol Pre-miR mimic or miRIDIAN inhibitor per treatment. For treatments longer than 24 h, media were changed at 24 h. P19 cells were transfected with Lipofectamine 2000 using 500 ng pMiR-MED1 or empty pMiR-RE-PORT, 500 ng pMiR-RE-PORT β-galactosidase control plasmid, and 20 pmol Pre-miR mimic. For RA exposure, cells were treated with media containing either 1 μM all trans-RA (Sigma Aldrich, St. Louis, MO) or 0.1% ethanol. At the end of the indicated treatment time, cells were harvested and total RNA was isolated. MEF-only controls were used for all treatments.
Luciferase Assays
A 1.5-kb region of the Med1 3′ untranslated region (UTR) was amplified from mouse genomic DNA and cloned into the pMiR-RE-PORT vector (Ambion/Life Technologies). At 24 h after transfection, cells were harvested. Luciferase and β-galactosidase activities were measured using the appropriate enzyme assays, following the manufacturer's instructions (Promega, Madison, WI). Luciferase activity was normalized to β-galactosidase activity. Caspase activity was measured using the Caspase-Glo 3/7 assay, following the manufacturer's instructions (Promega).
Quantitative RT-PCR
Total RNA was isolated from samples using the RNeasy Kit (Qiagen, Valencia, CA). The yield and quality of RNA samples were determined using the NanoDrop 2000 Spectrophotometer (ThermoScientific). For microRNA analysis, total RNA was reverse transcribed into cDNA using random hexamer primers and M-MLV reverse transcriptase (New England Biolabs, Ipswich, MA). For quantitative RT (qRT)-PCR of coding transcripts, cDNA was mixed with Power SYBR Green PCR Master Mix (Applied Biosystems, Foster City, CA) and analyzed on an Applied Biosystems 7500 Fast Real-Time PCR system. Primers used in this study are listed in Supplemental Table S1 (all Supplemental Data are available online at www.biolreprod.org). For microRNA analysis, total RNA was reverse transcribed into cDNA using TaqMan MicroRNA Reverse Transcription Kit, according to the manufacturer's instructions (Life Technologies). For qRT-PCR of noncoding transcripts, microRNA-specific cDNA was mixed with TaqMan Universal Master Mix (Life Technologies) and analyzed on an Applied Biosystems 7500 Fast Real-Time PCR system. Quantification of the fold change in gene expression was determined by the ΔΔCt method.
Western Blot Analysis
Cultured THY1+ spermatogonia were harvested and resuspended in lysis buffer containing protease/phosphatase inhibitors. Total protein was quantified using the Bradford assay. Total protein (20 μg) was separated by SDS-PAGE and transferred to polyvinylidene fluoride membranes. Blots were blocked with 5% milk and incubated overnight at 4°C with rabbit polyclonal anti-MED1 antibodies (Bethyl Laboratories, Montgomery, TX) or mouse monoclonal anti-α-tubulin antibodies (B-7; sc-5286; Santa Cruz Biotechnology). After washing, blots were incubated with horseradish peroxidase-conjugated secondary antibodies for 1 h at room temperature. They were then incubated with a chemiluminescent substrate, exposed to X-ray film, and developed. Densitometry analysis was performed using the GE Typhoon FLA 7000 system.
Immunohistochemistry
Prepubertal (1-wk-old) testes were fixed in Bouin solution at 4°C for 2 h. Testes were rinsed in PBS and dehydrated for paraffin embedding. Sections (5 μm) were cut, deparaffinized, and rehydrated for staining. Sections were subjected to antigen retrieval by boiling in 0.01 M sodium citrate (pH 6.0) for 10 min. Sections were blocked with 3% normal goat serum in PBS for 1 h at room temperature. Primary antibodies were diluted in 3% goat serum in PBS and incubated overnight at 4°C. Control reactions were performed by omitting primary antibodies from the incubations. After washing, samples were incubated in the dark with fluorescence-conjugated secondary antibodies. Vectashield anti-fade mounting medium (Vector Laboratories, Burlingame, CA) containing 4′,6-diamidino-2-phenylindole (DAPI) was applied to the samples, and sections were viewed using a Leica DMR-HC epifluorescence microscope. Images were captured by a QImaging Retiga 4000R camera. Antibodies used were rat monoclonal anti-GCNA1 (gift of Dr. George Enders, University of Kansas Medical Center, Kansas City, KS) at 1:100, and rabbit polyclonal anti-MED1 (M-255; sc-8998; Santa Cruz Biotechnology) at 1:100.
Flow Cytometry
Cultured OCT4+ spermatogonia established from Pou5f1 (Oct4)-green fluorescent protein (GFP) mice were treated with trypsin-EDTA. Cells were resuspended in PBS containing 2% BSA and filtered through 30-μm pore size mesh to remove cell aggregates. Cells were then incubated with mouse monoclonal anti-KIT antibodies conjugated to allophycocyanin (2B8; eBioscience, San Diego, CA) in the dark for 30 min. After washes, cells were exposed to DAPI for dead cell exclusion immediately before analysis. Cells were analyzed on a BD LSR Fortessa flow cytometer (BD Biosciences, San Jose, CA).
Statistical Analyses
All experiments were performed at least three times. Data are presented as the mean (±SEM). Statistical analyses were carried out using Prism 5 (GraphPad Software, La Jolla, CA). For experiments with single comparisons, significance between the means was determined using Student t-test. For experiments with multiple comparisons, significance was determined by one-way analysis of variance followed by the Tukey multiple comparison test.
RESULTS
Mir146 Is Significantly Enriched in Undifferentiated Spermatogonia Relative to Differentiating Spermatogonia
To generate distinct subpopulations of spermatogonia, thereby separating undifferentiated from differentiating fractions and enabling the direct comparison of microRNA levels, we used MACS. The use of MACS allowed us to enrich for germ cells containing surface markers THY1 and GFRA1, which represent undifferentiated spermatogonia, and to enrich for germ cells containing surface marker kit oncogene (KIT), which represent differentiating spermatogonia [4, 22, 23]. To verify that our MACS selection strategy successfully enriched distinct spermatogonial subpopulations, we performed gene expression analysis on the recovered cells using qRT-PCR. As expected, relative to KIT+ cells, THY1+/GFRA1+ cells exhibited an upregulation of Gfra1 (8.68-fold), as well as two additional transcripts associated with undifferentiated spermatogonia: zinc finger and BTB domain containing 16 (Zbtb16; referred to here as Plzf; 7.16-fold), and POU domain, class 5, transcription factor 1 (Pou5f1; referred to here as Oct4; 6.19-fold; Fig. 1A). Conversely, THY1+/GFRA1+ cells exhibited a downregulation of Kit (20-fold), as well as spermatogenesis- and oogenesis-specific basic helix-loop-helix 2 (Sohlh2; 2.63-fold) when compared with KIT+ cells (Fig. 1A). SOHLH2, along with closely related family member SOHLH1, localizes to spermatogonia within the testis and upregulates Kit; genetic ablation of either family member results in a loss of KIT+ spermatogonia [24–26]. We also assessed levels of enhancer of zeste homolog 2 (Ezh2), a gene highly enriched in primitive hematopoietic stem cells (HSCs), rapidly downregulated upon HSC differentiation, and targeted by multiple microRNAs [27, 28]. Relative to KIT+ cells, THY1+/GFRA1+ cells exhibited a 3.43-fold upregulation of Ezh2 (Fig. 1A). These results validate the use of MACS to enable identification of microRNAs differentially regulated between self-renewing and differentiating spermatogonia. We chose to examine specific microRNAs based upon known targets and interactions occurring in other cell types. In differentiating and maturing megakaryocytes, Mir146 is directly repressed by PLZF, enabling the translation of chemokine (C-X-C motif) receptor 4 (CXCR4) that ensures cell survival [29]. CXCR4 is essential for primordial germ cell migration, and is expressed in postnatal male germ cells [30, 31], while PLZF is required for spermatogonial stem cell self-renewal [32, 33]. Meanwhile, in various differentiated or transformed cells, Mir26a-1/2, Mir101a-c, and Mir214 are upregulated and target Ezh2 [34–36]. Here, THY1+/GFRA1+ cells exhibited no change in the levels of these latter three microRNAs relative to KIT+ cells but, unexpectedly, showed a nearly 180-fold enrichment of Mir146 (Fig. 1B). These findings suggest a potential role for Mir146 in the commitment of spermatogonia to differentiate.
FIG. 1.

Med1 is a target of Mir146. A) Quantitative RT-PCR validation of MACS enrichment of primary spermatogonia subpopulations. THY1+/GFRA1+ cells represent undifferentiated spermatogonia, while KIT+ cells represent differentiating spermatogonia. FT (flow through) represents the final, column-depleted fraction of cells. Genes expressed primarily in undifferentiated spermatogonia (Gfra1, Plzf, Oct4, Lin28a) and in differentiating spermatogonia (Kit, Sohlh2), as well as Ezh2, were examined. All transcripts were normalized to actin, beta (Actb), denoted by a dashed line of value “1.” B) Quantitative RT-PCR of selected microRNA transcripts in THY1+/GFRA1+ cells relative to KIT+ cells. Transcripts were normalized to U6 RNA. C) Quantitative RT-PCR of both putative and previously validated target genes of Mir146, examined in THY1+/GFRA1+ cells relative to FT cells, and in THY1+/GFRA1+ cells relative to KIT+ cells. All transcripts were normalized to Actb, denoted by a dashed line of value “1.” D) The mouse Med1 3′UTR has three putative Mir146 binding sites, represented as diamonds. The sites at 928 bp and 1320 bp are highly conserved, while the site at 1614 bp is poorly conserved. E) Fold change measurements, defined as normalized luciferase activity following Mir146 mimic transfection relative to normalized luciferase activity following NTC mimic transfection in P19 cells. A plasmid vector containing the Med1 3′UTR downstream of the luciferase gene coding region (pMir-Med1 Reporter) was cotransfected with either a Mir146 mimic or an NTC mimic into P19 cells. As a control, the Med1 3′UTR was substituted with an empty vector (pMir reporter). Data are presented as means (±SEM). *P < 0.05; **P < 0.01; ***P < 0.001.
Med1 Is a Direct Target of Mir146
We next examined putative target genes of Mir146, and assessed their relative expression levels in undifferentiated and differentiating spermatogonia. A list of potential targets was compiled using binding site prediction algorithms TargetScan, miRanda, and PicTar (Supplemental Table S2). Four in silico predicted targets, signal transducer and activator of transcription 1 (Stat1), interleukin 1 receptor-associated kinase 1 (Irak1), tumor necrosis factor receptor-associated factor 6 (Traf6), and Notch1, had previously been validated biologically as targets of Mir146, but not in spermatogonial cells [37–39]. Three additional in silico predicted targets, extended synaptotagmin-like protein 2 (Esyt2), adaptor protein, phosphotyrosine interaction, PH domain and leucine zipper containing 1 (Appl1), and mediator complex subunit 1 (Med1), had not yet been validated in vitro. We chose to examine the expression of these top in silico predicted candidates in MACS-separated spermatogonia. Of the seven putative target genes, all but Stat1 and Notch1 were found to be significantly downregulated in THY1+/GFRA1+ cells relative to KIT+ cells (Fig. 1C). In particular, the downregulation of Med1 intrigued us. MED1 specifically modulates nuclear hormone receptor-dependent transcription and interacts with multiple nuclear hormone receptors, including those for RA [40]. This finding suggested to us that Mir146 might play a role in inhibiting spermatogonial differentiation by downregulating cellular responses to external differentiation signals. The 3′ UTR of mouse Med1 contains three putative Mir146 binding sites (Fig. 1D). To determine whether Med1 was a direct target of Mir146, we cloned a 1.5-kb region of the Med1 3′UTR containing all three predicted binding sites into a luciferase reporter vector. This vector was then cotransfected into mouse P19 cells with a Mir146 mimic or a non-targeting control (NTC) mimic. P19 cells had been determined by us to express low endogenous levels of Mir146 (data not shown). Cells transfected with the Mir146 mimic exhibited a significant decrease in luciferase activity relative to those transfected with the NTC mimic (2.38-fold) (Fig. 1E). This effect was specific to the Med1 3′UTR, as cells transfected with the empty vector showed no significant change in luciferase activity. These results demonstrate that Med1 is a direct target of Mir146. As MED1 had not previously been described in male germ cells, we examined its distribution during the initial wave of spermatogonial differentiation using immunohistochemistry. In 1-wk-old testes, MED1 is present in some, but not all, spermatogonia, as well as in peritubular myoid cells and Leydig cells (Fig. 2). Roughly one-quarter (26.3% ± 4.65%; n = 3 animals) of premeiotic germ cells exhibited MED1 distribution, as measured by coimmunostaining of MED1 and the germ cell nuclear antigen 1 (GCNA1), a specific marker of germ cells through the diplotene/dictyate stage of the first meiotic division [41]. This finding suggests that MED1 may localize to a subpopulation of spermatogonia within the prepubescent testis.
FIG. 2.
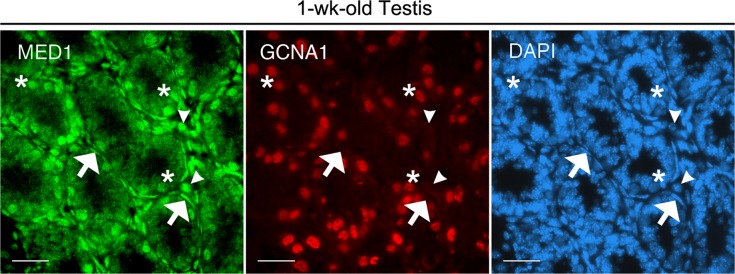
In prepubescent mouse testes, MED1 is expressed in spermatogonia, Leydig cells, and peritubular myoid cells. Seminiferous tubule cross-sections of 1-wk-old testes were immunostained for MED1, germ cell-specific GCNA1, and DAPI. Some, but not all, GCNA1+ cells contain MED1. Asterisks denote spermatogonia double-positive for GCNA1 and MED1; arrows identify MED1+ peritubular myoid cells; arrowheads indicate MED1+ Leydig cells in the interstitium (n = 3 animals). Bars = 40 μM.
Modulation of Mir146 Expression Alters Spermatogonia Marker Transcript Levels
We next investigated the effects of overexpressing and inhibiting Mir146 in cultured undifferentiated spermatogonia. To increase Mir146 expression, spermatogonia were transiently exposed to a Mir146 mimic or an NTC mimic. After 72 h, cells were harvested and gene expression was examined. Cultures treated with the Mir146 mimic showed a significant increase in Mir146 expression over NTC-treated (203-fold; Fig. 3A). To confirm that the Mir146 mimic was acting independently from endogenous Mir146, we examined the transcript levels of the primary (pri)-Mir146 precursor in cells transfected with the Mir146 mimic. As expected, the fold change of pri-Mir146 under this condition did not differ when compared to cells transfected with NTC mimic (Supplemental Fig. S1A). A panel of gene transcripts specific to undifferentiated or differentiating spermatogonia was also examined: Plzf, Gfra1, inhibitor of DNA binding 4 (Id4), Kit, and Sohlh2. There were significant decreases in Kit (4.76-fold) and Sohlh2 (3.13-fold), as well as Med1 (2.08-fold) (Fig. 3B). These data reveal that overexpressing Mir146 leads to a decrease in the expression of genes associated with differentiating spermatogonia.
FIG. 3.

Modulation of Mir146 alters the transcript levels of differentiation-associated genes. A) Quantitative RT-PCR of Mir146 in cultured undifferentiated spermatogonia transfected with a Mir146 mimic (72 h) relative to spermatogonia transfected with an NTC mimic (72 h). B) Quantitative RT-PCR of genes in undifferentiated spermatogonia transfected with a Mir146 mimic (72 h) relative to spermatogonia transfected with an NTC mimic (72 h). C) Quantitative RT-PCR of Mir146 in cells transfected with a Mir146 inhibitor or an NTC inhibitor. Cells were harvested at 24, 48, and 72 h. Levels were quantified relative to values in NTC inhibitor-transfected cells. D) Quantitative RT-PCR of genes in cells transfected with a Mir146 inhibitor (24 h) relative to cells transfected with an NTC inhibitor (24 h). E) Undifferentiated spermatogonia treated with mock transfection, NTC inhibitor, or Mir146 inhibitor were counted after 72 h. F) Cells treated with a Mir146 inhibitor or an NTC inhibitor for 72 h were incubated with luminescent caspase 3 and caspase 7 substrates for 1 h. G) Western blot depicting MED1 protein from cells treated with an Mir146 mimic or an NTC mimic. α-tubulin was used as a loading control. Transcripts in A and C were normalized to U6, while transcripts in B and D were normalized to Actb. Data are presented as mean values (±SEM). *P < 0.05; **P < 0.01; ***P < 0.001.
Cultured spermatogonial cells were then treated with either a Mir146 hairpin inhibitor or an NTC inhibitor. Expression of Mir146 was assessed after 24, 48, and 72 h. At 48 h, Mir146 levels were significantly diminished, a reduction that persisted at 72 h (7.69-fold and 12.5-fold, respectively; Fig. 3C). To confirm the function of the Mir146 inhibitor, we performed luciferase reporter assays by cotransfecting undifferentiated spermatogonia with the pMir reporter vectors and inhibitors. The presence of the Mir146 inhibitor significantly elevated luciferase expression from the vector containing the 3′UTR of Med1, suggesting that the inhibitor sufficiently blocked endogenous Mir146 to the extent that the expression of the luciferase reporter was no longer impeded (Supplemental Fig. S1B). Exhibiting the opposite of what had occurred in spermatogonia receiving the Mir146 mimic, cells receiving the Mir146 inhibitor showed a significant upregulation of Kit (195-fold) and Sohlh2 (6-fold) at 24 h (Fig. 3D). Similar trends were observed at 48 h (data not shown). Additionally, at 72 h there was a significant reduction in the number of cells recovered from Mir146 inhibitor-treated samples (7.45 × 10⁵ cells) compared with NTC-transfected (1.43 × 10⁶ cells) or mock-transfected (1.46 × 10⁶ cells) samples (Fig. 3E). To determine whether this reflected an increase in apoptosis, we measured caspase 3 and caspase 7 activities using a luminescent substrate containing a caspase cleavage site. There were significant increases in measured luminescence at 48 and 72 h in Mir146 inhibitor-treated cells, indicating an increase in caspase activity (Fig. 3F). Cells treated with a Mir146 mimic did not show any changes in recovered cell number or caspase activity (data not shown). We also investigated whether modulating Mir146 could alter MED1 protein levels. Undifferentiated spermatogonia treated for 72 h with a Mir146 mimic exhibited a modest (1.3-fold) decrease in MED1 protein levels relative to NTC-treated cells (Fig. 3G). Collectively, these results suggest that inhibiting Mir146 influences spermatogonia to upregulate genes associated with differentiation. As the culture system does not support differentiating germ cells, these spermatogonia would then likely undergo apoptosis.
Mir146 Modulates the Effects of RA on Spermatogonia
We next wanted to determine the effects of RA treatment and Mir146 modulation on cultured spermatogonia. In vitro exposure of male germ cells to RA induces characteristics of differentiating spermatogonia and subsequent meiotic spermatocytes, including the expression of Kit and stimulated by retinoic acid gene 8 (Stra8) and the localization of synaptonemal complex 3 (SYPC3), followed by cell death [18, 42]. Here, spermatogonia exposed to 1 μM RA for 24 h exhibited a significant decrease in Mir146 levels (3.33-fold; Fig. 4A). As expected, there was significant upregulation of Kit (4.32-fold) and Stra8 (10.3-fold), and downregulation of Plzf (2.5-fold) (Fig. 4B). We then examined whether overexpression of Mir146 was sufficient to alter the effects of RA on the germ cells. Spermatogonia were treated with either the Mir146 or the NTC mimic for 72 h. RA or vehicle was added to the cultures for the final 24 h of treatment. Changes in gene expression were determined by comparing Mir146 mimic-treated cells exposed to RA versus vehicle, and NTC mimic-treated cells exposed to RA versus vehicle. Relative to vehicle-exposed cells, there was no change in Mir146 levels in RA-exposed cells that received the Mir146 mimic, but a downregulation of Mir146 in RA-exposed cells that received the NTC mimic (Fig. 4C). Additionally, RA-exposed Mir146 mimic-treated cells showed no induction of Kit, Stra8, or Sohlh2, while the RA-exposed NTC mimic-treated cells exhibited an upregulation of these genes (Fig. 4D). These results suggest that overexpression of Mir146 alone is sufficient to block induction of RA-mediated transcription of differentiation genes. We then wondered whether treatment of undifferentiated spermatogonia with Mir146 inhibitor and RA together had a synergistic effect. Cells were treated with either the Mir146 inhibitor or the NTC inhibitor for 24 h. RA or vehicle was added to the cultures for the final 18 h of treatment. As expected, RA-exposed Mir146 inhibitor-treated cells exhibited a robust downregulation of Mir146 (Fig. 4E). RA-exposed Mir146 inhibitor-treated cells also significantly upregulated Kit, Stra8, and Sohlh2 (Fig. 4F). These data imply that specifically reducing Mir146 levels in spermatogonia promotes a cellular environment that is more responsive to RA-induced differentiation at the level of transcription.
FIG. 4.

Mir146 overexpression diminishes the effects of RA on undifferentiated spermatogonia, while Mir146 inhibition acts synergistically with RA. A and B) Cells were exposed to 1 μM RA or vehicle (0.1% EtOH) for 24 h. Mir146 expression (A) and spermatogonia-specific gene expression (B) was quantified by qRT-PCR. C and D) Cells were treated with the Mir146 mimic or the NTC mimic for 72 h. RA or vehicle was added for the last 24 h of treatment. Mir146 expression (C) and spermatogonia-specific gene expression (D) were quantified by qRT-PCR. E and F) Cells were treated with the Mir146 inhibitor or the NTC inhibitor for 24 h. RA or vehicle was added for the last 18 h of treatment. Mir146 expression (E) and spermatogonia-specific gene expression (F) were quantified by qRT-PCR. For C–F, gene expression was quantified by comparing RA-exposed cells to vehicle-exposed cells for each treatment. Transcripts in A, C, and E were normalized to U6, denoted in C by a dashed line of value “1.” Transcripts in B, D, and F were normalized to Actb, denoted in D and F by a dashed line of value “1.” Data are presented as mean values (±SEM). *P < 0.05; **P < 0.01; ***P < 0.001.
We next examined whether the consequences of modulating Mir146 in undifferentiated spermatogonia could be measured as a change in cell phenotype. We established spermatogonial cultures from transgenic mice in which GFP is driven by the Oct4 promoter [43]. These GFP+ spermatogonia were then treated with either the Mir146 inhibitor or the Mir146 mimic, along with their respective NTC controls. Spermatogonia were analyzed by flow cytometry for relative changes in the number of cells exhibiting GFP or KIT protein, representing undifferentiated and differentiating spermatogonia, respectively. Exposure of cells to the Mir146 inhibitor resulted in a significant increase in the percentage of KIT+ cells relative to spermatogonia exposed to the NTC inhibitor (8.5% vs. 3.13%; Fig. 5A), while no significant change was seen after Mir146 mimic treatment (2.75% vs. 2.96%; Fig. 5A). In both treatment conditions, no change was seen in the number of GFP+ cells (data not shown). We next exposed GFP+ cells to either RA or vehicle. As expected, RA exposure generated a significantly higher percentage of KIT+ cells (21.1% vs. 5.4%; Fig. 5B). Finally, we wanted to determine whether combining Mir146 treatment with RA exposure would alter the number of KIT+ cells. Spermatogonia treated with the Mir146 inhibitor and exposed to RA resulted in a significantly greater increase in KIT+ cells relative to cells treated with the NTC inhibitor and exposed to RA (1.86-fold vs. 1.18-fold; Fig. 5C). Conversely, spermatogonia treated with the Mir146 mimic and exposed to RA resulted in a significantly lower increase in KIT+ cells relative to cells treated with the NTC mimic and exposed to RA (1.04-fold vs. 1.66-fold; Fig. 5C). Again, no change was observed in the number of GFP+ cells (data not shown). Histograms of KIT+ cells for each condition are shown in Supplemental Fig. S2. These results indicate that, in addition to influencing the transcription of differentiation-associated genes, Mir146 inhibition increases the percentage of spermatogonia exhibiting cell surface markers (i.e., KIT) that reflect differentiation commitment. Overexpressing Mir146 is sufficient to block the induction of these markers following RA exposure, while inhibiting Mir146 causes an increase in the number of differentiating cells.
FIG. 5.
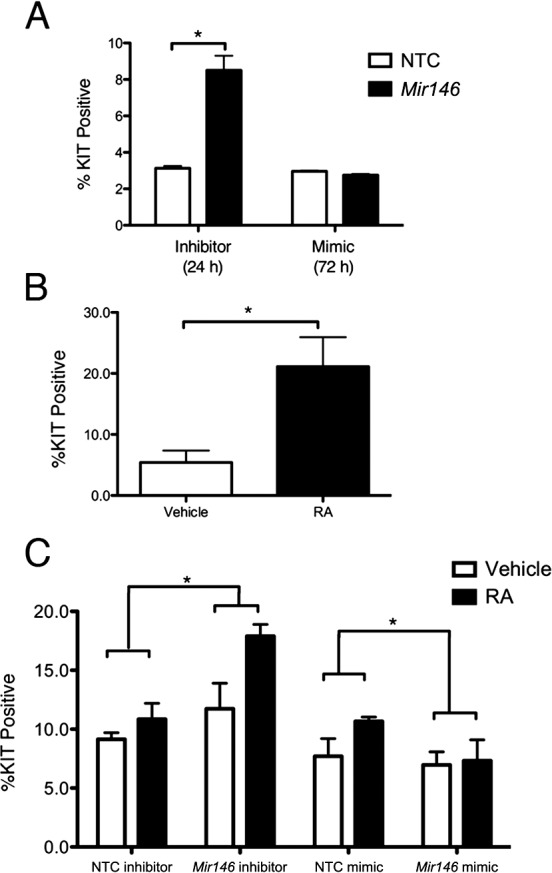
Modulation of Mir146 alters the abundance of KIT+ cells in cultured undifferentiated spermatogonia. A) Oct4-GFP spermatogonia were examined by flow cytometry for the presence of KIT following Mir146 overexpression or inhibition. The percentage of KIT+ cells for each treatment condition is shown. B) Cells exposed to RA or vehicle were analyzed for the presence of KIT. The percentage of KIT+ cells is shown. C) Cells were treated with Mir146 inhibitor, Mir146 mimic, or their respective NTC controls, and then exposed to RA. Statistical analyses were performed by comparing the percentages of KIT+ cells that arose from RA-exposed or vehicle-exposed cells treated with Mir146 inhibitor or Mir146 mimic to the percentages of KIT+ cells that arose from cells treated with their respective NTC controls. Data are presented as mean values (±SEM). *P < 0.05.
DISCUSSION
The testis has been reported to have a complex and dynamic microRNA signature, but only a handful of microRNAs have been investigated in spermatogonia [10, 13–15, 20, 44]. In this regard, the developing testis is much like the developing ovary with respect to the paucity of information concerning specific microRNAs and their proposed functions [45]. Here, we focused our studies on the role of Mir146 in spermatogonial differentiation in vitro. Our results suggest that Mir146 is an important factor in keeping spermatogonia in an undifferentiated state. Moreover, we have shown that Mir146 is able to influence the effects of RA exposure on spermatogonia. As our analysis was performed on primary cells in culture, these findings are correlative and warrant additional investigation in vivo.
We initially chose to investigate Mir146 based upon its role in regulating megakaryopoiesis [29]. Due to its negative regulation by PLZF in megakaryocyte progenitor cells, we hypothesized that Mir146 should be highly expressed in differentiating spermatogonia. Unexpectedly, we found that Mir146 was significantly upregulated in undifferentiated spermatogonia, indicating that it may play a role in maintaining germ cells in an undifferentiated state. Overexpression of Mir146 led to a decrease in the transcript levels of markers associated with differentiation. Inhibition of Mir146 caused an enrichment of these differentiation transcripts and an increase in cells containing surface protein KIT. Mir146 mimic-treated spermatogonia exhibited a significant downregulation of Sohlh2. Our finding that Sohlh2 levels diminished upon Mir146 overexpression supports the observed enrichment of Sohlh2 in KIT+ cells relative to THY1+/GFRA1+ cells. These results contrast with recent observations of SOHLH2 enrichment in undifferentiated spermatogonia [24]. This discrepancy could reflect differences between transcript and protein levels.
Several studies have previously reported the differential regulation of Mir146 during cell differentiation [29, 46, 47]. As previously mentioned, Mir146 was found to be downregulated during megakaryocyte differentiation. In those studies, Mir146 overexpression decreased megakaryocyte differentiation, while its inhibition increased the number of cells expressing megakaryocyte markers [29]. In multipotent hematopoietic progenitor cells (HPCs), Mir146 overexpression was detrimental to cell survival [47]. Additionally, bone marrow transplantation of these cells showed a transient increase in the myeloid compartment and a decrease in erythropoietic cells, indicating that Mir146 plays a role in specifying cell fate. In contrast, Mir146 was found to be upregulated during macrophage differentiation [46]. These findings suggest that the regulation of Mir146 is finely tuned during hematopoietic cell differentiation in a cell type-specific manner. Our results extend this hypothesis to nonhematopoietic cells.
Our data indicate that Mir146 directly affects the outcome of RA exposure on germ cells. Spermatogonia require RA for the initiation of differentiation, and this effect is, in part, cell autonomous [16, 18]. However, the mechanisms through which RA acts on germ cells are not well described. Our results show that Mir146 directly binds and represses Med1, a gene known to enhance transcription from nuclear hormone receptors. Overexpression and inhibition of Mir146 altered Med1 expression. We also show that Mir146 overexpression is sufficient to block the effect of RA on spermatogonia, while Mir146 inhibition leads to a synergistic effect. This suggests a connection between Mir146 and the RA-induced differentiation pathway in spermatogonia. MED1 has previously been shown to influence stem cell differentiation by regulating signals from nuclear hormone receptors [48–52]. MED1 has been shown to directly bind retinoid receptors [40], but reports describing its effect upon RA-induced transcription are limited. In a human promyelocytic leukemia cell line, Med1 knockdown caused cells to be nonresponsive to RA-induced differentiation, and to express low levels of direct RA target genes [49]. It is interesting to note that HPC-specific Med1 knockout mice have a very specific block in the development of the erythroid cell lineage [51]. As HPCs constitutively expressing Mir146 exhibit a decrease in erythropoiesis [47], these findings suggest that Mir146 could target Med1 in other cell types to influence cell fate decisions.
The mechanisms regulating Mir146 expression are currently unknown. While we found that RA exposure decreased Mir146 expression, we do not know whether this effect is due to a direct interaction with RA receptors or with other transcription factors. Upstream regulatory elements within Mir146 need to be investigated to better understand how this pathway influences spermatogonial differentiation. In differentiating hematopoietic cells, Mir146 is directly repressed by PLZF [29], while in differentiating male germ cells both Mir146 and Plzf are downregulated. As PLZF transcriptionally activates specific genes in undifferentiated spermatogonia [53], it is possible that PLZF could act as a transcriptional activator of Mir146 in these germ cells.
Interestingly, Mir146 appears to have only a minor impact on genes associated with the maintenance of undifferentiated spermatogonia. We did not observe significant effects of modulating Mir146 on Oct4 expression through our examination Oct4-GFP cells. Further studies will be necessary to allow conclusions on how Mir146 influences spermatogonial stem cell self-renewal in vivo, utilizing cell transplantation assays. We conclude that the primary role of Mir146 in spermatogonia is to downregulate the expression of genes required for differentiation. We examined a direct interaction between Mir146 and Med1, yet it is likely that Mir146 exerts its influence on spermatogonia through a number of target genes. These findings reveal a potential mechanism by which spermatogonial differentiation is regulated.
Supplementary Material
ACKNOWLEDGMENT
The authors would like to thank Kristin Kalita for her contributions to the initial experiments that led to these studies. George Enders kindly provided the anti-GCNA1 antibodies. We gratefully acknowledge the Children's Research Fund of Children's Hospital of Chicago Research Center for its generous support.
Footnotes
Supported by National Institute of Child Health and Human Development (National Institutes of Health) grant HD 055330 to C.J.P.
REFERENCES
- de Rooij DG. Proliferation and differentiation of spermatogonial stem cells. Reproduction. 2001;121:347–354. doi: 10.1530/rep.0.1210347. [DOI] [PubMed] [Google Scholar]
- Huckins C. The spermatogonial stem cell population in adult rats. I. Their morphology, proliferation and maturation. Anat Rec. 1971;169:533–557. doi: 10.1002/ar.1091690306. [DOI] [PubMed] [Google Scholar]
- Yoshida S. Spermatogenic stem cell system in the mouse testis. Cold Spring Harb Symp Quant Biol. 2008;73:25–32. doi: 10.1101/sqb.2008.73.046. [DOI] [PubMed] [Google Scholar]
- Shinohara T, Orwig KE, Avarbock MR, Brinster RL. Spermatogonial stem cell enrichment by multiparameter selection of mouse testis cells. Proc Natl Acad Sci U S A. 2000;97:8346–8351. doi: 10.1073/pnas.97.15.8346. [DOI] [PMC free article] [PubMed] [Google Scholar]
- Hayashi K. Chuva de Sousa Lopes SM, Kaneda M, Tang F, Hajkova P, Lao K, O'Carroll D, Das PP, Tarakhovsky A, Miska EA, Surani MA. MicroRNA biogenesis is required for mouse primordial germ cell development and spermatogenesis. PLoS One. 2008;3:e1738. doi: 10.1371/journal.pone.0001738. [DOI] [PMC free article] [PubMed] [Google Scholar]
- Maatouk DM, Loveland KL, McManus MT, Moore K, Harfe BD. Dicer1 is required for differentiation of the mouse male germline. Biol Reprod. 2008;79:696–703. doi: 10.1095/biolreprod.108.067827. [DOI] [PubMed] [Google Scholar]
- McIver SC, Roman SD, Nixon B. McLaughlin EA. miRNA and mammalian male germ cells. Hum Reprod Update. 2012;18:44–59. doi: 10.1093/humupd/dmr041. [DOI] [PubMed] [Google Scholar]
- Korhonen HM, Meikar O, Yadav RP, Papaioannou MD, Romero Y, Da Ros M, Herrera PL, Toppari J, Nef S, Kotaja N. Dicer is required for haploid male germ cell differentiation in mice. PLoS One. 2011;6:e24821. doi: 10.1371/journal.pone.0024821. [DOI] [PMC free article] [PubMed] [Google Scholar]
- Romero Y, Meikar O, Papaioannou MD, Conne B, Grey C, Weier M, Pralong F, De Massy B, Kaessmann H, Vassalli JD, Kotaja N, Nef S. Dicer1 depletion in male germ cells leads to infertility due to cumulative meiotic and spermiogenic defects. PLoS One. 2011;6:e25241. doi: 10.1371/journal.pone.0025241. [DOI] [PMC free article] [PubMed] [Google Scholar]
- Ro S, Park C, Sanders KM, McCarrey JR, Yan W. Cloning and expression profiling of testis-expressed microRNAs. Dev Biol. 2007;311:592–602. doi: 10.1016/j.ydbio.2007.09.009. [DOI] [PMC free article] [PubMed] [Google Scholar]
- Yu Z, Raabe T, Hecht NB. MicroRNA Mirn122a reduces expression of the posttranscriptionally regulated germ cell transition protein 2 (Tnp2) messenger RNA (mRNA) by mRNA cleavage. Biol Reprod. 2005;73:427–433. doi: 10.1095/biolreprod.105.040998. [DOI] [PubMed] [Google Scholar]
- Yan N, Lu Y, Sun H, Tao D, Zhang S, Liu W, Ma Y. A microarray for microRNA profiling in mouse testis tissues. Reproduction. 2007;134:73–79. doi: 10.1530/REP-07-0056. [DOI] [PubMed] [Google Scholar]
- Buchold GM, Coarfa C, Kim J, Milosavljevic A, Gunaratne PH, Matzuk MM. Analysis of microRNA expression in the prepubertal testis. PLoS One. 2010;5:e15317. doi: 10.1371/journal.pone.0015317. [DOI] [PMC free article] [PubMed] [Google Scholar]
- Niu Z, Goodyear SM, Rao S, Wu X, Tobias JW, Avarbock MR, Brinster RL. MicroRNA-21 regulates the self-renewal of mouse spermatogonial stem cells. Proc Natl Acad Sci U S A. 2011;108:12740–12745. doi: 10.1073/pnas.1109987108. [DOI] [PMC free article] [PubMed] [Google Scholar]
- Tong MH, Mitchell D, Evanoff R, Griswold MD. Expression of Mirlet7 family microRNAs in response to retinoic acid-induced spermatogonial differentiation in mice. Biol Reprod. 2011;85:189–197. doi: 10.1095/biolreprod.110.089458. [DOI] [PMC free article] [PubMed] [Google Scholar]
- Snyder EM, Small C, Griswold MD. Retinoic acid availability drives the asynchronous initiation of spermatogonial differentiation in the mouse. Biol Reprod. 2010;83:783–790. doi: 10.1095/biolreprod.110.085811. [DOI] [PMC free article] [PubMed] [Google Scholar]
- Barrios F, Filipponi D, Pellegrini M, Paronetto MP, Di Siena S, Geremia R, Rossi P, De Felici M, Jannini EA, Dolci S. Opposing effects of retinoic acid and FGF9 on Nanos2 expression and meiotic entry of mouse germ cells. J Cell Sci. 2010;123:871–880. doi: 10.1242/jcs.057968. [DOI] [PubMed] [Google Scholar]
- Zhou Q, Nie R, Li Y, Friel P, Mitchell D, Hess RA, Small C, Griswold MD. Expression of stimulated by retinoic acid gene 8 (Stra8) in spermatogenic cells induced by retinoic acid: an in vivo study in vitamin A-sufficient postnatal murine testes. Biol Reprod. 2008;79:35–42. doi: 10.1095/biolreprod.107.066795. [DOI] [PMC free article] [PubMed] [Google Scholar]
- Van Pelt AM, De Rooij DG. The origin of the synchronization of the seminiferous epithelium in vitamin A-deficient rats after vitamin A replacement. Biol Reprod. 1990;42:677–682. doi: 10.1095/biolreprod42.4.677. [DOI] [PubMed] [Google Scholar]
- Tong MH, Mitchell DA, McGowan SD, Evanoff R, Griswold MD. Two miRNA Clusters, Mir-17-92 (Mirc1) and Mir-106b-25 (Mirc3), are involved in the regulation of spermatogonial differentiation in mice. Biol Reprod. 2012;86:72. doi: 10.1095/biolreprod.111.096313. [DOI] [PMC free article] [PubMed] [Google Scholar]
- Kofman AE, Huszar JM, Payne CJ. Transcriptional analysis of histone deacetylase family members reveal similarities between differentiating and aging spermatogonial stem cells. Stem Cell Rev. 2013 doi: 10.1007/s12015-012-9392-5. (in press) Published online ahead of print 24 June 2012; DOI 10.1007/s12015-012-9392-5. [DOI] [PMC free article] [PubMed] [Google Scholar]
- Kubota H, Avarbock MR, Brinster RL. Spermatogonial stem cells share some, but not all, phenotypic and functional characteristics with other stem cells. Proc Natl Acad Sci U S A. 2003;100:6487–6492. doi: 10.1073/pnas.0631767100. [DOI] [PMC free article] [PubMed] [Google Scholar]
- Gassei K, Ehmcke J, Schlatt S. Efficient enrichment of undifferentiated GFR alpha 1+ spermatogonia from immature rat testis by magnetic activated cell sorting. Cell Tissue Res. 2009;337:177–183. doi: 10.1007/s00441-009-0799-5. [DOI] [PubMed] [Google Scholar]
- Barrios F, Filipponi D, Campolo F, Gori M, Bramucci F, Pellegrini M, Ottolenghi S, Rossi P, Jannini EA, Dolci S. SOHLH1 and SOHLH2 control Kit expression during postnatal male germ cell development. J Cell Sci. 2012;125:1455–1464. doi: 10.1242/jcs.092593. [DOI] [PubMed] [Google Scholar]
- Ballow D, Meistrich ML, Matzuk M, Rajkovic A. Sohlh1 is essential for spermatogonial differentiation. Dev Biol. 2006;294:161–167. doi: 10.1016/j.ydbio.2006.02.027. [DOI] [PubMed] [Google Scholar]
- Toyoda S, Miyazaki T, Miyazaki S, Yoshimura T, Yamamoto M, Tashiro F, Yamato E, Miyazaki J. Sohlh2 affects differentiation of KIT positive oocytes and spermatogonia. Dev Biol. 2009;325:238–248. doi: 10.1016/j.ydbio.2008.10.019. [DOI] [PubMed] [Google Scholar]
- Kamminga LM, Bystrykh LV, de Boer A, Houwer S, Douma J, Weersing E, Dontje B, de Haan G. The Polycomb group gene Ezh2 prevents hematopoietic stem cell exhaustion. Blood. 2006;107:2170–2179. doi: 10.1182/blood-2005-09-3585. [DOI] [PMC free article] [PubMed] [Google Scholar]
- Alajez NM, Shi W, Hui AB, Bruce J, Lenarduzzi M, Ito E, Yue S, O'Sullivan B, Liu FF. Enhancer of Zeste homolog 2 (EZH2) is overexpressed in recurrent nasopharyngeal carcinoma and is regulated by miR-26a, miR-101, and miR-98. Cell Death Dis. 2010;1:e85. doi: 10.1038/cddis.2010.64. [DOI] [PMC free article] [PubMed] [Google Scholar]
- Labbaye C, Spinello I, Quaranta MT, Pelosi E, Pasquini L, Petrucci E, Biffoni M, Nuzzolo ER, Billi M, Foa R, Brunetti E, Grignani F et al. A three-step pathway comprising PLZF/miR-146a/CXCR4 controls megakaryopoiesis. Nat Cell Biol. 2008;10:788–801. doi: 10.1038/ncb1741. [DOI] [PubMed] [Google Scholar]
- Molyneaux KA, Zinszner H, Kunwar PS, Schaible K, Stebler J, Sunshine MJ, O'Brien W, Raz E, Littman D, Wylie C, Lehmann R. The chemokine SDF1/CXCL12 and its receptor CXCR4 regulate mouse germ cell migration and survival. Development. 2003;130:4279–4286. doi: 10.1242/dev.00640. [DOI] [PubMed] [Google Scholar]
- Gilbert DC, Chandler I, McIntyre A, Goddard NC, Gabe R, Huddart RA, Shipley J. Clinical and biological significance of CXCL12 and CXCR4 expression in adult testes and germ cell tumours of adults and adolescents. J Pathol. 2009;217:94–102. doi: 10.1002/path.2436. [DOI] [PubMed] [Google Scholar]
- Buaas FW, Kirsh AL, Sharma M, McLean DJ, Morris JL, Griswold MD, de Rooij DG, Braun RE. Plzf is required in adult male germ cells for stem cell self-renewal. Nat Genet. 2004;36:647–652. doi: 10.1038/ng1366. [DOI] [PubMed] [Google Scholar]
- Costoya JA, Hobbs RM, Barna M, Cattoretti G, Manova K, Sukhwani M, Orwig KE, Wolgemuth DJ, Pandolfi PP. Essential role of Plzf in maintenance of spermatogonial stem cells. Nat Genet. 2004;36:653–659. doi: 10.1038/ng1367. [DOI] [PubMed] [Google Scholar]
- Wong CF, Tellam RL. MicroRNA-26a targets the histone methyltransferase enhancer of Zeste homolog 2 during myogenesis. J Biol Chem. 2008;283:9836–9843. doi: 10.1074/jbc.M709614200. [DOI] [PubMed] [Google Scholar]
- Varambally S, Cao Q, Mani RS, Shankar S, Wang X, Ateeq B, Laxman B, Cao X, Jing X, Ramnarayanan K, Brenner JC, Yu J et al. Genomic loss of microRNA-101 leads to overexpression of histone methyltransferase EZH2 in cancer. Science. 2008;322:1695–1699. doi: 10.1126/science.1165395. [DOI] [PMC free article] [PubMed] [Google Scholar]
- Juan AH, Kumar RM, Marx JG, Young RA, Sartorelli V. Mir-214-dependent regulation of the polycomb protein Ezh2 in skeletal muscle and embryonic stem cells. Mol Cell. 2009;36:61–74. doi: 10.1016/j.molcel.2009.08.008. [DOI] [PMC free article] [PubMed] [Google Scholar]
- Taganov KD, Boldin MP, Chang KJ, Baltimore D. NF-kappaB-dependent induction of microRNA miR-146, an inhibitor targeted to signaling proteins of innate immune responses. Proc Natl Acad Sci U S A. 2006;103:12481–12486. doi: 10.1073/pnas.0605298103. [DOI] [PMC free article] [PubMed] [Google Scholar]
- Lu LF, Boldin MP, Chaudhry A, Lin LL, Taganov KD, Hanada T, Yoshimura A, Baltimore D, Rudensky AY. Function of miR-146a in controlling Treg cell-mediated regulation of Th1 responses. Cell. 2010;142:914–929. doi: 10.1016/j.cell.2010.08.012. [DOI] [PMC free article] [PubMed] [Google Scholar]
- Mei J, Bachoo R, Zhang CL. MicroRNA-146a inhibits glioma development by targeting Notch1. Mol Cell Biol. 2011;31:3584–3592. doi: 10.1128/MCB.05821-11. [DOI] [PMC free article] [PubMed] [Google Scholar]
- Ren Y, Behre E, Ren Z, Zhang J, Wang Q, Fondell JD. Specific structural motifs determine TRAP220 interactions with nuclear hormone receptors. Mol Cell Biol. 2000;20:5433–5446. doi: 10.1128/mcb.20.15.5433-5446.2000. [DOI] [PMC free article] [PubMed] [Google Scholar]
- Enders GC, May JJ., II. Developmentally regulated expression of a mouse germ cell nuclear antigen examined from Embryonic Day 11 to adult in male and female mice. Dev Biol. 1994;163:331–340. doi: 10.1006/dbio.1994.1152. [DOI] [PubMed] [Google Scholar]
- Dann CT, Alvarado AL, Molyneux LA, Denard BS, Garbers DL, Porteus MH. Spermatogonial stem cell self-renewal requires OCT4, a factor downregulated during retinoic acid-induced differentiation. Stem Cells. 2008;26:2928–2937. doi: 10.1634/stemcells.2008-0134. [DOI] [PubMed] [Google Scholar]
- Szabo PE, Hubner K, Scholer H, Mann JR. Allele-specific expression of imprinted genes in mouse migratory primordial germ cells. Mech Dev. 2002;115:157–160. doi: 10.1016/s0925-4773(02)00087-4. [DOI] [PubMed] [Google Scholar]
- McIver SC, Stanger SJ, Santarelli DM, Roman SD, Nixon B, McLaughlin EA. A unique combination of male germ cell miRNAs coordinates gonocyte differentiation. PLoS One. 2012;7:e35553. doi: 10.1371/journal.pone.0035553. [DOI] [PMC free article] [PubMed] [Google Scholar]
- Zhao H, Rajkovic A. MicroRNAs and mammalian ovarian development. Semin Reprod Med. 2008;26:461–468. doi: 10.1055/s-0028-1096126. [DOI] [PubMed] [Google Scholar]
- Ghani S, Riemke P, Schonheit J, Lenze D, Stumm J, Hoogenkamp M, Lagendijk A, Heinz S, Bonifer C, Bakkers J, Abdelilah-Seyfried S, Hummel M et al. Macrophage development from HSCs requires PU.1-coordinated microRNA expression. Blood. 2011;118:2275–2284. doi: 10.1182/blood-2011-02-335141. [DOI] [PMC free article] [PubMed] [Google Scholar]
- Starczynowski DT, Kuchenbauer F, Wegrzyn J, Rouhi A, Petriv O, Hansen CL, Humphries RK, Karsan A. MicroRNA-146a disrupts hematopoietic differentiation and survival Exp Hematol 2011. 39 167 178 e164. [DOI] [PubMed] [Google Scholar]
- Ge K, Guermah M, Yuan CX, Ito M, Wallberg AE, Spiegelman BM, Roeder RG. Transcription coactivator TRAP220 is required for PPAR gamma 2-stimulated adipogenesis. Nature. 2002;417:563–567. doi: 10.1038/417563a. [DOI] [PubMed] [Google Scholar]
- Urahama N, Ito M, Sada A, Yakushijin K, Yamamoto K, Okamura A, Minagawa K, Hato A, Chihara K, Roeder RG, Matsui T. The role of transcriptional coactivator TRAP220 in myelomonocytic differentiation. Genes Cells. 2005;10:1127–1137. doi: 10.1111/j.1365-2443.2005.00906.x. [DOI] [PubMed] [Google Scholar]
- Jiang P, Hu Q, Ito M, Meyer S, Waltz S, Khan S, Roeder RG, Zhang X. Key roles for MED1 LxxLL motifs in pubertal mammary gland development and luminal-cell differentiation. Proc Natl Acad Sci U S A. 2010;107:6765–6770. doi: 10.1073/pnas.1001814107. [DOI] [PMC free article] [PubMed] [Google Scholar]
- Stumpf M, Yue X, Schmitz S, Luche H, Reddy JK, Borggrefe T. Specific erythroid-lineage defect in mice conditionally deficient for Mediator subunit Med1. Proc Natl Acad Sci U S A. 2010;107:21541–21546. doi: 10.1073/pnas.1005794107. [DOI] [PMC free article] [PubMed] [Google Scholar]
- Oda Y, Hu L, Bul V, Elalieh H, Reddy JK, Bikle DD. Coactivator MED1 ablation in keratinocytes results in hair-cycling defects and epidermal alterations. J Invest Dermatol. 2012;132:1075–1083. doi: 10.1038/jid.2011.430. [DOI] [PMC free article] [PubMed] [Google Scholar]
- Hobbs RM, Seandel M, Falciatori I, Rafii S, Pandolfi PP. Plzf regulates germline progenitor self-renewal by opposing mTORC1. Cell. 2010;142:468–479. doi: 10.1016/j.cell.2010.06.041. [DOI] [PMC free article] [PubMed] [Google Scholar]
Associated Data
This section collects any data citations, data availability statements, or supplementary materials included in this article.