

Abstract
Background
Body wasting and cachexia change body composition and organ function, with effects on drug pharmacokinetics. The aim of this study was to investigate how cancer and cancer cachexia modify liver metabolism and renal drug elimination in rats.
Methods
Nine male Wistar-Han rats received a single oral dose of midazolam and propranolol (markers of hepatic metabolism), and 10 rats received single intravenous dose of iohexol, a marker of glomerular filtration rate. After drug delivery, multiple dried blood samples were obtained within 2 h post-dose to evaluate drug pharmacokinetic profiles. After baseline sampling (D0), rats were injected with tumour cells. Drug application and blood sampling were repeated when rats developed tumours (Day 5—D5), and when rats were severely cachectic (Day 10—D10). Clearance (CL) and volume of distribution (Vd) of drugs were assessed with non-linear mixed effects modelling. Weight and body composition were measured on D0 and D10 and were related to pharmacokinetic parameters.
Results
All three drugs showed non-significant trend towards increased CL and Vd on D5. On D10, midazolam and propranolol CL and midazolam Vd significantly decreased from baseline (−80.5%, −79.8%, and −72.0%, respectively, P < 0.05 for all). Iohexol CL decreased by 29.8% from baseline value on D10, which was related to body weight loss (Pearson's r = 0.837, P = 0.019).
Conclusions
Hepatic metabolism and renal drug elimination are significantly reduced in cachexia, which could increase risk of dose-related adverse events.
Keywords: Cancer, Cachexia, Pharmacokinetic, Drug metabolism, Renal function, Liver metabolism
Introduction
With the progression of chronic diseases like cancer, chronic obstructive pulmonary disease, and chronic heart failure, wasting and cachexia may occur. Cachexia is a syndrome of involuntary weight loss due to lean and fat tissue wasting and is an independent predictor of impaired survival.1 The cause of cachexia is not entirely recognized, but disrupted metabolic pathways, inflammation, and abnormal neuro-hormonal signalling seem to be involved.2
Chronic pharmacotherapy is a mainstay of chronic disease management, usually with a fixed therapeutic pattern throughout natural history of the disease. Single exception to this is chemotherapy, where guideline-driven dosing actually is adjusted to body weight, parameters of body composition, and organ function.3 In a clinical setting, the target daily dose for the treatment of chronic disease may not be equally safe and efficient once a patient develops body wasting with or without cachexia.
Pharmacokinetics of drugs may be altered in cachexia as suggested in recent systematic review.4 Absorption of orally administered drugs can change due to cachexia-related changes in intestinal mucosa.5,6 Distribution of drugs may change due to decreased amount of fat and lean tissue and altered concentrations of proteins that bind drugs in plasma (hypoalbuminemia, increased alpha-1 acid glycoprotein).7 The expression and function of drug metabolic enzymes may adjust to altered conditions, caused by cachexia, which may lead to changed metabolism of drugs. Finally, the renal function may become impaired and slow the excretion of drugs and their metabolites. Nevertheless, there is a lack of studies that would assess the impact of cachexia on drug pharmacokinetics,4 and the effect of cachexia on renal function has not been evaluated adequately.
With regard to lack of clinical and experimental data about pharmacokinetics of drugs in cachexia, drug pharmacokinetics in a rat model of cancer cachexia was investigated. Additionally, changes in hepatic metabolism and renal function through pharmacokinetics of midazolam, propranolol, and iohexol were analysed. Midazolam, a low hepatic excretion drug, is considered to be a reliable marker of intrinsic hepatic metabolism and reflects both function and expression of cytochrome CYP3A4.8 Propranolol is more readily metabolized in the liver and is, due to high hepatic extraction, a marker of hepatic blood flow, when given intravenously, but a more prominent marker of cytochrome CYP2D6 activity when given orally.9 Iohexol is excreted only via glomerular filtration and is therefore a marker of renal function.10 We aimed to provide the insight into changes in hepatic metabolism and renal excretion of drugs in cachexia by comparing pharmacokinetics of these three drugs in healthy rats, rats with cancer, and rats with cancer cachexia.
Materials and methods
Animals and cachexia model
Male Wistar-Han rats (n = 19, mean body weight = 223 g) were housed in an SPF (specific-pathogen-free) facility under a 12 h light/dark cycle with food and water provided ad libitum. On the first day of experiment (D0), rats were injected intra-peritoneally with 108 Yoshida AH-130 tumour cells, as described previously.11 After 5 days (D5), rats developed large tumours, and after 10 days (D10), rats were severely cachectic.12
Experimental design
Rats were divided into two groups: in Group A (n = 10) 100 μL of iohexol solution (Omnipaque 300®), containing 64.7 mg of iohexol, was administered intravenously to each rat, and in Group B (n = 9), each rat received 200 μL of midazolam and propranolol solution via gavage. In Group A, blood samples were collected 20, 30, and 60 min after application, while in group B blood samples were taken at 10, 20, 30, 60, 90, and 120 min post-dose. On the first day (D0), after blood sampling was completed, rats were injected with tumour cells. The procedure of single dosing and blood sampling was repeated 5 days after tumour inoculation (D5) and 10 days after (D10). Single sample dosing strategy was used in order to avoid the influence of drugs on development of cancer and cachexia.
On D0 and D10, rats were weighted and nuclear magnetic resonance spectroscopy was performed to assess body composition of each rat. After the withdrawal of the last sample on D10, the rats were euthanized. Study protocol and study procedures were approved by the local animal ethics committee.
Substances and solutions
Omnipaque 300® parenteral solution, containing iohexol in concentration of 647 mg/mL, was purchased from GE Healthcare, AS, Norway. Propranolol hydrochloride was obtained from Fluka-Sigma Aldrich, Buchs, Switzerland, and Midazolam Torrex parenteral solution 5 mg/mL from Chiesi Pharmaceuticals GmbH, Austria. Propranolol was dissolved in midazolam 5 mg/mL solution to obtain concentration 2.5 mg/mL of propranolol. 200 μL of prepared solution was administered to each rat in Group B via gavage, which equaled to 1 mg of midazolam and 0.5 mg of propranolol per each rat. Applied doses were preliminary determined to obtain the desired concentration range of the drugs in blood.13
Dried blood sampling and sample analysis
Before collection of each blood sample, rats were anaesthetized with isoflurane. Approximately 100 μL of blood was taken from jugular vein with a needle (wetted with 0.1 M EDTA solution) and collected to an Eppendorf safe-lock tube (Enfield, Connecticut, USA) containing 2 μL 0.1 M EDTA. The collected blood was gently mixed by hand. Three blood spots of 20 μL were pipetted onto Whatman 903 Protein Saver Cards (Whatman, UK). The cards were allowed to dry for 24 h at room temperature before storage in a dark place. Dried blood spot samples were extracted and analysed with liquid chromatograph coupled to a mass spectrometer as described previously.13
Body weight and body composition measurement
Body composition was determined with nuclear magnetic resonance spectroscopy (EchoMRI-700, Echo Medical Systems, Houston, TX). Lean mass and fat mass in grams were determined for each rat. This system provided the information on fat and lean mass with the accuracy of 2 g. On D10, body weight and body composition were determined only after the tumour was removed from the rat.
Data analysis
Pharmacokinetic modelling
Pharmacokinetic data were analysed using a non-linear mixed effects modelling approach as implemented in NONMEM (version 7.2; ICON Plc, Dublin, Ireland). Model building steps were managed by PsN (version 3.5.3, http://psn.sourceforge.net) and Xpose (version 4.4.0, http://xpose.sourceforge.net). Fortran subroutines were compiled with the Intel Visual Fortran compiler (version 11.0, Intel, Santa Clara, CA). The structural models investigated were one- and two-compartment models with first-order elimination as implemented in ADVAN1/TRANS2 and ADVAN3/TRANS4 subroutines for intravenous dosing of iohexol, and ADVAN2/TRANS2 and ADVAN4/TRANS4 for oral dosing of midazolam and propranolol. The estimated parameters were volume of distribution and clearance (Vd and CL, respectively, in case of a one-compartment model) and volumes of the central and peripheral compartment and distribution and elimination clearances (V1, V2, Q, and CL, respectively, in case of a two-compartment model). With oral dosing, additionally, first-order absorption rate constant was estimated. As the absolute bioavailability (F) cannot be estimated with oral dosing alone, the structural parameters were reported as Vd/F and CL/F or V1/F, V2/F, CL/F, and Q/F.14 Random effects incorporating inter-animal and inter-occasion (D0 vs. D5 vs. D10) variability were included as exponential terms assuming log-normal parameter distributions. Residual variability was described by additive and proportional error models. Parameters were estimated using the first-order conditional estimation method with interaction between the two levels of random effects. For each substance, the modelling strategy aimed at a final model with minimal structural and variability parameters needed to adequately describe the data. The model adequacy was evaluated by standard diagnostic plots of predicted vs. observed concentration and weighted residuals vs. observed concentration or time. Additional criteria were convergence of minimization, the number of significant digits more than three, a successful covariance step, and gradients in the final iteration in the range between 10−3 and 102. Alternative models were compared by the likelihood ratio test. The criterion for selection of a model was a change in minimum value of the objective function of at least 3.84 per one additional parameter, corresponding to P < 0.05.
The influence of cachexia was estimated as a categorical covariate using the following models: Pi,5 = Pi,0 * (1 + Di,5) and Pi,10 = Pi,0 * (1 + Di,10), where Pi,0, Pi,5, and Pi,10 are the baseline (D0), Day 5, and Day 10 values of the parameter of interest, respectively, while Di,5 and Di,10 are relative changes (%) in parameter values. Significance of the effect of cachexia on pharmacokinetics was judged by the likelihood ratio test (a decrease of the objective function value of at least 3.84 per one additional parameter, corresponding to P < 0.05). Additionally, 95% confidence intervals were calculated from parameters' standard errors reported by NONMEM, and the influence of cachexia was considered significant if the 95% confidence intervals of the relative change (Di,5 and/or Di,10) excluded the value of 0.
Statistical analyses
Paired sample t-test was used to compare body weight and body composition between D0 and D10. Linear regression was used to correlate differences in CL and Vd with differences in body weight, lean mass, and fat mass that occurred between D0 and D10. P-value of <0.05 was considered statistically significant. All statistical analyses were performed by SPSS version 21 (SPSS Inc., Chicago, IL).
Results
Out of 19 included animals, 15 completed the study (Figure1). One rat did not develop a tumour on D5 and three rats died before D10. From D0 to D10, rats from both groups experienced significant loss of body weight, lean mass, and fat mass, with exception of lean mass loss in Group A, which did not reach statistical significance (Figure2).
Figure 1.
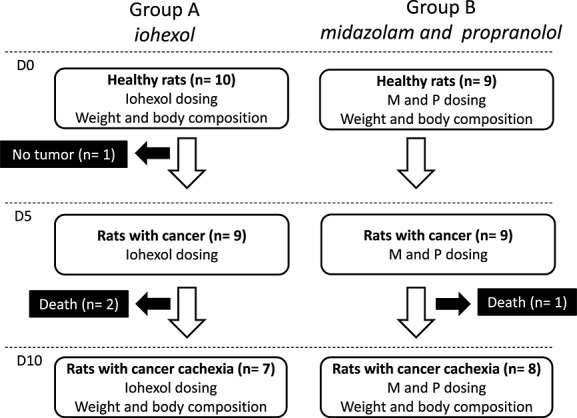
Study flow chart. D0, day of tumour inoculation; D5, 5 days after tumour inoculation; D10, 10 days after tumour inoculation; M, midazolam; P, propranolol.
Figure 2.
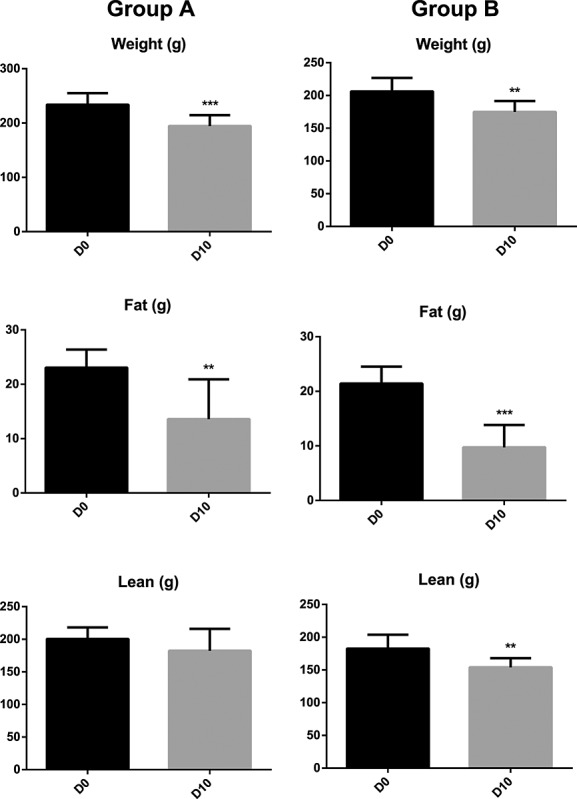
Changes in body weight and body composition from D0 to D10 (mean, standard deviation). D0, day of tumour inoculation; D10, 10 days after tumour inoculation; ** P < 0.01, ***P < 0.001.
Mean pharmacokinetic profiles of investigated drugs are presented in Figure3. Pharmacokinetic variability was more pronounced with oral dosing of midazolam and propranolol compared with intravenous dosing of iohexol (data not shown). For all three compounds, pharmacokinetics was most adequately described by a one-compartment model and a proportional model of residual variability. Pharmacokinetic parameters are summarized in Table1. Because of rapid absorption and limited data in the absorption phase, we were not able to estimate the variability in the absorption rate. Consequently, the effect of cachexia on absorption rate had to be fixed to 0. With midazolam, we were able to estimate the typical value of absorption rate, while with propranolol, the absorption rate had to be fixed to an arbitrary value of 1 min−1. This assumption was tested with a sensitivity analysis of the final model. Without intravenous pharmacokinetic data for midazolam and propranolol, it was not possible to estimate the absorbed fraction (F) after oral dosing. Consequently, clearance and distribution volume are reported as CL/F (apparent oral clearance) and Vd/F (apparent volume of distribution after oral dosing). Inter-occasion variability of CL/F (150% and 170% for midazolam and propranolol, respectively) and Vd/F (190% and 160% for midazolam and propranolol, respectively) was generally in the range of inter-animal variability. Consequently, inter-animal variability was not included in the final model as suggested by Karlsson and Sheiner.15 With the final model for midazolam, the covariance step was not successful (Table1, Model 1). A non-significant increase in CL/F and Vd/F on D5 was therefore fixed to 0 to obtain the precision of the parameter estimates (Table1, Model 2).
Figure 3.
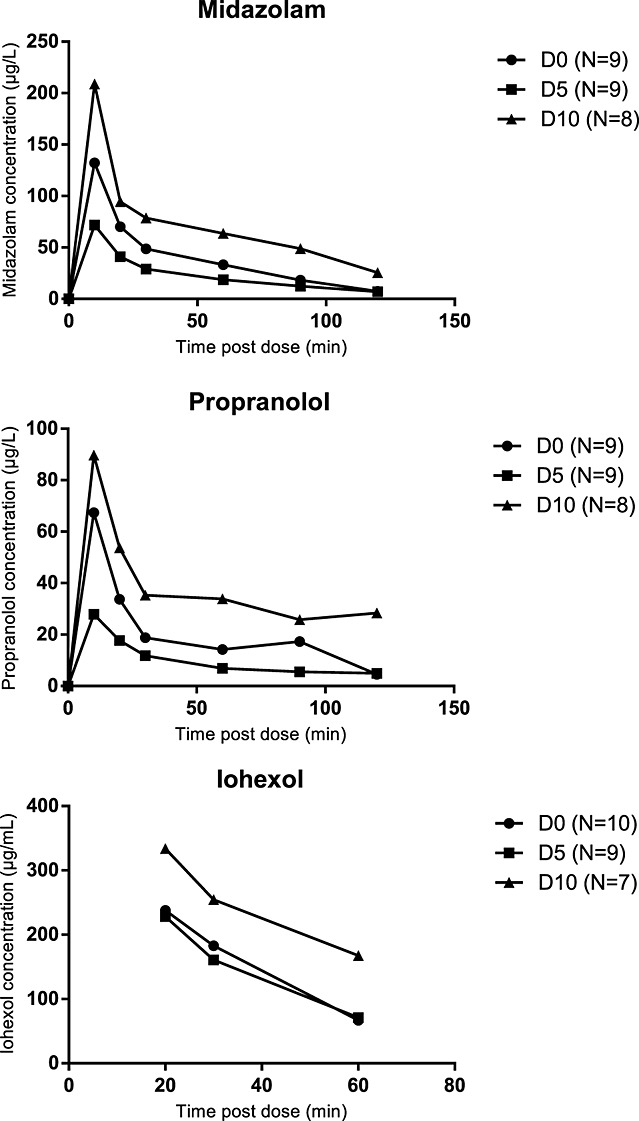
Mean pharmacokinetic profiles of midazolam, propranolol, and iohexol on D0, D5, and D10. D0, day of tumour inoculation, D5, 5 days after tumour inoculation; D10, 10 days after tumour inoculation.
Table 1.
Pharmacokinetic parameters of midazolam, propranolol, and iohexol on D0 and percentage change on D5 and D10 (mean, standard error)
| D0 | D5 % change from D0 | D10 % change from D0 | |
|---|---|---|---|
| Midazolam—Model 1a | |||
| CL/F | 463 mL/min | +5.15 | −80.0 |
| Vd/F | 32.7 L | +11.4 | −70.4 |
| Ka | 0.892 min−1 | NA | NA |
| Midazolam—Model 2 | |||
| CL/F | 474 (107) mL/min | 0 (fixed) | −80.5 (6.42)b |
| Vd/F | 34.5 (6.51) L | 0 (fixed) | −72.0 (6.51)b |
| Ka | 0.892 (0.238) min−1 | NA | NA |
| Propranolol | |||
| CL/F | 177 (141) mL/min | +57.6 (126) | −79.8 (19.9)b |
| Vd/F | 6.14 (3.25) L | +1040 (1091) | +104 (230) |
| Ka | 1 min−1 (fixed) | NA | NA |
| Iohexol | |||
| CL | 4.59 (0.29) mL/min | +7.62 (9.41) | −29.8 (9.46)b |
| Vd | 0.128 (0.0118) L | +33.2 (19.7) | −11.4 (18.4) |
CL, clearance; D0, day of tumour inoculation; D5, 5 days after tumour inoculation; D10, 10 days after tumour inoculation; F, absorption fraction; Ka, absorption rate constant; NA, not applicable; Vd, volume of distribution.
Covariance step not successful (standard errors are not estimated).
Significant change from D0 at α = 0.05.
Pharmacokinetics of iohexol was much less variable, with inter-occasion variability of 20% (CL) and 12% (Vd). However, again, inter-animal variability was in the same range and was therefore not included in the model.
Midazolam
Typical midazolam CL/F on D0 was 463 mL/min, and typical Vd/F was 32.7 L (Table 1). Both parameters slightly increased from D0 to D5, but the change was not significant. On D10, however, a significant reduction of 80% from baseline CL/F value and more than 70% from baseline Vd/F value was observed. The decrease in midazolam CL/F and Vd/F was not related to change in body weight, fat mass, or lean mass.
Propranolol
Typical propranolol CL/F on D0 was 177 mL/min, and typical Vd/F was 6.14 L (Table 1). Similarly as with midazolam, CL/F and Vd/F non-significantly increased on D5. Propranolol CL/F decreased significantly by almost 80% from baseline value on D10, while Vd/F did not change significantly. Similarly as with midazolam, the change in CL/F and Vd/F between D0 and D10 was not associated with any of the measured parameters of body composition.
Iohexol
In healthy rats, typical iohexol CL was 4.59 mL/min and Vd was 128 mL (Table 1). Similar was observed for CL and Vd on D5 as with midazolam and propranolol. On D10, iohexol CL decreased significantly by ∼30% from the baseline value. The decrease in iohexol CL was related to loss of body weight (Pearson's r = 0.837, P = 0.019; Figure4).
Figure 4.
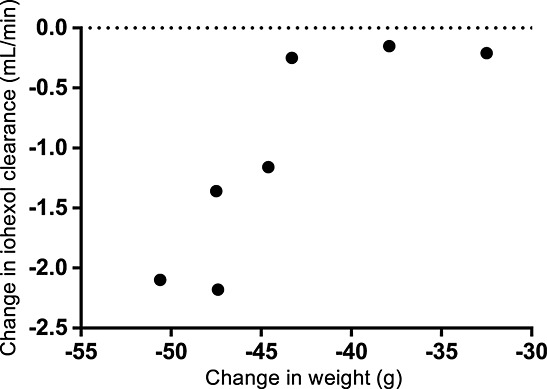
Correlation between weight loss and decrease in renal function from D0 to D10. D0, day of tumour inoculation; D10, 10 days after tumour inoculation.
Discussion
We have shown a transient elevation of hepatic metabolism and renal elimination of drugs at cancer stage, which rapidly deteriorated once cachexia evolved. The changes were not related to changes in body composition, although the reduction in renal function was associated with loss of body weight.
Because the influence of cancer on drug pharmacokinetics has already been investigated to some extent,16 we tried to separate the influence of cancer and cancer cachexia by observing pharmacokinetics of drugs on two different occasions—5 days after tumour inoculation, when tumour is fully grown but there are no signs of cachexia yet, and at D10, when rats had lost more than 15% of baseline body weight and were severely cachectic.12,17 All comparisons of pharmacokinetic parameters were compared intra-animal, which is one of the main advantages of this study.
Drug clearances measured in this study are higher than reported previously for rats, because we measured whole blood clearances instead of plasma clearances.18,19 Midazolam and propranolol have a blood-to-plasma concentration ratio lower than one that results in higher blood clearances when compared with plasma.20,21
Midazolam clearance was not significantly affected by cancer, which suggests that the function of cytochrome CYP3A4 remains unchanged in cancer but decreases by 80% from the baseline value when cachexia develops. Previous studies of CYP3A4 activity in patients with cancer have conflicting results. Some observe no influence of cancer on CYP3A4 activity,16 while others observed reduced midazolam clearance, which was more related to inflammation state of the patients than different genetic polymorphisms of cytochrome.22,23 Our study in an animal model enabled us to observe influence of cancer in a regulated environment—all animals were observed in the same stage of cancer (5 days after tumour inoculation) when no signs of cachexia were present yet. Moreover, the influence of enzyme polymorphism was ruled out, because pharmacokinetic parameters were compared intra-individually. Such regulated conditions are impossible to be achieved in a clinical study with patients, and consequently, different stages of cancer and variety of clinical management could have influenced the results as available in the literature.
Other studies that have investigated the effect of cancer on midazolam metabolism and cytochrome expression in rats were mainly conducted after more than 15 days following tumour inoculation.24,25 These studies showed reduced midazolam metabolism and cytochrome P450 expression, which is in line with our results in cancer cachexia. However, we believe that the distinction between cancer and cancer cachexia is important and could, in part, explain the conflicting results from clinical studies. In clinical practice, this would translate to the need for more cautious dosing of drugs in cancer patients with wasting and cachexia because they are more likely to be at an increased risk of modified drug metabolism with potentially relevant clinical implications.
The clearance of propranolol was also impaired in cachexia. Intravenously given propranolol is a direct marker of hepatic blood flow, while orally administered propranolol reflects both hepatic blood flow and cytochrome function.10,26 The reduction in propranolol clearance on D10 thus suggests that both perfusion of liver and cytochrome CYP2D6 function were reduced in cachexia. Previous studies have shown increased liver blood flow in rats with cancer, which again could be attributable to transient but non-significant increase in propranolol clearance on D5.27 Of interest is also a trend of non-significant increase in apparent volume of distribution after oral dosing on D10, which is contrary to the significant decrease observed with midazolam. A well-stirred model of the first-pass hepatic metabolism suggests that bioavailability of propranolol is dependent on the cytochrome function (intrinsic clearance) and liver blood flow. A trend of increase in Vd/F therefore suggests that in cachexia, a decreased cytochrome CYP2D6 function indicated by a decreased oral clearance is accompanied by reduced hepatic perfusion.
This is the first study in rats to directly assess the influence of cachexia on renal function. Renal function in rats with cancer was investigated before, but the results are conflicting.28–30 Some studies showed no decline in creatinine clearance or glomerular filtration rate (GFR) in cancer,28,29 while others observed aggravation of renal function.30 Interestingly, the study of Rettori et al. showed an increase in creatinine clearance in moderate clinical phase of cancer that rapidly deteriorated in the terminal phase of illness.30 Same was observed in our study, where iohexol clearance slightly increased on D5 and significantly decreased on D10. The decrease in renal function between D0 and D10 was related to weight loss, therefore suggesting that rats with more pronounced weight loss are more prone to deterioration of renal function in cancer cachexia.
Studies of chemotherapy-related toxicity suggest that patients with lower muscle mass are at higher risk for toxicity either due to changed pharmacokinetics and/or due to higher susceptibility of sarcopenic patients to chemotherapy adverse events.31 In our study, changes in pharmacokinetic parameters between D0 and D10 were not related directly to changes in body composition. This may suggest that the observed changes in pharmacokinetics are not primarily caused by loss of lean and fat mass. However, a part of the administered drug could have distributed into the tumour on D10, which had to be removed prior to body composition measurement. This could have masked the effect of body composition on D10 pharmacokinetics.
Similar trends in hepatic and renal function were observed, which could be in part related to changes in cardiac output in cancer and cancer cachexia or to natural history of disease. Increased cardiac output was observed in patients with cancer, and in rats, a slight increase in cardiac function was noted in early stages of cancer.12,32 This could, in part, be responsible for a transient rise in propranolol and iohexol clearance on D5. On the other hand, cardiac function was shown to be severely impaired in cancer cachexia12 and could contribute to decreased renal and hepatic blood flow thereby affecting propranolol and iohexol elimination.
Limitations
Modest study sample and some inter-animal variability in measured drug concentrations could be the cause that not all of the observed changes in pharmacokinetic parameters reached statistical significance. Moreover, pharmacokinetics of midazolam and propranolol were measured in the same group of rats. Although these two substances do not interact at the level of metabolism, individual characteristics of the animals within group could have influenced the observed trends in substance pharmacokinetics, which did not differ relevantly. Additionally, both drugs were administered orally, and thus, the potential changes in absorption fraction were impossible to be differentiated from changes in clearance and volume of distribution. Finally, we cannot clearly delineate the potential propranolol-induced effects on liver blood flow from changes in cytochrome function. Without information in cancer or cachectic rats and with no clear signal in healthy rats,33 we believe that a single propranolol administration could not change liver blood flow to an extent that could significantly influence pharmacokinetic parameters.
Conclusions
We demonstrated that renal function and hepatic clearance are reduced in a rat model of cancer cachexia, modifying major metabolic and elimination routes of pharmacotherapeutic agents. In clinical practice, this could translate to higher concentrations and potentially to higher risk of side effects and toxicity in subjects who develop body wasting and cachexia. With significant prevalence of cachexia in chronic disease and very limited data in the literature, further investigation in animal models and longitudinal studies in patients is warranted.
Acknowledgments
The authors certify that they comply with the ethical guidelines for authorship and publishing of the Journal of Cachexia, Sarcopenia and Muscle (von Haehling S, Morley JE, Coats AJS, Anker SD. Ethical guidelines for authorship and publishing in the Journal of Cachexia, Sarcopenia and Muscle. J Cachexia Sarcopenia Muscle. 2010;1:7–8.)
Conflict of interest
None declared.
References
- Farkas J, von Haehling S, Kalantar-Zadeh K, Morley JE, Anker SD, Lainscak M. Cachexia as a major public health problem: frequent, costly, and deadly. J Cachexia Sarcopenia Muscle. 2013;4:173–179. doi: 10.1007/s13539-013-0105-y. [DOI] [PMC free article] [PubMed] [Google Scholar]
- Fearon K, Arends J, Baracos V. Understanding the mechanisms and treatment options in cancer cachexia. Nat Rev Clin Oncol. 2013;10:90–99. doi: 10.1038/nrclinonc.2012.209. [DOI] [PubMed] [Google Scholar]
- Jacques KA, Erstad BL. Availability of information for dosing injectable medications in underweight or obese patients. Am J Health Syst Pharm. 2010;67:1948–1950. doi: 10.2146/ajhp100226. [DOI] [PubMed] [Google Scholar]
- Trobec K, Kerec Kos M, von Haehling S, Springer J, Anker SD, Lainscak M. Pharmacokinetics of drugs in cachectic patients: a systematic review. PLoS One. 2013;8:e79603. doi: 10.1371/journal.pone.0079603. [DOI] [PMC free article] [PubMed] [Google Scholar]
- Barry RE. Malignancy, weight loss, and the small intestinal mucosa. Gut. 1974;15:562–570. doi: 10.1136/gut.15.7.562. [DOI] [PMC free article] [PubMed] [Google Scholar]
- Sandek A, Valentova M, von Haehling S, Doehner W, Anker SD. The small intestine: a critical linkage in pathophysiology of cardiac cachexia. Int J Cardiol. 2011;146:277–278. doi: 10.1016/j.ijcard.2010.10.083. [DOI] [PubMed] [Google Scholar]
- Muscaritoli M, Anker SD, Argilés J, Aversa Z, Bauer JM, Biolo G, Boirie Y, Bosaeus I, Cederholm T, Costelli P, Fearon KC, Laviano A, Maggio M, Rossi Fanelli F, Schneider SM, Schols A, Sieber CC. Consensus definition of sarcopenia, cachexia and pre-cachexia: joint document elaborated by Special Interest Groups (SIG) “cachexia-anorexia in chronic wasting diseases” and “nutrition in geriatrics”. Clin Nutr. 2010;29:154–159. doi: 10.1016/j.clnu.2009.12.004. [DOI] [PubMed] [Google Scholar]
- Rogers JF, Rocci ML, Haughey DB, Bertino JS. An evaluation of the suitability of intravenous midazolam as an in vivo marker for hepatic cytochrome P4503A activity. ClinPharmacol Ther. 2003;73:153–158. doi: 10.1067/mcp.2003.23. [DOI] [PubMed] [Google Scholar]
- Pirttiaho HI, Sotaniemi EA, Pelkonen RO, Pitkänen U, Anttila M, Sundqvist H. Roles of hepatic blood flow and enzyme activity in the kinetics of propranolol and sotalol. Br J Clin Pharmacol. 1980;9:399–405. doi: 10.1111/j.1365-2125.1980.tb01068.x. [DOI] [PMC free article] [PubMed] [Google Scholar]
- Gaspari F, Perico N, Ruggenenti P, Mosconi L, Amuchastegui CS, Guerini E, Daina E, Remuzzi G. Plasma clearance of nonradioactive iohexol as a measure of glomerular filtration rate. J Am Soc Nephrol. 1995;6:257–263. doi: 10.1681/ASN.V62257. [DOI] [PubMed] [Google Scholar]
- Springer J, Tschirner A, Hartman K, Palus S, Wirth EK, Ruis SB, Möller N, von Haehling S, Argiles JM, Köhrle J, Adams V, Anker SD, Doehner W. Inhibition of xanthine oxidase reduces wasting and improves outcome in a rat model of cancer cachexia. Int J Cancer. 2012;131:2187–2196. doi: 10.1002/ijc.27494. [DOI] [PubMed] [Google Scholar]
- Springer J, Tschirner A, Haghikia A, von Haehling S, Lal H, Grzesiak A, Kaschina E, Palus S, Pötsch M, von Websky K, Hocher B, Latouche C, Jaisser F, Morawietz L, Coats AJ, Beadle J, Argiles JM, Thum T, Földes G, Doehner W, Hilfiker-Kleiner D, Force T, Anker SD. Prevention of liver cancer cachexia-induced cardiac wasting and heart failure. Eur Heart J. 2014;35:932–941. doi: 10.1093/eurheartj/eht302. [DOI] [PMC free article] [PubMed] [Google Scholar]
- Cvan Trobec K, Trontelj J, Springer J, Lainscak M, Kerec KosM. Liquid chromatography-tandem mass spectrometry method for simultaneous quantification of bisoprolol, ramiprilat, propranolol and midazolam in rat dried blood spots. J Chromatogr B Analyt Technol Biomed Life Sci. 2014;958C:29–35. doi: 10.1016/j.jchromb.2014.03.009. [DOI] [PubMed] [Google Scholar]
- Gibaldi M, Perrier D. Pharmacokinetics. 2nd ed. New York: Informa Healthcare; 2007. [Google Scholar]
- Karlsson MO, Sheiner LB. The importance of modeling interoccasion variability in population pharmacokinetic analyses. J Pharmacokinet Biopharm. 1993;21:735–750. doi: 10.1007/BF01113502. [DOI] [PubMed] [Google Scholar]
- Cheeti S, Budha NR, Rajan S, Dresser MJ, Jin JY. A physiologically based pharmacokinetic (PBPK) approach to evaluate pharmacokinetics in patients with cancer. Biopharm Drug Dispos. 2013;34:141–154. doi: 10.1002/bdd.1830. [DOI] [PubMed] [Google Scholar]
- Deboer MD. Animal models of anorexia and cachexia. Expert Opin Drug Discov. 2009;4:1145–1155. doi: 10.1517/17460440903300842. [DOI] [PMC free article] [PubMed] [Google Scholar]
- Iwamoto K, Watanabe J, Araki K, Deguchi N, Sugiyama H. Effect of age on the hepatic clearance of propranolol in rats. J Pharm Pharmacol. 1985;37:466–470. doi: 10.1111/j.2042-7158.1985.tb03041.x. [DOI] [PubMed] [Google Scholar]
- Qi JW, Nakamura K, Hosokawa S, Okada Y, Horiuchi R, Yamamoto K. Time-dependent induction of midazolam-1-hydroxylation enzymes in rats treated with St. John's wort. Biol Pharm Bull. 2005;28:1467–1471. doi: 10.1248/bpb.28.1467. [DOI] [PubMed] [Google Scholar]
- Paixão P, Gouveia LF, Morais JAG. Prediction of drug distribution within blood. Eur J Pharm Sci. 2009;36:544–554. doi: 10.1016/j.ejps.2008.12.011. [DOI] [PubMed] [Google Scholar]
- De Boer T, Wieling J, Meulman E, Reuvers M, Renkema G, den Daas I, van Iersel T, Wemer J, Chen L. Application of dried blood spot sampling combined with LC-MS/MS for genotyping and phenotyping of CYP450 enzymes in healthy volunteers. Biomed Chromatogr. 2011;25:1112–1123. doi: 10.1002/bmc.1580. [DOI] [PubMed] [Google Scholar]
- Baker SD, van Schaik RHN, Rivory LP, Ten Tije AJ, Dinh K, Graveland WJ, Schenk PW, Charles KA, Clarke SJ, Carducci MA, McGuire WP, Dawkins F, Gelderblom H, Verweij J, Sparreboom A. Factors affecting cytochrome P-450 3A activity in cancer patients. Clin Cancer Res. 2004;10:8341–8350. doi: 10.1158/1078-0432.CCR-04-1371. [DOI] [PubMed] [Google Scholar]
- Rivory LP, Slaviero KA, Clarke SJ. Hepatic cytochrome P450 3A drug metabolism is reduced in cancer patients who have an acute-phase response. Br J Cancer. 2002;87:277–280. doi: 10.1038/sj.bjc.6600448. [DOI] [PMC free article] [PubMed] [Google Scholar]
- Charles KA, Rivory LP, Brown SL, Liddle C, Clarke SJ, Robertson GR. Transcriptional repression of hepatic cytochrome P450 3A4 gene in the presence of cancer. Clin Cancer Res. 2006;12:7492–7497. doi: 10.1158/1078-0432.CCR-06-0023. [DOI] [PubMed] [Google Scholar]
- Kato R, Takanaka A, Takahashi A, Onoda K. Drug metabolism in tumor-bearing rats. I. Activities of NADPH-linked electron transport and drug-metabolizing enzyme systems in liver microsomes of tumor-bearing rats. Jpn J Pharmacol. 1968;18:224–244. [PubMed] [Google Scholar]
- Shand DG, Kornhauser DM, Wilkinson GR. Effects of route of administration and blood flow on hepatic drug elimination. J Pharmacol Exp Ther. 1975;195:424–432. [PubMed] [Google Scholar]
- Van Leeuwen PA, Bading JR, Vydelingum NA, Younes RN, de Rooij P, Brennan MF. Organ blood flow in Fischer-344 rats bearing MCA-induced sarcoma. J Appl Physiol (1985) 1991;71:1674–1678. doi: 10.1152/jappl.1991.71.5.1674. [DOI] [PubMed] [Google Scholar]
- Coelho I, Casare F, Pequito DCT, Borghetti G, Yamazaki RK, Brito GAP, Kryczyk M, Fernandes LC, Coimbra TM, Fernandez R. Fish oil supplementation reduces cachexia and tumor growth while improving renal function in tumor-bearing rats. Lipids. 2012;47:1031–1041. doi: 10.1007/s11745-012-3715-9. [DOI] [PubMed] [Google Scholar]
- Fernandez R, Piechnik J, Fabris R, Malnic G, Fernandes LC. Effect of chronic fish oil supplementation on renal function of normal and cachectic rats. Braz J Med Biol Res. 2004;37:1481–1489. doi: 10.1590/s0100-879x2004001000006. [DOI] [PubMed] [Google Scholar]
- Rettori O, Vieira-Matos AN, Gontijo JA. Re-assessment of the renal hydrosaline dysfunction in rats bearing the Walker-256 tumor. Ren Fail. 2000;22:769–784. doi: 10.1081/jdi-100101963. [DOI] [PubMed] [Google Scholar]
- Antoun S, Borget I, Lanoy E. Impact of sarcopenia on the prognosis and treatment toxicities in patients diagnosed with cancer. Curr Opin Support Palliat Care. 2013;7:383–389. doi: 10.1097/SPC.0000000000000011. [DOI] [PubMed] [Google Scholar]
- Von Haehling S, Lainscak M, Kung T, Cramer L, Fülster S, Pelzer U, Hildebrandt B, Sandek A, Schefold JC, Rauchhaus M, Doehner W, Anker SD. Non-invasive assessment of cardiac hemodynamics in patients with advanced cancer and with chronic heart failure: a pilot feasibility study. Arch Med Sci. 2013;9:261–267. doi: 10.5114/aoms.2013.34574. [DOI] [PMC free article] [PubMed] [Google Scholar]
- Hillon P, Blanchet L, Lebrec D. Effect of propranolol on hepatic blood flow in normal and portal hypertensive rats. Clin Sci (Lond) 1982;63:29–32. doi: 10.1042/cs0630029. [DOI] [PubMed] [Google Scholar]