

Abstract
Background
In order to grow the potential therapeutic armamentarium in the cachexia domain of supportive oncology, there is a pressing need to develop suitable biomarkers and potential drug targets. This pilot study evaluated several potential candidate biomarkers in skeletal muscle biopsies from a cohort of upper gastrointestinal cancer (UGIC) patients.
Methods
One hundred seven patients (15 weight-stable healthy controls (HC) and 92 UGIC patients) were recruited. Mean (standard deviation) weight-loss of UGIC patients was 8.1 (9.3%). Cachexia was defined as weight-loss ≥5%. Rectus abdominis muscle was obtained at surgery and was analysed by western blotting or quantitative real-time–polymerase chain reaction. Candidate markers were selected according to previous literature and included Akt and phosphorylated Akt (pAkt, n = 52), forkhead box O transcription factors (n = 59), ubiquitin E3 ligases (n = 59, control of muscle anabolism/catabolism), BNIP3 and GABARAPL1 (n = 59, as markers of autophagy), myosin heavy-chain (MyHC, n = 54), dystrophin (n = 39), β-dystroglycan (n = 52), and β-sarcoglycan (n = 52, as markers of structural alteration in a muscle). Patients were followed up for an average of 1255 days (range 581–1955 days) or until death. Patients were grouped accordingly and analysed by (i) all cancer patients vs. HC; (ii) cachectic vs. non-cachectic cancer patients; and (iii) cancer patients surviving ≤1 vs. >1 year post operatively.
Results
Cancer compared with HC patients had reduced mean (standard deviation) total Akt protein [0.49 (0.31) vs. 0.89 (0.17), P = 0.001], increased ratio of phosphorylated to total Akt [1.33 (1.04) vs. 0.32 (0.21), P = 0.002] and increased expression of GABARAPL1 [1.60 (0.76) vs. 1.10 (0.57), P = 0.024]. β-Dystroglycan levels were higher in cachectic compared with non-cachectic cancer patients [1.01 (0.16) vs. 0.87 (0.20), P = 0.007]. Survival was shortened in patients with low compared with high MyHC levels (median 316 vs. 1326 days, P = 0.023) and dystrophin levels (median 341 vs. 660 days, P = 0.008).
Conclusions
The present study has identified intramuscular protein level of β-dystroglycan as a potential biomarker of cancer cachexia. Changes in the structural elements of muscle (MyHC or dystrophin) appear to be survival biomarkers.
Keywords: Cancer, Cachexia, Survival, Biomarkers, Skeletal muscle
Introduction
Cancer cachexia represents an important yet often under-appreciated cause of patient morbidity and mortality. It is ‘a multifactorial syndrome defined by an ongoing loss of skeletal muscle mass (with or without loss of fat mass) that cannot be fully reversed by conventional nutritional support and leads to progressive functional impairment’.1 Cachexia is due to a combination of reduced food intake and metabolic change. The prevalence of cachexia varies with tumour type and stage and may also vary with the genotype of the host.2 Affected individuals face increased risks of treatment failure (be it chemotherapy, radiotherapy, or surgery), increased risks of treatment side-effects, and an increased mortality rate.1,3
Cachexia in its advanced phase (where patients may have lost 20–30% of their body weight) is easily identified, but by this stage, it is often impossible to undertake any realistic form of multimodal rehabilitation. Thus, it would be useful to identify patients who are at risk or in the early phase of cancer cachexia so that targeted intervention can be instituted. An early intervention approach has been hampered by a limited understanding of the molecular pathways implicated in human cancer cachexia along with a lack of validated biomarkers. For example, although elevated serum C-reactive protein (CRP) is a robust indicator of systemic inflammation and has been linked to cancer-associated hypermetabolism, reduced food intake and shortened survival,4 in a multivariate model of weight-loss in upper gastrointestinal cancer (UGIC) patients, the estimate of effect size on degree of weight-loss for CRP was only 34%.5 Loss of skeletal muscle has been identified as the central characteristic of cancer cachexia.1 We hypothesised that either alteration in pathways of muscle atrophy or in the components of muscle itself might provide more robust biomarkers.
Muscle wasting occurs as a result of an imbalance between protein synthesis and degradation. Evidence from animal models of muscle atrophy suggests that the catabolic ubiquitin proteasome and autophagy pathways are of key importance.6–10 Despite this knowledge, there remains limited data relating to human cancer cachexia. A few studies have identified potential biomarkers of cachexia in various tissue compartments using different methodological approaches.2,11–14 Ideally, a biomarker should be assessed with the minimum of discomfort or complexity to the patient. However, at the level of biomarker discovery and biomarkers that can inform pathophysiology or drug targets, more invasive methods (e.g. muscle biopsies) may be required until a less invasive correlate can be identified. We sought to identify potential clinically relevant cachectic biomarkers in skeletal muscle biopsies from UGIC patients in relation to weight-loss and post-operative survival. A hypothesis-driven approach was taken, where putative candidate genes or proteins, selected according to previous literature, were considered one by one as possible biomarkers.15 Candidate markers included Akt and phosphorylated Akt (pAkt), forkhead box O (FOXO) transcription factors, ubiquitin E3 ligases (control of muscle anabolism/catabolism),6–8,16,17 BNIP3 and GABARAPL1 (as markers of autophagy),6,9,18,19 myosin heavy-chain (MyHC), dystrophin, β-dystroglycan, and β-sarcoglycan (as markers of structural alteration in a muscle).7,10,20,21
Materials and methods
Subjects
Ninety-two consecutive UGIC patients [with a diagnosis of oesophago-gastric (n = 56), small bowel (n = 2), pancreatic (n = 33), or common bile duct (n = 1) malignancy] undergoing potentially curative surgery were recruited. Sixteen patients had Stage IV disease, 38 patients had Stage III, 23 patients had Stage II, and 15 patients had Stage I disease. Patients (n = 27) who had completed a course of neoadjuvant chemotherapy had not received chemotherapy in the 4 weeks prior to surgery/biopsy. No subjects were knowingly taking anabolic/catabolic agents and had uncontrolled diabetes or thyroid disorders. The weight-stable healthy controls (HC) comprised 15 subjects undergoing abdominal surgery for non-malignant and non-inflammatory conditions (e.g. hernia repair and cholecystectomy). Written informed consent was obtained from all subjects, and ethical approval was received from Lothian Research Ethics Committee (UK). UGIC patients were followed up for an average of 1255 days (range 581–1955 days) post operatively or until death.
Anthropometry, weight-loss, and performance status
Body weight was measured in light clothing using a beam scale (Seca, UK). Height was measured using a standard wall-mounted measure. The patients' clinical details were recorded, and degree of weight-loss from self reported pre-illness (∼6 months previously) stable weight was documented. Patients were classified as cachectic if they had weight-loss ≥5%.1 Karnofsky performance score (KPS) was assessed in each patient by a single observer.
Patient groups
In order to determine if biomarkers were just markers of cancer in general or bona fide cachexia markers, patients were divided into groups for analyses as follows: healthy control vs. cancer and subsequently non-cachectic cancer and cachectic cancer patients. To assess survival biomarkers, cancer patients were divided according to survival > or <1 year post operatively. This cut-off was chosen in line with clinical practice, where it is generally considered meaningful in terms of surgical and oncological outcome and furthermore has recently been advocated by the All Party Parliamentary Group on Cancer.22
Muscle biopsies
All biopsies were taken at the start of an open abdominal surgery under general anaesthesia. Patients had undergone an overnight fast. The edge of the Rectus abdominis was exposed, and a 1 cm3 specimen was removed using sharp dissection. Tissue samples were quickly cleaned of blood, were flash frozen in liquid nitrogen, and were stored at −80°C until further analysis.
Blood measures
All blood samples were taken following an overnight fast. CRP level was measured using enzyme-linked immunosorbent assay (Ely, UK). A CRP ≥5 mg/L (the upper limit of normal in our lab) was considered consistent with the presence of systemic inflammation.
Protein isolation
Approximately 20 mg of muscle was homogenised in 0.5 mL of lysis buffer [Triton X-100 (1%), NaCl (150 mM), Tris–HCl (50 mM), ethylenediaminetetraacetic acid (EDTA, 1 mM), phenylmethylsulfonyl fluoride (1 mM), protease inhibitors (Roche Diagnostics, Basel, Switzerland, 1 tablet per 10 mL), and water to 10 mL] using a powergen 125 (Fisher Scientific, Waltham, MA, USA) electric homogeniser. Samples were left on ice for 15 min prior to centrifuging at 13 000 rpm for 15 min. The supernatant was removed, and protein concentration was determined by comparing equal volumes of sample solution to known standards using the Lowry method. Samples were then stored at −80°C.
Nuclear protein extraction (for forkhead box O transcription factors)
Approximately 20 mg of muscle was resuspended in 180 μL of low salt lysis buffer [10 mM (4-(2-hydroxyethyl)-1-piperazineethanesulfonic acid, HEPES), 10 mM KCl, 1.5 mM MgCl2, 0.1 mM EDTA, 0.1 mM ethylene glycol tetraacetic acid (EGTA), 1 mM dithiothreitol (DTT), 0.5 mM phenylmethylsulfonyl fluoride, and protease inhibitors (1 tablet per 10 mL)] and ground using a hand held homogeniser. Samples were incubated on ice for 5 min before two cycles of freeze-thaw lysis. After a brief vortex, samples were centrifuged at 4000 rpm for 3 min. The supernatant was removed, and the pellet (containing the nuclei) was resuspended in 40 μL high salt extraction buffer [20 mM HEPES, 420 mM NaCl, 1 mM EDTA, 1 mM EGTA, 25% glycerol, 1 mM DTT, and protease inhibitors (1 tablet per 10 mL)]. Samples were incubated on ice for 30 min with gentle mixing of the tubes every 5–10 min. Samples were centrifuged at 4000 rpm for 5 min at 4°C. The supernatant which now contained the nuclear proteins was aliquoted into tubes and was stored immediately at −80°C.
Western blotting
The 20 μg of protein from each sample was added to 3 μL of 4 × lbs (0.5 M Tris–HCl pH 6.8, 20% glycerol, 4% Sodium Dodecyl Sulphate (SDS), 0.05% β-mercaptoethanol, and 0.004% bromophenol blue) and was boiled for 3 min. Proteins were resolved using SDS-polyacrylamide gel electrophoresis at 160 V for 45 min. Proteins were transferred to a nitrocellulose membrane (80 mA for 1 h) using semi-dry transfer (biorad). Membranes were blocked with either 3% Bovine Serum Albumin (BSA)/Tris-buffered saline and tween 20 (TBST; Tris-Buffered Saline (TBS), 0.05% tween) overnight at 4°C or with 5% milk/TBST for 1 h at room temperature. Incubation with primary antibody (1:1000) was carried out in either 3% BSA/TBST or 0.5% milk/TBST solution at room temperature for 2 h or overnight at 4°C. Membranes were washed with TBST, and primary antibody binding was detected using horseradish-peroxidase-conjugated secondary antibodies (1:2000 to 1:5000). Specific signal was detected using enhanced chemiluminescence reagent (GE Healthcare, Cleveland, OH, USA) and exposure on photographic film (Kodak, Rochester, NY, USA). Films were scanned, and densitometry values were estimated using ImageJ (NIH) software. All proteins were normalised to alpha-skeletal actin as a loading control, except for FOXO1/3a which, because they were nuclear protein extracts, were normalised to lamin A/C.
Antibodies
The primary antibodies used in the study were Akt, pAkt (ser473), FOXO1, FOXO3a (cell signalling), lamin A/C (Santa Cruz Biotechnology Inc., Santa Cruz, CA, USA), dystrophin [MANDYS102 (7D2)], β-dystroglycan [MANDAG2 (7D11)], (Developmental Studies Hybridoma Bank), β-sarcoglycan (abcam), myosin heavy chain (fast, sigma), and alpha-skeletal actin (novocaestra). Secondary antibodies were anti-mouse or anti-rabbit (upstate).
RNA isolation
Total RNA was extracted from approximately 20 mg of muscle using TRIzol (Invitrogen, Waltham, MA, USA) reagent according to the manufacturer's directions. The RNA pellet was resuspended in diethylpyrocarbonate treated water, and RNA concentration was determined using a nanodrop spectrophotometer (LabTech International, Uckfield, UK). RNA quality was assessed using 260/280 and 230/260 ratios and the RNA Integrity Number (RIN) score from the bioanalyzer 2100 instrument (Agilent Technologies, Santa Clara, CA, USA).
Quantitative real-time–polymerase chain reaction
Total RNA was extracted as described previously. cDNA was prepared using 1 μg RNA, TaqMan reverse transcription reagents (Applied Biosystems, Foster City, CA, USA), and random hexamer primers (Applied Biosystems). Primers were designed to span introns using primer express 3.0 software (Applied Biosystems), and the primers were constructed by Invitrogen (Paisley, UK). Primer sequences used were BNIP3_Fw; GTC AAG TCG GCC GGA AAA TA, BNIP3_Rv; GCG CTT CGG GTG TTT AAA GA, GABARAPL1_Fw; CCA CCG CAA GGA GAC AGA AG, GABARAPL1_Rv; GAA AAT GTG ATG ACG GTG TGT GT, MAFBX_Fw; CCG GCT GTT GGA GCT GAT A, MAFBX_Rv; TTG GGC GAT GCC ACT CA, MURF1_Fw; GCT AGG CGT GGC TCT CAT TC, and MURF1_Rv; TCC TGG ATC AGG CTC GAC TT. Samples were run on an Applied Biosystems 7900HT fast real-time polymerase chain reaction (PCR) system (Applied Biosystems) in triplicates of 20 μL per well using SYBR green PCR master mix (Applied Biosystems) as per manufacturer's instructions. Expression levels were normalised to ribosomal 18S RNA, and results were examined using the delta–delta Threshold Cycle (CT) method.23
Statistical analysis
For analysis of quantitative real-time-PCR and western blotting results, statistical package for the social sciences v19.0 was used. Mathematical transformation (log) was performed when appropriate. Student's two tailed t-test, Mann–Whitney or Kruskal Wallis test was used to compare means between groups. Contingency tables were constructed where relevant and were analysed by chi-squared test. Patients were divided into those who survived > or <1 year post operatively (a meaningful surgical and oncological outcome and recently advocated by the All Party Parliamentary Group on Cancer.22 Receiver-operating characteristic (ROC) analysis was performed using this division, and the cut-off that gave the highest sensitivity and specificity was manually selected. Kaplan–Meier survival curves and log-rank comparison was used to assess differences in survival between groups. Statistical significance was set at a P-value (two-tailed) of ≤0.05.
Results
One hundred seven patients were recruited in total (15 HC and 92 UGIC patients). Demographics for the entire cohort are illustrated in Table 1. Biopsies were used according to availability of tissue for different biomarkers. There were four separate groups, and the demographics for these are illustrated in Supporting Information, Table S1. Supporting Information, Figure S1, shows the overlap between groups. No significant differences were evident between these groups and the entire cohort.
Table 1.
Patient demographics for (A) healthy controls and cancer patients (with and without cachexia) and (B) cancer patients surviving ≤ 1 vs. > 1 year. Results are presented as mean ± standard deviation or categorically except for median survival
| Cancer | Cancer | |||
|---|---|---|---|---|
| A | Control | All cancer | No cachexia | Cachexia |
| n = | 15 | 92 | 41 | 51 |
| M/F | 8/7 | 66/26 | 34/7 | 32/19** |
| Age (year) | 56 ± 17 | 65 ± 10* | 68 ± 9 | 63 ± 9** |
| Weight-loss (%) | 0.0 ± 0.0 | 8.1 ± 9.3* | 0.8 ± 3.0 | 13.9 ± 8.6** |
| Survival (days) | – | 675 | 846 | 562** |
| BMI (kg/m2) | 28.0 ± 4.5 | 25.7 ± 4.0* | 27.0 ± 4.0 | 24.6 ± 3.7** |
| CRP (mg/L) | 3.5 ± 2.7 | 15.5 ± 31.3 | 12.0 ± 29.6 | 18.3 ± 32.6 |
| CRP≥5mg/L (Y/N) | 4/11 | 41/51 | 15/26 | 26/25 |
| KPS | 100 ± 0 | 89 ± 13* | 92 ± 10 | 86 ± 14** |
| B | Survival ≤1 year | Survival>1 year | ||
|---|---|---|---|---|
| n = | 27 | 64 | ||
| M/F | 18/9 | 48/16 | ||
| Age (year) | 66 ± 10 | 65 ± 10 | ||
| Weight-loss (%) | 12.0 ± 11.1 | 6.3 ± 8.0*** | ||
| Survival (days) | 245 | 1195*** | ||
| BMI (kg/m2) | 25.3 ± 3.5 | 26.0 ± 4.2 | ||
| CRP (mg/L) | 18.0 ± 36.3 | 14.6 ± 29.4 | ||
| CRP ≥ 5 mg/L (Y/N) | 16/11 | 25/39 | ||
| KPS | 83 ± 13 | 91 ± 12*** |
P < 0.05 cancer vs. control patients.
P < 0.05 cachectic vs. non-cachectic patients.
P < 0.05 survival >1 year vs. survival ≤1 year.
M, male; F, female; BMI, body mass index; CRP, C-reactive protein; KPS, Karnofsky performance score; Y, Yes; N, No.
Compared with HC, cancer patients were older [mean (SD) age 65 (10) vs. 56 (17) years, P = 0.003], had higher average weight-loss [8.1 (9.3) vs. 0 (0) %, P = 0.001], had lower body mass index [25.7 (4.0) vs. 28.0 (4.5) kg/m2, P = 0.046], and a significantly had lower KPS [89 (13) vs. 100 (0), P = 0.001, Table 1A].
Within the cancer patient cohort, cachectic patients compared with non-cachectic patients had a larger proportion of women (19/51 vs. 7/41, chi-squared P = 0.033), were younger [63 (9) vs. 68 (9) years, P = 0.022], had shortened median survival (562 vs. 846 days, P = 0.030), and had a lower body mass index [24.6 (3.7) vs. 27.0 (4.0) kg/m2, P = 0.004]. KPS was also significantly lower in cachectic compared with non-cachectic patients [86 (14) vs. 92 (10), P = 0.020, Table 1A].
Variability of protein biomarkers in the presence of cancer and cachexia
Results of the skeletal muscle biomarkers are illustrated in Figure 1. Level of total Akt protein was reduced in cancer patients compared with HC [0.49 (0.31) vs. 0.89 (0.17), P = 0.001], but there was no significant difference in pAkt protein level [0.47 (0.34) vs. 0.29 (0.2), P = 0.104]. However, the ratio of pAkt to total Akt (indicative of Akt activity) was increased in cancer patients compared with HC [1.33 (1.04) vs. 0.32 (0.21), P = 0.002].
Figure 1.
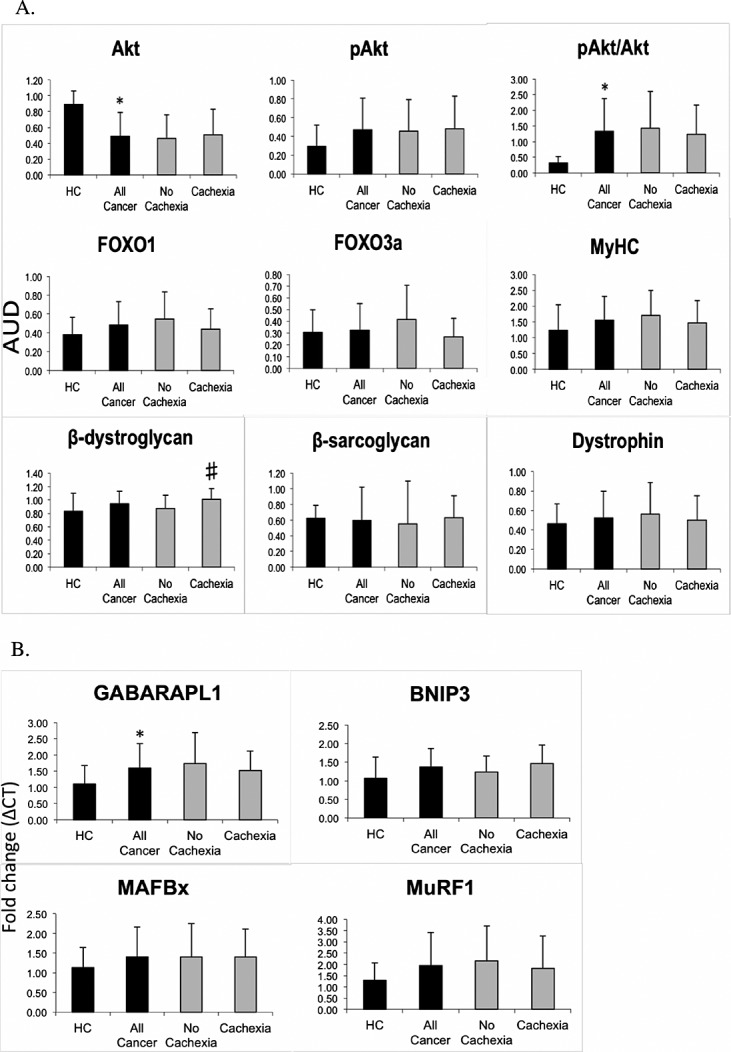
Graphs showing (A) densitometry of protein biomarkers normalised to loading control or (B) delta–delta (Δ) Threshold Cycle (CT) expression of mRNA biomarkers for healthy controls and cancer patients (with and without cachexia).
Cachectic cancer patients had significantly higher levels of β-dystroglycan than non-cachectic cancer patients [1.01 (0.16) vs. 0.87 (0.20), P = 0.007]. There was also a trend towards increased levels of β-sarcoglycan [0.63 (0.28) vs. 0.55 (0.55), P = 0.052].
Variability of mRNA biomarkers in the presence of cancer and cachexia
Results of the skeletal muscle biomarkers are illustrated in Figure 1. There was significantly increased expression of GABARAPL1 in cancer patients compared with HC [1.60 (0.76) vs. 1.10 (0.57), P = 0.024] and a trend towards an increase in expression of BNIP3 [1.37 (0.49) vs. 1.07 (0.57), P = 0.058]. No mRNA biomarkers related to the presence of cachexia.
Variability of biomarkers associated with survival
Patients who survived ≤1 year post operatively compared with those who survived >1 year had significantly higher average weight-loss [12.0 (11.1) vs. 6.3 (8.0) %, P = 0.007)]and a lower KPS [83 (13) vs. 91 (12), P = 0.004, Table 1B].
Given that there are no ‘normal’ cut-offs for skeletal muscle protein levels or mRNA expression for potential markers, ROC analysis was performed. The most promising candidates from this analysis were MyHC, dystrophin, and pAkt [area under the curves were 0.674 (P = 0.069), 0.714 (P = 0.070), and 0.669 (P = 0.068), respectively]. Coordinates of the ROC curves for these three markers were inspected and a cut-off of ≥0.87 chosen for MyHC to give a sensitivity of 84.8% and specificity of 46.2%, a cut-off of ≥0.31 chosen for dystrophin to give a sensitivity of 85.0% and specificity of 55.6%, and a cut-off of ≥0.19 chosen for pAkt to give a sensitivity of 87.5% and specificity of 42.3%. Kaplan–Meier survival analysis using these cut-offs (Figure 2) showed a significantly shorter survival for those with lower compared with higher MyHC levels (median survival 316 vs. 1326 days, P = 0.023) and lower compared with higher dystrophin levels (median survival 341 vs. 660 days, P = 0.008), but no significant difference between high and low pAkt levels (P = 0.320). Given the difference in survival for MyHC and dystrophin, the demographics of the low vs. higher levels of MyHC and dystrophin groups were examined (Table 2). None of the variables differed significantly between the groups for either MyHC or dystrophin.
Figure 2.
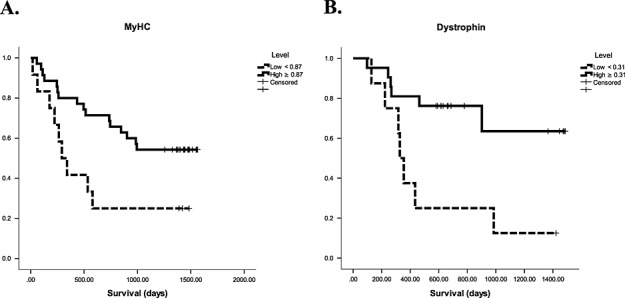
Kaplan–Meier survival curves for patients with (A) low (<0.87) vs. high (≥0.87) myosin heavy-chain protein levels, log rank P = 0.023 and (B) low (<0.31) vs. high (≥0.31) dystrophin protein levels, log rank P = 0.008.
Table 2.
Patient demographics according to the receiver-operating characteristic derived cut-offs for (A) myosin heavy-chain and (B) dystrophin. Results are presented as mean ± standard deviation or categorically
| A. MyHC | Low (<0.87) | High (≥0.87) |
|---|---|---|
| n = | 12 | 35 |
| M/F | 7/5 | 21/14 |
| Age (year) | 63 ± 7 | 64 ± 10 |
| BMI (kg/m2) | 24.9 ± 4.4 | 25.4 ± 3.8 |
| Weight-loss (%) | 9.8 ± 7.4 | 9.6 ± 12.1 |
| Cachexia (Y/N) | 9/3 | 20/15 |
| CRP (mg/L) | 20.3 ± 41.6 | 12.1 ± 25.8 |
| CRP ≥ 5 mg/L (Y/N) | 7/5 | 14/21 |
| KPS | 88.2 ± 10.8 | 92.1 ± 12.1 |
| B. Dystrophin | Low (<0.31) | High (≥0.31) |
|---|---|---|
| n = | 8 | 21 |
| M/F | 5/3 | 10/11 |
| Age (year) | 62 ± 13 | 63 ± 9 |
| BMI (kg/m2) | 26.8 ± 6.3 | 25.0 ± 4.3 |
| Weight-loss (%) | 9.5 ± 7.5 | 9.7 ± 11.3 |
| Cachexia (Y/N) | 7/5 | 14/21 |
| CRP (mg/L) | 45.8 ± 52.3 | 11.8 ± 22.4 |
| CRP ≥ 5 mg/L (Y/N) | 5/3 | 8/13 |
| KPS | 82.5 ± 8.9 | 84.3 ± 15.0 |
M, male; F, female; BMI, body mass index; CRP, C-reactive protein; KPS, Karnofsky performance score; Y, Yes; N, No.
Discussion
In this biomarker discovery study, we demonstrated suppression of total Akt protein levels in the skeletal muscle of cancer patients but with an increased pAkt/Akt ratio. β-Dystroglycan appeared to relate to the presence of significant weight-loss in cancer patients. Low MyHC and dystrophin protein levels both related to shortened survival.
In one of very few similar studies, Schmitt et al.24 examined protein levels and phosphorylation status of muscle atrophy/hypertrophy pathway components in eight pancreatic cancer patients with cachexia compared with eight weight-stable cancer or pancreatitis patients.24 They observed reduced levels of Akt, MyHC, and FOXO1 in the cachectic group. In the current study, which looked at a much larger cohort of patients with a variety of UGIC, along with non-cancer HC, we did not observe any differences in these markers between cachectic and non-cachectic patients. We did, however, observe cancer patients (compared with non-cancer HC) to have a reduction in Akt levels, but with a relative increase in overall Akt activity (expressed as the ratio of pAkt to total Akt). It should be noted that whilst FOXO3 antibody and methodology for determining MyHC levels differed, the antibodies for FOXO1, Akt, and pAkt were the same between the two studies and would thus not explain these contrasting results. Schmitt et al.24 defined cachexia as >10% weight-loss in 6 months, whereas for the current study, cachexia was defined as ≥5% weight-loss1 However, when we analysed our data according to a 10% weight-loss cut-off, the results for individual variables did not differ from using a 5% weight-loss cut-off (data not shown). Therefore, another explanation would be that total protein turnover is suppressed in cancer patients25 with a reduction in the available pool of Akt, and that increased phosphorylation represents a compensatory mechanism. In support of this, in chronic obstructive pulmonary disease patients with cachexia, an increased ratio of pAkt to total Akt has also been observed with the suggestion that this represents an attempt to restore muscle mass.26,27
The muscle-specific E3 ubiquitin ligases, MuRF-1, and atrogin-1/MAFbx are commonly used to indicate activation of the ubiquitin proteasome pathway after the discovery that they were upregulated in several distinct models of atrophy.6 Likewise, markers of autophagy have been shown to be increased in cachectic mice and under the control of FOXO3.18 However, in the current study, FOXO transcription factors and the ubiquitin E3 ligases were similar between HC and cancer patients and were not influenced by the presence of cachexia. Cancer patients did have increased expression of GABARAPL1 and a trend towards increased expression of BNIP3, both of which play a key role in autophagy. However, we did not see either of these autophagy markers significantly relating to survival or weight-loss. There was evidence of increased β-dystroglycan protein levels in cachectic patients and a trend towards increased protein levels of β-sarcoglycan. Whilst dysregulation of the dystrophin glycoprotein complex is a feature of muscular dystrophies and has been associated with cachexia,20 increased β-dystroglycan levels were not evident. In a mouse model of muscular dystrophy treated with an Adenosine Monophosphate-Activated Protein Kinase (AMPK) activator, increased utrophin coincided with an increase in β-dystroglycan and resultant strengthening of the sarcolemma.28 It is therefore conceivable that the relationship between β-dystroglycan and cachexia seen in the current study represents an attempt at muscle membrane repair as it enters a more dysregulated state with progressive weight-loss. Given that the current study is not mechanistic and utrophin was not investigated as a potential marker, this suggestion is speculative.
It is striking that we demonstrated an association between low levels of structural muscle proteins and shortened survival. The lack of significant demographic differences between the low and higher level MyHC/dystrophin groups suggests that they are bona fide markers of post-operative survival. Lower levels of these structural proteins may identify a susceptible population, where muscle structure/membrane integrity has already started to become compromised. Alterations in membrane structure and integrity have been demonstrated in C-26 tumour bearing mice and oesophagogastric cancer patients, which is thought to be due, at least in part, to disruption of the dystrophin glycoprotein complex.20 This normally provides a strong mechanical link between the intracellular cytoskeleton and extracellular matrix.29 It is also thought that there is selective targeting of myofibrillar proteins, in particular MyHC, in cancer cachexia7,10 although a single study has suggested that the selective breakdown of MyHC in mice with cancer may be artefactual.30 In addition, myofibrillar degradation appears to occur in a time-dependent manner.21 Adding to the concept that membrane damage is important in the pathogenesis of cancer cachexia, our laboratory has recently shown that the presence of various myosin species in the urine of patients with oesophago-gastric cancer relates to significant (>10%) weight-loss.11 Our observations in the current study that patients with lower skeletal muscle dystrophin or MyHC protein levels are associated with a shortened survival are entirely consistent with this concept. Therefore, measurements of these structural elements in skeletal muscle appear to be suitable biomarkers relating to survival in UGIC cancer patients.
By comparing cachectic, non-cachectic, and HC groups, this study evaluates the potential of certain variables to act as biomarkers of cachexia. However, it is not possible to determine the precise role of these variables in cachexia by comparing the cachectic with non-cachectic groups. The patients without cachexia at diagnosis represent a mixed group some of whom will remain weight-stable, but a significant other group will progress to cachexia and is therefore in a pre-cachectic state. This heterogeneity within the weight-stable group potentially masked changes in some variables that may play a role in development of cachexia/pre-cachexia. In order to further explore this area, repeated assessments of patients would be required to determine which individuals progress to losing weight after the initial biopsy. Whilst longitudinal studies in human cancer cachexia may be informative in this regard, they are difficult to carry out owing to the requirements for multiple assessments/tissue samples in a frail population. In addition, there may be varying responses among patients to adjuvant chemoradiotherapy, the influence of surgery, post-operative complications, concurrent illnesses (e.g. infections), and selective attrition that will add to the complexity of interpreting such studies.
Although there were no statistically significant differences between the four patient groups (see Supporting Information, Table S1) and entire cohort, it is possible that more subtle variations within the groups influenced some of the results. Gender or differences in underlying tumour type, site, or stage may influence progression of cachexia and potentially, levels of the biomarkers assessed. In the current study, subdivision of patients into these categories resulted in numbers too small for meaningful analysis with, for example, only one or two female non-cachectic pancreatic cancer patients in some biomarkers. Whilst the impact of such factors has not been thoroughly investigated to date, in the future, a more conclusive identification of biomarkers would probably require a more complete set of markers for one type of cancer and gender division from the outset.
The potential biomarkers of cachexia in the current study were selected from evidence relating predominantly to muscle wasting in animal models. The lack of association of biomarkers with cachexia may therefore simply reflect differences between animal and human cancer cachexia. Whereas the majority of animal models of cachexia undergoes rapid and profound weight-loss, human cancer cachexia is a chronic disease process. Furthermore, in humans, there will be added confounding factors such as level of baseline physical activity, bed rest, the presence of co-morbidities, dietary preferences, personal motivation, and sickness behaviour.
The majority of potential biomarkers that was evaluated related to protein degradation rather than synthetic pathways. There is reasonable evidence to suggest that in muscle atrophy associated with ageing/bed-rest, suppression of protein synthesis is of greater importance than increased degradation.31 Furthermore, in patients with UGIC, our group recently found evidence of suppression of muscle protein turnover.25 It may be that future studies investigating biomarkers selected from anabolic pathways may identify candidates that relate more strongly to cachexia. Alternatively, changes in muscle at the molecular level may not have a strong influence on muscle phenotype. Evidence of such dissociation has been demonstrated by Greenhaff et al.32 in the skeletal muscle of healthy men.32 Whether this also occurs in the context of human cancer cachexia remains to be elucidated.
In conclusion, many of the key components of known muscle wasting pathways do not transpose directly to being robust biomarkers of cachexia. Skeletal muscle Akt protein levels/phosphorylation status and GABARAPL1 expression are biomarkers relating to cancer and possibly early cachexia. β-Dystroglycan is a biomarker of weight-loss in cancer patients and MyHC and dystrophin are biomarkers associated with survival. This study highlights the complexity of biomarker research and provides impetus for further validation and discovery studies in order to identify robust diagnostic biomarkers and potential therapeutic targets in patients with cancer cachexia.
Acknowledgments
We are grateful to the consultant oesophagogastric (Mr S. Paterson-Brown, Mr A. C. de Beaux, Mr G. W. Couper, Ms A. Paisley, Mr P. Lamb, and Mr B. Tulloh) and hepatobiliary surgeons (Professor O. J. Garden, Professor S. J. Wigmore, Professor R. W. Parks, Mr R, Ravindran, Mr E. L. Hidalgo, Mr J. J. Powell, and Mr J. Casey) at the Royal Infirmary of Edinburgh for assistance with patient recruitment and muscle biopsies. We thank Professor Jamie Timmons for help with PCR methodology and primer design. The study complies with the ethical guidelines for authorship and publishing in the Journal of Cachexia, Sarcopenia and Muscle (von Haehling S, Morley JE, Coats AJS, Anker SD. Ethical guidelines for authorship and publishing in the Journal of Cachexia, Sarcopenia and Muscle. J Cachexia Sarcopenia Muscle, 2010; 1:7–8).
Funding
This project was supported financially by Cancer Research UK (grant number C1128/A7309).
Conflict of interest
None declared.
Supporting Information
Supporting Information is available at Journal of Cachexia, Sarcopenia and Muscle online (Figure S1. Visual representation of the overlap in patient groups for different biomarkers; Table S1. Individual cancer patient cohorts according to biomarkers evaluated).
Supporting info item
References
- Fearon K, Strasser F, Anker SD, Bosaeus I, Bruera E, Fainsinger RL, Jatoi A, Loprinzi C, MacDonald N, Mantovani G, Davis M, Muscaritoli M, Ottery F, Radbruch L, Ravasco P, Walsh D, Wilcock A, Kaasa S, Baracos VE. Definition and classification of cancer cachexia: an international consensus. Lancet Oncol. 2011;12:489–95. doi: 10.1016/S1470-2045(10)70218-7. [DOI] [PubMed] [Google Scholar]
- Tan BH, Ross JA, Kaasa S, Skorpen F, Fearon KC. Identification of possible genetic polymorphisms involved in cancer cachexia: a systematic review. J Genet. 2011;90:165–77. doi: 10.1007/s12041-011-0027-4. [DOI] [PubMed] [Google Scholar]
- Prado CM, Baracos VE, McCargar LJ, Mourtzakis M, Mulder KE, Reiman T, Butts CA, Scarfe AG, Sawyer MB. Body composition as an independent determinant of 5-fluorouracil-based chemotherapy toxicity. Clin Cancer Res. 2007;13:3264–8. doi: 10.1158/1078-0432.CCR-06-3067. [DOI] [PubMed] [Google Scholar]
- Stephens NA, Skipworth RJ, Fearon KC. Cachexia, survival and the acute phase response. Curr Opin Support Palliat Care. 2008;2:267–74. doi: 10.1097/SPC.0b013e3283186be2. [DOI] [PubMed] [Google Scholar]
- Deans DA, Tan BH, Wigmore SJ, Ross JA, de Beaux AC, Paterson-Brown S, Fearon KC. The influence of systemic inflammation, dietary intake and stage of disease on rate of weight loss in patients with gastro-oesophageal cancer. Br J Cancer. 2009;100:63–9. doi: 10.1038/sj.bjc.6604828. [DOI] [PMC free article] [PubMed] [Google Scholar]
- Lecker SH, Jagoe RT, Gilbert A, Gomes M, Baracos V, Bailey J, Price SR, Mitch WE, Goldberg AL. Multiple types of skeletal muscle atrophy involve a common program of changes in gene expression. FASEB J. 2004;18:39–51. doi: 10.1096/fj.03-0610com. [DOI] [PubMed] [Google Scholar]
- Acharyya S, Ladner KJ, Nelsen LL, Damrauer J, Reiser PJ, Swoap S, Guttridge DC. Cancer cachexia is regulated by selective targeting of skeletal muscle gene products. J Clin Invest. 2004;114:370–8. doi: 10.1172/JCI20174. [DOI] [PMC free article] [PubMed] [Google Scholar]
- Bodine SC, Latres E, Baumhueter S, Lai VK, Nunez L, Clarke BA, Poueymirou WT, Panaro FJ, Na E, Dharmarajan K, Pan ZQ, Valenzuela DM, DeChiara TM, Stitt TN, Yancopoulos GD, Glass DJ. Identification of ubiquitin ligases required for skeletal muscle atrophy. Science. 2001;294:1704–8. doi: 10.1126/science.1065874. [DOI] [PubMed] [Google Scholar]
- Zhao J, Brault JJ, Schild A, Goldberg AL. Coordinate activation of autophagy and the proteasome pathway by FOXO transcription factor. Autophagy. 2008;4:378–80. doi: 10.4161/auto.5633. [DOI] [PubMed] [Google Scholar]
- Clarke BA, Drujan D, Willis MS, Murphy LO, Corpina RA, Burova E, Rakhilin SV, Stitt TN, Patterson C, Latres E, Glass DJ. The E3 ligase MuRF1 degrades myosin heavy chain protein in dexamethasone-treated skeletal muscle. Cell Metab. 2007;6:376–85. doi: 10.1016/j.cmet.2007.09.009. [DOI] [PubMed] [Google Scholar]
- Skipworth RJ, Stewart GD, Bhana M, Christie J, Sturgeon CM, Guttridge DC, Cronshaw AD, Fearon KC, Ross JA. Mass spectrometric detection of candidate protein biomarkers of cancer cachexia in human urine. Int J Oncol. 2010;36:973–82. doi: 10.3892/ijo_00000577. [DOI] [PubMed] [Google Scholar]
- Felix K, Fakelman F, Hartmann D, Giese NA, Gaida MM, Schnolzer M, Flad T, Buchler MW, Werner J. Identification of serum proteins involved in pancreatic cancer cachexia. Life Sci. 2011;88:218–25. doi: 10.1016/j.lfs.2010.11.011. [DOI] [PubMed] [Google Scholar]
- Weber MA, Kinscherf R, Krakowski-Roosen H, Aulmann M, Renk H, Kunkele A, Edler L, Kauczor HU, Hildebrandt W. Myoglobin plasma level related to muscle mass and fiber composition: a clinical marker of muscle wasting? J Mol Med (Berl) 2007;85:887–96. doi: 10.1007/s00109-007-0220-3. [DOI] [PubMed] [Google Scholar]
- Stephens NA, Gallagher IJ, Rooyackers O, Skipworth RJ, Tan BH, Marstrand T, Ross JA, Guttridge DC, Lundell L, Fearon KC, Timmons JA. Using transcriptomics to identify and validate novel biomarkers of human skeletal muscle cancer cachexia. Genome Med. 2010;2:1. doi: 10.1186/gm122. [DOI] [PMC free article] [PubMed] [Google Scholar]
- Ransohoff DF. Cancer. Developing molecular biomarkers for cancer. Science. 2003;299:1679–80. doi: 10.1126/science.1083158. [DOI] [PubMed] [Google Scholar]
- Sandri M, Sandri C, Gilbert A, Skurk C, Calabria E, Picard A, Walsh K, Schiaffino S, Lecker SH, Goldberg AL. FOXO transcription factors induce the atrophy-related ubiquitin ligase atrogin-1 and cause skeletal muscle atrophy. Cell. 2004;117:399–412. doi: 10.1016/s0092-8674(04)00400-3. [DOI] [PMC free article] [PubMed] [Google Scholar]
- Bodine SC, Stitt TN, Gonzalez M, Kline WO, Stover GL, Bauerlein R, Zlotchenko E, Scrimgeour A, Lawrence JC, Glass DJ, Yancopoulos GD. Akt/mTOR pathway is a crucial regulator of skeletal muscle hypertrophy and can prevent muscle atrophy in vivo. Nat Cell Biol. 2001;3:1014–9. doi: 10.1038/ncb1101-1014. [DOI] [PubMed] [Google Scholar]
- Mammucari C, Milan G, Romanello V, Masiero E, Rudolf R, Del PP, Burden SJ, Di LR, Sandri C, Zhao J, Goldberg AL, Schiaffino S, Sandri M. FOXO3 controls autophagy in skeletal muscle in vivo. Cell Metab. 2007;6:458–71. doi: 10.1016/j.cmet.2007.11.001. [DOI] [PubMed] [Google Scholar]
- Mammucari C, Schiaffino S, Sandri M. Downstream of Akt: FOXO3 and mTOR in the regulation of autophagy in skeletal muscle. Autophagy. 2008;4:524–6. doi: 10.4161/auto.5905. [DOI] [PubMed] [Google Scholar]
- Acharyya S, Butchbach ME, Sahenk Z, Wang H, Saji M, Carathers M, Ringel MD, Skipworth RJ, Fearon KC, Hollingsworth MA, Muscarella P, Burghes AH, Rafael-Fortney JA, Guttridge DC. Dystrophin glycoprotein complex dysfunction: a regulatory link between muscular dystrophy and cancer cachexia. Cancer Cell. 2005;8:421–32. doi: 10.1016/j.ccr.2005.10.004. [DOI] [PubMed] [Google Scholar]
- Cohen S, Brault JJ, Gygi SP, Glass DJ, Valenzuela DM, Gartner C, Latres E, Goldberg AL. During muscle atrophy, thick, but not thin, filament components are degraded by MuRF1-dependent ubiquitylation. J Cell Biol. 2009;185:1083–95. doi: 10.1083/jcb.200901052. [DOI] [PMC free article] [PubMed] [Google Scholar]
- All Party Parliamentary Group On Cancer. 2009. Report of the All Party Parliamentary Group on Cancer's Inquiry into Inequalities in Cancer http://www.macmillan.org.uk/Documents/GetInvolved/Campaigns/APPG/BritainAgainstCancer2009/CancerInequalitiesReport.pdf Accessed 19 May 2014.
- Livak KJ, Schmittgen TD. Analysis of relative gene expression data using real-time quantitative PCR and the 2(−delta delta C(T)) method. Methods. 2001;25:402–8. doi: 10.1006/meth.2001.1262. [DOI] [PubMed] [Google Scholar]
- Schmitt TL, Martignoni ME, Bachmann J, Fechtner K, Friess H, Kinscherf R, Hildebrandt W. Activity of the Akt-dependent anabolic and catabolic pathways in muscle and liver samples in cancer-related cachexia. J Mol Med (Berl) 2007;85:647–54. doi: 10.1007/s00109-007-0177-2. [DOI] [PubMed] [Google Scholar]
- Gallagher IJ, Stephens NA, Macdonald AJ, Skipworth RJ, Husi H, Greig CA, Ross JA, Timmons JA, Fearon KC. Suppression of skeletal muscle turnover in cancer cachexia: evidence from the transcriptome in sequential human muscle biopsies. Clin Cancer Res. 2012;18:2817–27. doi: 10.1158/1078-0432.CCR-11-2133. [DOI] [PubMed] [Google Scholar]
- Doucet M, Russell AP, Leger B, Debigare R, Joanisse DR, Caron MA, LeBlanc P, Maltais F. Muscle atrophy and hypertrophy signaling in patients with chronic obstructive pulmonary disease. Am J Respir Crit Care Med. 2007;176:261–9. doi: 10.1164/rccm.200605-704OC. [DOI] [PubMed] [Google Scholar]
- Vogiatzis I, Simoes DC, Stratakos G, Kourepini E, Terzis G, Manta P, Athanasopoulos D, Roussos C, Wagner PD, Zakynthinos S. Effect of pulmonary rehabilitation on muscle remodelling in cachectic patients with COPD. Eur Respir J. 2010;36:301–10. doi: 10.1183/09031936.00112909. [DOI] [PubMed] [Google Scholar]
- Ljubicic V, Miura P, Burt M, Boudreault L, Khogali S, Lunde JA, Renaud JM, Jasmin BJ. Chronic AMPK activation evokes the slow, oxidative myogenic program and triggers beneficial adaptations in MDX mouse skeletal muscle. Hum Mol Genet. 2011;20:3478–93. doi: 10.1093/hmg/ddr265. [DOI] [PubMed] [Google Scholar]
- Lapidos KA, Kakkar R, McNally EM. The dystrophin glycoprotein complex: signaling strength and integrity for the sarcolemma. Circ Res. 2004;94:1023–31. doi: 10.1161/01.RES.0000126574.61061.25. [DOI] [PubMed] [Google Scholar]
- Cosper PF, Leinwand LA. Myosin heavy chain is not selectively decreased in murine cancer cachexia. Int J Cancer. 2012;130:2722–7. doi: 10.1002/ijc.26298. [DOI] [PMC free article] [PubMed] [Google Scholar]
- Rennie MJ, Selby A, Atherton P, Smith K, Kumar V, Glover EL, Philips SM. Facts, noise and wishful thinking: muscle protein turnover in aging and human disuse atrophy. Scand J Med Sci Sports. 2010;20:5–9. doi: 10.1111/j.1600-0838.2009.00967.x. [DOI] [PubMed] [Google Scholar]
- Greenhaff PL, Karagounis LG, Peirce N, Simpson EJ, Hazell M, Layfield R, Wackerhage H, Smith K, Atherton P, Selby A, Rennie MJ. Disassociation between the effects of amino acids and insulin on signaling, ubiquitin ligases, and protein turnover in human muscle. Am J Physiol Endocrinol Metab. 2008;295:E595–E604. doi: 10.1152/ajpendo.90411.2008. [DOI] [PMC free article] [PubMed] [Google Scholar]
Associated Data
This section collects any data citations, data availability statements, or supplementary materials included in this article.
Supplementary Materials
Supporting info item