

Abstract
Glioblastoma is a devastating disease, and there is an urgent need to develop novel therapies, such as oncolytic HSV1 (OV) to effectively target tumor cells. OV therapy depends on tumor-specific replication leading to destruction of neoplastic tissues. Host responses that curtail virus replication limit its efficacy in vivo. We have previously shown that cysteine-rich 61 protein (CCN1) activates a type 1 IFN antiviral defense response in glioblastoma cells. Incorporating TCGA data, we found CCN1 expression to be a negative prognostic factor for glioblastoma patients. Based on this, we used neutralizing antibodies against CCN1 to investigate its effect on OV therapy. Use of an anti-CCN1 antibody in mice bearing glioblastomas treated with OV led to enhanced virus expression along with reduced immune cell infiltration. OV-induced CCN1 increases macrophage migration toward infected glioblastoma cells by directly binding macrophages and also by enhancing the proinflammatory activation of macrophages inducing MCP-1 expression in glioblastoma cells. Activation of macrophages by CCN1 also increases viral clearance. Neutralization of integrin αMβ2 reversed CCN1-induced macrophage activation and migration, and reduced MCP-1 expression by glioblastoma cells. Our findings reveal that CCN1 plays a novel role in pathogen clearance; increasing macrophage infiltration and activation resulting in increased virus clearance in tumors.
Introduction
Despite aggressive multimodal therapy consisting of surgical resection and aggressive radiation and chemotherapy, glioblastoma remains a destructive cancer of the central nervous system, leaving patients with less than a 15-month median survival.1 Novel therapeutic options are therefore necessary to combat this disease. Oncolytic herpes simplex viruses (OV) depend on an initial infection followed by subsequent tumor cell lysis and represent a new biological therapy currently being evaluated in patients for safety and efficacy.2,3 Although efficacy has been shown in a laboratory setting, the innate immune response to virus infection presents a barrier to OV propagation in vivo, and hence reduces efficient tumor cell destruction.4,5 A significant infiltration of microglia/macrophages and natural killer cells to the tumor site has been shown to increase virus clearance, and their depletion enhances viral replication and oncolysis.6,7,8 Efforts to understand changes in the tumor microenvironment, which enhance these responses, will lead to a better understanding of how to attain the most of this promising therapeutic strategy.
Cysteine-rich 61 (CCN1) is a secreted protein primarily found within the extracellular matrix and known to be involved in angiogenesis.9,10,11 We have previously described the induction of CCN1 in the tumor microenvironment following OV therapy.12 More recent reports have also described its role in cell migration and inflammation.13,14,15 For example, CCN1 is upregulated during chronic states of inflammation, such as in patients with Crohn's disease and ulcerative colitis,16 and activates a proinflammatory genetic program in murine macrophages characteristic of the classically activated M1 phenotype.17 CCN1 induced by oncolytic virus infection also activates an intracellular type I interferon (IFN) response in glioblastoma cells leading to a reduction in viral replication.18 While these studies highlight its role in inflammation, it is not known if CCN1 plays a role in immune cell-mediated pathogen clearance.
We examined The Cancer Genome Atlas (TCGA) caIntegrator for CCN1 mRNA expression in glioblastoma, and found that patients with low levels of CCN1 have a significantly better survival outcome than patients with high levels of CCN1 suggesting that its neutralization may have a therapeutic advantage. Given the implication of CCN1 as a significant player in inflammation, here we examined its role in macrophage-mediated OV clearance, and the potential to use anti-CCN1 neutralizing antibodies to investigate the impact of CCN1 on OV therapeutic outcome.
Results
CCN1 expression is significantly associated with glioblastoma patient survival
In order to identify a clear correlation between glioblastoma patient survival and the role of CCN1, we compared CCN1 gene expression with the gene expression signatures of glioblastoma samples obtained from TCGA. At the time when we conducted this study, the TCGA data included 356 grade IV astrocytoma patient (glioblastoma) samples. CCN1 mRNA expression data were obtained from TCGA through Agilent (caintegrator.nci.nih.gov). Samples were divided into low (≤1.0E-5), intermediate, and high (≥0.62) mRNA expression levels, and the expression was correlated with respective patient survival data using Kaplan-Meier statistical analysis. Figure 1a shows that patients with low CCN1 gene expression had a statistically significant increase in their median survival compared to patients with high CCN1 expression.
Figure 1.

Impact of CCN1 on GBM and OV propagation. (a) CCN1 mRNA expression data for 356 grade IV astrocytomas were obtained from TCGA project through Agilent (caintegrator.nci.nih.gov). Samples were divided into low (blue line: Cyr61<1.0E-5 (195 patients)), intermediate (red line: (79 patients)), and high (green line: Cyr61>0.62 (82 patients)) mRNA expression levels, and expression was correlated with respective patient survival data using Kaplan-Meier statistical analysis. (Data queried on 16 July 2013). (b,c) Quantification (b) and representative images (c) of virus encoded luciferase in tumor bearing mice treated with or without CCN1 blocking antibody. Briefly, athymic nude mice bearing subcutaneous tumors were randomized when their tumors reached an average volume of 200 mm3 (day 1). Mice were then treated intraperitoneally with either IgG or anti-CCN1 antibody (50 μg/mouse/day given daily for 5 days on days 1–5) and then treated with 1 × 10⁶ pfu of rHSVQ-IE4/5-Luc by direct intratumoral injection on day 3 after start of antibody treatment. Bioluminescence imaging was performed on day 2 following OV therapy. Quantification of bioluminescence signal intensity of each region of interest (ROI) is shown in b, n = 5 mice/group. **P < 0.01 (d) Western blot analysis of CCN1 levels in blood plasma taken from mice treated with either IgG or anti-CCN1 antibodies. Samples were equally loaded with 10ug of protein as determined by standard BCA and verified by coomassie staining. (e,f) Representative images of OV treated tumor sections from mice treated with IgG or anti-CCN1 as described above on day 6, after initiation of antibody treatment, shown at 10× (top) and 20× (bottom) and immunostained for HSV-1 (e) and CD68 (f). (g) Representative images of OV treated tumor sections from mice treated with IgG or anti-CCN1 as described above on day 6, after initiation of antibody treatment, shown at 20x and immunofluorescence stained for NKp46 (NKp46+ NK cells (red), GFP+ oHSV-infected cells (green), and nuclei staining (blue)).
CCN1 neutralization reduces effector cell infiltration toward oncolytic HSV-1-infected tumors in vivo
We have previously shown that high levels of CCN1 reduced OV propagation in vitro and in vivo.18 As the TCGA data show that higher CCN1 levels correlate with a poor prognosis, it suggests that countering CCN1 expression may have a therapeutic advantage. Therefore, we next investigated the effect of CCN1 neutralization on OV therapy. Mice bearing subcutaneous tumors were treated with a neutralizing anti-CCN1 antibody or control IgG serum and then injected intratumorally with the oncolytic virus rHsvQ1-IE4/5-Luc, and virus-encoded luciferase was monitored by bioluminescence imaging. Increased levels of virus-encoded luciferase were apparent in all mice treated with anti-CCN1 antibodies (Figure 1b,c). Reduction in serum levels of CCN1 in mice treated with anti-CCN1 antibody was verified by western blot analysis (Figure 1d). To assess the impact of CCN1 on immune cell infiltrates into the tumor, sections were stained for macrophages, NK cells, and neutrophils. Figure 1e-g and Supplementary Figure S1 show HSV-1 immunostaining (Figure 1e), CD68 immunostaining (Figure 1f), NKp46 immunofluorescence (Figure 1g), and MPO immunofluorescence (Supplementary Figure S1b) in tumor sections from OV-treated mice in the presence or absence of anti-CCN1 antibody. Interestingly, we found reduced staining for CD68 (monocyte and macrophage cells) and NKp46 (NK cells) in mice treated with anti-CCN1 antibody, indicating that the increased virus propagation observed after the inhibition of CCN1 in vivo is associated with a reduction in macrophage and NK cell infiltration following OV therapy (Figure 1f,g). However, we did not find any significant effect of CCN1 inhibition on neutrophil infiltration (Supplementary Figure S1b).
CCN1 directly affects macrophage migration by binding integrin αMβ2in vitro
CCN1 is a secreted ECM molecule that has been shown to effect cellular adhesion of murine macrophages and monocytes.19,20 To determine if CCN1 has a direct effect on the migration of monocytes and macrophages in the absence of infected glioblastoma cells, we measured the migration of RAW264.7 murine macrophages and human monocytic THP-1 cells through transwells coated with either purified CCN1 protein or control BSA. Quantification of migrated cells revealed a significant increase in the migration of both macrophages and monocytic cells in the presence of CCN1 (Figure 2a,b).
Figure 2.

CCN1 protein increases migration of macrophages and monocytes. Quantification of migrated RAW264.7 macrophages (a) and THP-1 monocytic cells (b) in response to purified CCN1 was determined using a modified Boyden Transwell assay coated with purified CCN1 or BSA. Serum starved RAW264.7 or THP-1 cells were plated in the upper chamber of transwells and allowed to migrate for 6 hours. Following this migration period, nonadherent THP-1 cells which migrated through were counted by hemocytometer while adherent macrophages which migrated through were counted following the fixing and staining of transwell membranes. Data shown are mean number of migrated cells from three independent transwells, quantified as average number of migrated THP-1 cells as determined by hemocytometer and average number of migrated cells/20× view field for RAW264.7.
To directly test if OV-induced CCN1 is involved in macrophage migration toward OV-infected glioblastoma cells, we measured the chemotaxis of RAW264.7 macrophage cells in vitro toward uninfected or infected cancer cells. Using a modified Boyden Transwell assay, we plated RAW264.7 macrophages in the top chamber and measured their migration toward infected LN229 glioblastoma cells plated in the bottom chamber. Figure 3a shows the experimental setup used. Consistent with the previous observations of increased macrophage infiltration in tumors treated with the oncolytic virus rHSVQ1,21,22 we found a significant increase in macrophage migration toward infected LN229 and U251T3 glioblastoma cells compared with uninfected cells at multiple MOIs in vitro (Figure 3b,c; Supplementary Figure S2). To assess the effect of endogenously upregulated CCN1 on macrophage migration, we measured the impact of using neutralizing anti-CCN1 antibodies on macrophage migration toward infected glioblastoma cells in vitro. CCN1 neutralization effectively rescued the increased migration of macrophages toward infected cells indicating a significant role for OV-induced CCN1 in macrophage migration toward OV-infected glioblastoma cells (Figure 3b,c; Supplementary Figure S2).
Figure 3.

CCN1 increase in macrophage migration toward infected glioblastoma cells is mediated by its interaction with integrin αMβ2. (a) Schematic of basic experimental set-up using modified Boyden Transwell chambers. Macrophages treated with control IgG or anti-CCN1 antibody were placed in the top chamber, while glioblastoma cells treated with/without OV (rHSVQ, MOI = 3) were placed in the bottom chamber. Migration of macrophages toward glioblastoma cells was measured by counting the number of cells that migrated to the bottom side of the transwell membrane 6 hours later. (b,c) Quantification of migrated RAW264.7 macrophages toward LN229 (b) and U251T3 (c) glioblastoma cells, average of five view-fields per assay. (d) Quantification of migrated RAW264.7 cells toward rHSVQ1 infected LN229 glioblastoma cells (MOI = 3) incubated with control IgG or function-neutralizing antibodies against murine integrins αM, β2, αv, β3, or β5 averaging five view-fields per assay. Values are presented as mean +/- SEM of at least three replicates and represent at least three independent experiments. n.s.: not significant *P < 0.05, **P < 0.01, ***P < 0.001
To identify the receptor responsible for macrophage chemotaxis toward OV infected glioblastoma cells, using a modified Boyden Transwell assay as depicted in Figure 3a, we measured the migration of macrophages toward infected glioblastoma cells in the presence or absence of neutralizing antibodies against murine macrophage integrins αMβ2, αvβ3, and αvβ5. We found that treatment of macrophages with blocking antibodies against integrins αM and β2 reduced the increased migration of macrophages toward infected glioblastoma cells (Figure 3d).
CCN1 increases MCP-1 and MCP-3 gene expression in infected glioblastoma cells cocultured with macrophages independently of its interaction with integrin α6
We have previously shown that CCN1 activates a type I IFN signaling response in infected glioblastoma cells.18 IFNα/β are known to be involved in the induction of macrophage chemotactic factors,23 and so we next investigated if apart from directly increasing macrophage chemotaxis, CCN1 also induced the secretion of macrophage attracting chemokines in infected glioblastoma cells. Chemokines, such as monocyte chemotactic proteins 1 and 3 (MCP-1 and MCP-3), regulate monocyte trafficking and play a key role in orchestrating the host defense response to HSV-1 infection.24 Using modified Boyden Transwell chambers as depicted in Figure 3a, we cultured glioblastoma cells at the bottom with macrophages at the top. We then infected the glioblastoma cells in the presence or absence of IgG or anti-CCN1 antibodies. Using real time quantitative PCR, we measured changes in gene expression in the glioblastoma cells. A significant induction of MCP-1 and MCP-3 was observed in human glioblastoma cells infected with OV compared to control (Figure 4a,b; Supplementary Figure S3a). Importantly, MCP-1 and MCP-3 induction by OV was reduced with the addition of a neutralizing CCN1 antibody, indicating a significant role for CCN1 in the induction of these chemokines in glioblastoma cells (Figure 4a,b). We have previously shown that CCN1 binds to integrin α6β1 on glioblastoma cells to activate an innate intracellular type 1 IFN antiviral defense response.18 To test if the induction of MCP-1 and MCP-3 by glioblastoma cells involved CCN1 binding and activating integrin α6β1 on glioblastoma cells, we knocked down integrin α6 gene expression in glioblastoma cells using a lentivirus, which delivers shRNA directed against integrin α6.25 Western blot analysis of cell lysates from LN229 glioblastoma cells infected with a control or lentivirus expressing shRNA directed against integrin α6 (α6-/-) revealed efficient knock down of integrin α6 in these cells (Figure 4c). Consistent with our previous results, infection of α6-/- glioblastoma cells with OV led to a reduction in the infection-induced type I IFN response in these cells compared to control, and also increased the viral transgene expression of luciferase (Figure 4d,e). We then measured changes in MCP-1 and MCP-3 in wild type and α6-/- glioblastoma cells after infection with rHSVQ-IE4/5-Luc. A similar induction of MCP-1 and MCP-3 was observed in control and α6-/- glioblastoma cells after infection indicating that the induction of these chemokines in glioblastoma cells was independent of CCN1's binding to integrin α6β1 (Figure 4f).
Figure 4.

CCN1 increases MCP-1 and MCP-3 gene expression in glioblastoma cells independently of its interaction with integrin α6. (a,b) Induction of MCP-1 and MCP-3 in human glioblastoma cells. Real time quantitative PCR analysis of MCP-1 and MCP-3 gene expression in LN229 glioblastoma cells co-cultured with macrophages separated by a transwell chamber in the presence of anti-CCN1 antibodies or control IgG serum 12 hours following infection with rHSVQ1 (MOI = 3). (c) Western blotting analysis of integrin α6 in LN229 glioblastoma cells following lentiviral infection with a non-target construct (control) and an integrin α6 knock down (α6-/-) shRNA construct. (d) Real time PCR analysis for IFNα and IFNβ gene expression in control (control) and integrin α6 knocked down (α6-/-) LN229 glioblastoma cells. (e) Control or α6-/- LN229 cells were infected with rHSVQ-IE4/5-Luc at the indicated MOI for 24 hours. Virally expressed luciferase activity was measured and is shown as luciferase/mg protein. (n.d indicates not detectable in uninfected cells). (f) Real time PCR analysis of MCP-1 and MCP-3 gene expression in infected control and α6-/- LN229 glioblastoma cells co-cultured with macrophages separated by a transwell chamber. Data shown are the fold change gene expression of infected/uninfected cells relative to endogenous GAPDH. Error bars are standard error of the mean of at least three replicates and represent at least three independent experiments. ns = not significant, nd = not detectable, *P < 0.05, **P < 0.01, ***P < 0.001.
CCN1 induces a proinflammatory activation of macrophages by binding macrophage integrin αMβ2 resulting in the paracrine induction of MCP-1 in glioblastoma cells
Macrophages are known to establish a paracrine communication with target cells through secreted factors.26 Therefore, we next tested if macrophage-secreted factors played a role in the induction of MCP-1 and MCP-3 by infected glioblastoma cells. To address this, we measured changes in MCP-1 and MCP-3 gene expression in glioblastoma cells when cultured alone or in the presence of RAW264.7 macrophages separated by a transwell. A small but significant increase in MCP-1 gene expression was observed in LN229 glioblastoma cells following infection in the absence of macrophages (Figure 5a). However, when glioblastoma cells (LN229 and U251T3) were cultured in the presence of macrophages, we found a substantial increase in glioblastoma cell-produced MCP-1 gene expression following infection, revealing the existence of a two-way cellular communication between infected glioblastoma cells and macrophages (Figure 5a; Supplementary Figure S3a). As the increased induction of MCP-1 was observed in the absence of direct macrophage contact with infected glioblastoma cells, it suggested the role of soluble factors. Therefore, we next examined the role of CCN1 in macrophage cytokine induction. Using quantitative real time PCR, we measured changes in macrophage-specific inflammatory cytokines when macrophages were cultured in the presence of infected control LN229 glioblastoma cells or infected glioblastoma cells highly expressing CCN1. A significant induction of interleukin 1β (IL-1β), IFNγ, MCP-1, MCP-3, and interferon gamma-induced protein 10 (IP-10) was observed in macrophages cultured with glioblastoma cells highly expressing CCN1 (Figure 5b). Importantly, the chemokines IL-1β and IFNγ have been shown to be the inducers of MCP-1 gene expression,27,28,29 and induction of macrophage IL-1β and IFNγ was also observed when infected U251T3 cells were cultured with RAW264.7 cells (Supplementary Figure S3b).
Figure 5.
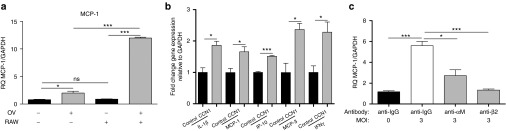
CCN1 induces a proinflammatory activation of macrophages by binding macrophage integrin αMβ2 resulting in the paracrine induction of MCP-1 in glioblastoma cells. (a) Real time quantitative PCR analysis of MCP-1 gene expression in LN229 glioblastoma cells either uninfected or infected at an MOI = 3 in the presence or absence of RAW264.7 macrophages separated by a transwell. (b) Real time quantitative PCR analysis of IL-1β, MCP-1, IP10, MCP-3, and IFNγ gene expression in murine macrophages cocultured with CCN1 expressing glioblastoma cells or control glioblastoma cells following a 30-minute infection of glioblastoma cells with rHSVQ1 at MOI = 3. Cells were harvested 12 hours following infection. (c) Real time quantitative PCR analysis of MCP-1 gene expression in LN229 glioblastoma cells cocultured with RAW264.7 macrophages in the presence of inhibitory antibodies against integrins αM and β2 or control IgG. Data shown are the mean target gene expression relative to endogenous GAPDH and values are presented as mean ± SEM of at least three replicates and represent at least three independent experiments. ns, not significant, *P < 0.05, ***P < 0.001.
We have shown the importance of integrin αMβ2 in CCN1-induced macrophage chemotaxis toward infected glioblastoma cells (Figure 3d). To address the role of CCN1 in the macrophage-mediated induction of glioblastoma MCP-1, we evaluated the significance of this receptor in the cross-talk between macrophages and infected glioblastoma cells. Consistent with the reduction in macrophage migration (Figure 3d), blocking antibodies against the macrophage integrin receptor αMβ2 resulted in a significant reduction in MCP-1 gene expression by LN229 glioblastoma cells (Figure 5c). Collectively, the results from these experiments indicate that the interaction between CCN1 and integrin αMβ2 on the macrophage cell surface plays a significant role in initiating a cross talk between infected glioblastoma cells and macrophages. Interestingly, while MCP-3 expression was also induced in glioblastoma cells following OV infection its induction in infected cells was not altered in the presence or absence of macrophages (Supplementary Figure S4a). Additionally, we found no significant effect of macrophage αMβ2 receptor neutralization on MCP-3 expression suggesting the role of additional pathways in the induction of glioblastoma cell MCP-3 (Supplementary Figure S4b).
CCN1 increases macrophage-mediated viral clearance
The results presented thus far reveal that CCN1 produced in the tumor microenvironment increases macrophage chemotaxis and activation through its interaction with integrin αMβ2 on the macrophage cell surface. Next, we investigated the effect of CCN1-induced macrophage activation on macrophage-mediated viral clearance. Coculturing macrophages with infected glioblastoma cells at decreasing target:effector ratios resulted in a dose-dependent reduction in viral ICP4 gene copy, indicating a significant role for macrophages in virus clearance (Figure 6a). To investigate the role of CCN1 in this effect, we cocultured infected glioblastoma cells with macrophages treated with control or anti-CCN1 blocking antibodies and measured viral ICP4 gene copy. Figure 6b shows that treatment of macrophages with an anti-CCN1 antibody resulted in a partial rescue of the macrophage-mediated virus clearance. Next, we investigated if the interaction between CCN1 and integrin αMβ2 on the macrophage cell surface played a role in this effect. Treatment of macrophages with neutralizing antibodies against integrin αMβ2 prior to culturing with infected glioblastoma cells, revealed a significant reversal in the macrophage-mediated virus clearance (Figure 6c).
Figure 6.
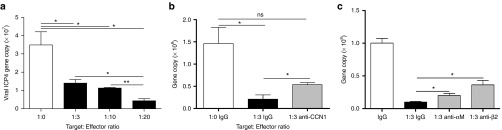
CCN1 increases macrophage-mediated viral clearance by binding integrin αMβ2. (a) Quantification of viral gene expression in LN229 cells cocultured in direct contact with macrophages at the indicated effector:target ratios for 12 hours. HSV-1 ICP4 viral gene copy was quantified by real time quantitative PCR. (b) LN229 glioblastoma cells were infected with rHSVQ1 at MOI = 3 for 20 minutes. RAW264.7 macrophages, in the presence of anti-CCN1 antibodies or control IgG serum, were overlayed for 12 hours and HSV-1 ICP4 viral gene copy was quantified by real time quantitative PCR. (c) LN229 glioblastoma cells were infected with rHSVQ1 at MOI = 3 for 20 minutes. RAW264.7 macrophages, in the presence of control IgG or neutralizing anti-αM or anti-β2 antibodies, were overlayed for 12 hours and HSV-1 ICP4 viral gene copy was quantified by real time quantitative PCR. Values are presented as mean ± SEM of at least three replicates and represent at least three independent experiments. ns, not significant, *P < 0.05, **P < 0.01.
Effect of CCN1 on OV therapy in vivo
Given the role of CCN1 in both macrophage activation and virus clearance, we sought to investigate the antitumor effect of CCN1 neutralization on OV therapeutic outcome. Mice bearing subcutaneous glioblastoma tumors were treated with a neutralizing anti-CCN1 antibody9 or control IgG serum and then injected intratumorally with the oncolytic virus rHsvQ1-IE4/5-Luc (Supplementary Figure S5a). Supplementary Figure S5b,c shows the individual antitumor response of each mouse treated with control IgG or anti-CCN1 blocking antibody. Each mouse was carefully evaluated for changes in tumor volume; an increase in tumor volume by 20% from the minimal tumor volume after treatment was defined as progressive disease and the time from virus treatment to time of progressive disease was defined as time to progression. One mouse each in both IgG and anti-CCN1 treated groups of animals showed a complete response with no evidence of tumor growth by day 63. Of the other five IgG-treated tumors, three mice showed no evidence of tumor volume reduction after virus treatment and were classified to have progressive disease on days 3, 7, and 17 after virus treatment, and two mice showed a partial response but progressed by days 13 and 23 (Supplementary Figure S5b). Of the other five mice treated with anti-CCN1 antibody, all showed a partial response or stable disease but then progressed by days 13, 17, 28, 48, and 56 after virus inoculation (Supplementary Figure S5c). While the study was not powered to analyze overall survival, we measured the time to progression (as defined by an increase in tumor volume by 20% from the minimal tumor volume after treatment). Post-OV therapy, among the mice that progressed in each group, there was a trend toward improvement in median time to progression for animals treated with anti-CCN1 antibody compared to control (Supplementary Figure S5d).
Collectively, the results from this study indicate that increased CCN1 expression in the tumor microenvironment following OV therapy enhances effector cell infiltration to the tumor bed, increases macrophage classical proinflammatory activation, and also increases macrophage-mediated viral clearance. The correlation between CCN1 expression and reduced patient survival along with a trend toward reduced median time to progression for mice treated with anti-CCN1 antibody warrants further investigation into CCN1 neutralization as an adjunct to OV therapy.
Discussion
Oncolytic viral therapy is currently being evaluated in several clinical trials, and efforts to better understand host responses are essential to get the most out of this therapy. We have previously shown a rapid and dose-dependent induction of CCN1 in the glioblastoma microenvironment following OV infection.12 Increased levels of CCN1 induced by OV can then bind to integrin α6β1 on glioblastoma cells and activate the innate intracellular antiviral type I IFN responsive pathway resulting in reduced virus replication in vitro and in vivo.18 In this study, we examined the relationship between CCN1 neutralization and OV therapeutic outcome, specifically investigating the effect of CCN1 on macrophage-mediated virus clearance in vitro and in vivo. It has been shown that CCN1 is upregulated in glioblastoma and correlated with tumor grade.30,31 Here, we used the TCGA database to show that low levels of CCN1 predict better glioblastoma patient survival, and then investigated the use of blocking CCN1 using neutralizing antibodies to augment OV therapy. CCN1 neutralization resulted in a significant reduction in virus clearance correlating with a reduction in macrophage and NK cell infiltration observed in response to virus infection in vivo. Further examining the role of CCN1 and macrophage infiltration, we show that OV-induced CCN1 increased chemo-taxis of macrophages toward virus-infected cells by directly stimulating their migration through binding integrin αMβ2. Additionally, we show that the proinflammatory activation of macrophages by CCN1 also causes the secretion of factors, such as IFN-γ and IL1-β resulting in the induction of glioblastoma cell production of MCP-1, which can further increase macrophage chemotaxis. While activation of macrophages may lead to a more robust macrophage-mediated infected glioblastoma cell killing, our in vivo data show a trend toward improved antitumor response of OV-treated tumors in mice treated with anti-CCN1 blocking antibodies. To our knowledge, this is the first study showing CCN1 can enhance the innate macrophage-mediated antiviral immune response playing a key role in orchestrating the destruction and clearance of disease causing pathogens in the body.
CCN1 is a secreted extracellular matrix protein well known as an angiogenic inducer. While it has been shown to be involved in migration of various cancer cells, its role in modulating immune responses is just beginning to be explored. Recently, Bai et al identified CCN1 as a regulator of proinflammatory gene expression in murine macrophages.17 In that report, treatment of macrophages with purified CCN1 for 1, 6, and 24 hours resulted in enhanced inflammatory gene expression, with expression peaking at 6 hours. In addition, it has been shown that CCN1 protein and over-expression of CCN1 in the liver contributes to a more severe hepatic inflammation and increases macrophage infiltrates.14 Here, we examined the impact of secreted endogenous CCN1 on macrophage function in the context of OV therapy for glioblastoma. Our study shows that increased production and secretion of CCN1 in the tumor microenvironment enhances macrophage activation and migration toward the site of inflammation by the direct interaction between CCN1 and integrin αMβ2 on the macrophage cell surface.
While the ability for CCN1 to directly induce MCP-1 gene expression has been reported in endothelial progenitor cells and CD34+ progenitor cells,32 here we show that OV-induced CCN1 acts on macrophages through integrin αMβ2 enhancing their migration and also their proinflammatory activation. Activated macrophages in turn signal glioblastoma cells to secrete MCP-1 further enabling macrophage chemotaxis toward the site of infection. MCP-1 is a major player in the regulation of leukocyte trafficking and plays a key role in orchestrating the host defense response to HSV-1 infection.33 The activation and induced migration of macrophages by CCN1 ultimately results in reduced viral oncolysis of infected glioblastoma cells.
One of the first lines of defense in the innate antiviral immune response to HSV-1 infection is the infiltration of effector cells such as macrophages, NK cells, and neutrophils. It is interesting to note that while we show a significant role for CCN1 in the infiltration of macrophages and NK cells toward infected glioblastoma cells, we did not see an effect of CCN1 on neutrophil infiltration. While CCN1 is a known ligand for both macrophages and NK cells,13,14 its ability to bind neutrophils is yet unknown and our results suggest that it may not play a role in neutrophil chemotaxis toward HSV-1 infected brain tumors in vivo.
Interestingly, a recent study shows CCN1 expression in animal models of cardiomyopathy led to a reduction in disease severity due to the suppression of cardiac immune cell infiltration, while having no effect on chemokine or cytokine secretion.34 Consistent with this, another study also showed that prolonged exposure to CCN1 may result in a negative feedback mechanism leading to the suppression of immune cell migration.13 Thus, it is interesting to speculate that although our study indicates that short-term exposure to CCN1 induced after OV infection increases immune effector cell infiltration resulting in increased virus clearance, prolonged expression may attenuate the development of a beneficial antitumor immune response in the aftermath of oncolytic virus tumor destruction. Our results here show a trend toward the overall increase in median time to progression for OV treated animals given anti-CCN1 antibody compared to IgG. While treatment with the antibody did increase virus propagation in vivo, future studies in immune competent animal models will delineate the impact of anti-CCN1 antibody on antitumor immune responses and overall antitumor efficacy of OV therapy.
Materials and Methods
Cells and viruses. Human LN229, U251T2, U251T3, and Cy-1 glioblastoma cell lines were maintained in Dulbecco's modified minimal essential medium (DMEM) supplemented with 2% fetal bovine serum, 100 U/ml penicillin, and 100 µg/ml streptomycin. Mouse RAW264.7 macrophages and human THP-1 monocytes were maintained in RPMI medium supplemented with 5% fetal bovine serum, 100 U/ml penicillin, and 100 µg/ml streptomycin. We used rHSVQ1 and rHSVQ1-IE4/5-Luc, HSV-1-derived recombinant oncolytic viruses, which are disrupted in the UL39 locus and deleted for both copies of the γ34.5 gene; rHSVQ1-IE4/5-Luc also contains the luciferase transgene under the HSV-1 IE4/5 promoter.35 Viral stocks were generated in Vero African green monkey kidney cells (American Type Culture Collection, Manassas, VA) as previously described.36
Animals. All animal experiments were performed in accordance with the Subcommittee on Research Animal Care of The Ohio State University guidelines. Six- to eight-week-old female athymic nu/nu mice (Charles River Laboratories, Frederick, MD) were used for all tumor studies. Survival study: Mice were anesthetized and injected into the rear right flank with 1.5 × 10⁷ U251T3 glioblastoma cells. When tumors reached an average size of 200 mm3, mice were injected intraperitoneally with control antirabbit IgG or anti-CCN1 antibody (50 µg/mouse) for 5 days. On the third day, mice were injected intratumorally with rHSVQ1-IE4/5-Luc at 1 × 10⁵ pfu. Tumor volume was calculated using the following formula: volume = 0.5 LW2 as described.37 Immunohistochemistry: Mice were anesthetized and injected into the rear right flank with 1.5 × 10⁷ U251T3 glioblastoma cells. When tumors reached an average size of 200 mm3 mice were injected intraperitoneally with control antirabbit IgG or anti-CCN1 antibody (50 µg/mouse) for 5 days. On the third day, mice were injected intratumorally with rHSVQ1-IE4/5-Luc at 1 × 10⁶. On day 6, tumors were excised, fixed in 4% paraformaldehyde, and dehydrated in 30% sucrose.
Antibodies and reagents. Reagents used in this study were obtained from the following sources: Pure recombinant CCN1 protein (Cell Sciences, Canton, MA) and d-Luciferin (Caliper Life Sciences, Hopkinton, MA). Integrin α6 knock down was achieved using lentiviral shRNA construct (α6-/-) and compared to a nontargeting control (control) as previously described.38 Antibodies were obtained from the following sources: For in vivo imaging: Rabbit IgG & rabbit polyclonal antihuman CCN19 (Santa Cruz, Santa Cruz, CA); for function-inhibition assays: anti-CCN1 (Novus Biologicals, Littleton, CO), [M1/70] anti-CD11b (Abcam, Cambridge, MA), rat antimouse integrin αv, (Millipore, Billerica, MA), rat antimouse integrin β2 (BD Pharmigen, San Jose, CA), hamster antimouse integrin β3 (AbD Serotec, Raleigh, NC), antiintegrin β5 (eBioscience, San Diego, CA), antihuman integrin αvβ3 (Millipore), antihuman integrin αvβ5 (eBioscience); for western blotting: antiintegrin α6 & anti-GAPDH (Abcam), Amersham ECL antimouse IgG HRP (GE Healthcare, Pataskala, OH), poly-clonal goat antirabbit IgG (Dako, Carpenteria, CA), antihuman Cyr61/CCN1 (R&D, Minneapolis, MN); for immunohistochemistry: polyclonal rabbit antiherpes simplex virus 1 (Dako, Carpenteria, CA), rat antimouse CD68 (AbD Serotec), peroxidase conjugated donkey antirabbit & biotin-conjugated goat antirat (Jackson ImmunoResearch Laboratories, West Grove, PA), goat antimouse NKp46 (Santa Cruz), anti-MPO antibody (R&D), donkey antigoat AF594 (Invitrogen, Grand Island, NY).
Cell migration assay. Cell migration of RAW264.7 murine macrophages and THP-1 human monocytes was evaluated using a 24-well chemotaxis chamber equipped with a polycarbonate filter with 5 µm pores (Costar, Corning, NY). For the direct effect of CCN1 on migration, transwells were coated with CCN1 protein or BSA. Serum-starved cells were plated in the upper chamber and left to migrate for 6 hours. For THP-1 (nonadherent) cells that traversed the membrane were counted by hemocytometer. For RAW264.7 cells, following incubation, cells that traversed the membrane were fixed and stained with crystal violet; nonmigrated cells were removed with a cotton-tipped applicator. Cells were quantified by averaging the cell count of five different view fields at ×20 magnification from atleast three independent transwells. For CCN1 inhibition experiments, LN229 or U251T2 glioblastoma cells were plated in the bottom chamber and infected for 30 minutes at an MOI of 1, 2, or 3. Cells were incubated for 4 hours after which serum starved RAW264.7 cells were plated in the top chamber in the presence of IgG, or one of the neutralizing antibodies, and left to migrate for 6 hours. Migrated RAW264.7 cells which traversed the membrane were fixed and stained with crystal violet, non-migrated cells which remained in the top chamber were removed with a cotton-tipped applicator. Cells were quantified by counting five different view fields at ×20 magnification which were then averaged.
Real-time PCR. Cells were harvested with 0.5% trypsin-EDTA, centrifuged for 5 minutes at 2,000 rpm, and cell pellets frozen. Cell pellets were homogenized using a QIAshredder (Qiagen, Valencia, CA) and RNA was isolated using RNeasy Mini Kit (Qiagen). Real time continuous detection of PCR product was achieved using Sybr Green (Applied Biosystems, Carlsbad, CA). GAPDH was used as an internal control with relative quantification being expressed as a ratio of the difference in the number of cycles needed for expression of a gene. To measure viral gene copy LN229 glioblastoma cells were infected for 30 minutes, unbound virus washed out and then media was replaced with media containing macrophages preincubated with IgG or one of the various function-blocking antibodies. Total DNA from the cocultures was purified using DNeasy Blood and Tissue Kit (Qiagen) per manufacturer's instruction. Viral gene copy present in the cocultures was measured by determining the total number of copies of the HSV-specific ICP4 gene using quantitative real-time PCR analysis. Total HSV gene copy was determined by generating a linear regression curve using a plasmid containing ICP4 of HSV-1 viral gene (kindly provided by Dr Deborah Parris, The Ohio State University, Columbus, OH). Primers were designed using the Primer Express Program (Applied Biosystems) (Supplementary Table S1).
IVIS imaging. For the in vivo experiments, on day 5 following antibody administration (2 days post-OV injection) mice were given a single intraperitoneal injection (100 µl, 25 mg/ml) of d-Luciferin (Caliper Life Sciences, Hopkington, MA) in PBS. Approximately 5 minutes postinjection, mice were anaesthetized using isofluorane and placed in the imaging chamber of a Xenogen IVIS 100 (Xenogen, Alameda, CA) in the Department of Veterinary Sciences, The Ohio State University. Images were acquired every 10 minutes following injection, and the peak luminescence was analyzed with the LivingImage software (Xenogen).
Western blot analysis. Immunoblots were performed on cell lysates (lysed in RIPA buffer: 150 mmol/l NaCl, 1% Nonidet P-40, 0.5% sodium deoxycholate, 0.1% SDS, 150 mmol/l Tris) from indicated cells. Equal amounts of protein were resolved on a 10% SDS-PAGE followed by transfer to PVDF membranes. Blots were probed for the indicated proteins using the appropriate antibodies and visualized by enhanced chemiluminescence (GE Health, Pataskala, OH). For albumin-depleted plasma samples, blood was collected in EDTA-coated tubes, and plasma was collected following a 10-minute centrifugation at 2000×g at 4 °C. Albumin was depleted using QProteome Albumin/IgG Depletion Kit (Qiagen) per manufacturer's instructions. Sample volume was normalized to 10 µg protein, using standard BCA (Thermo Scientific, Rockford, IL).
Luciferase assay. Cells were lysed in 1× cell lysis buffer (Promega, Madison, WI) and measured for luciferase activity using Luciferase Assay System (Promega) per manufacturer's protocol. Protein concentrations were determined using the BCA Protein Assay-Reducing Agent Compatible Kit (Pierce, Rockford, IL).
Statistical analysis. Results are presented as mean values ± standard error of the mean. Statistical analysis was carried out by unpaired Student's t-test using GraphPad Prism 5.01 software. P values <0.05 were considered statistically significant. In the survival analysis, Kaplan–Meier curves were plotted and compared using the log rank test.
SUPPLEMENTARY MATERIAL Figure S1. Control secondary staining and MPO neutrophil staining. Figure S2. CCN1 neutralization reduces macrophage migration towards infected glioblastoma cells. Figure S3. Chemokine induction by macrophages and glioblastoma cells in vitro. Figure S4. Co-culturing macrophages with infected glioblastoma cells has no effect on MCP-3 expression. Figure S5. Impact of anti-CCN1 treatment on OV efficacy in vivo. Table S1. Primer sequences.
Acknowledgments
This study was supported by the NIH grants: RO1NS064607-01, RO1CA150153-01, and P30NS045758.
Supplementary Material
Control secondary staining and MPO neutrophil staining.
CCN1 neutralization reduces macrophage migration towards infected glioblastoma cells.
Chemokine induction by macrophages and glioblastoma cells in vitro.
Co-culturing macrophages with infected glioblastoma cells has no effect on MCP-3 expression.
Impact of anti-CCN1 treatment on OV efficacy in vivo.
Primer sequences.
References
- Stupp R, Mason WP, van den Bent MJ, Weller M, Fisher B, Taphoorn MJ, et al. European Organisation for Research and Treatment of Cancer Brain Tumor and Radiotherapy Groups; National Cancer Institute of Canada Clinical Trials Group Radiotherapy plus concomitant and adjuvant temozolomide for glioblastoma. N Engl J Med. 2005;352:987–996. doi: 10.1056/NEJMoa043330. [DOI] [PubMed] [Google Scholar]
- Harrow S, Papanastassiou V, Harland J, Mabbs R, Petty R, Fraser M, et al. HSV1716 injection into the brain adjacent to tumour following surgical resection of high-grade glioma: safety data and long-term survival. Gene Ther. 2004;11:1648–1658. doi: 10.1038/sj.gt.3302289. [DOI] [PubMed] [Google Scholar]
- Markert JM, Liechty PG, Wang W, Gaston S, Braz E, Karrasch M, et al. Phase Ib trial of mutant herpes simplex virus G207 inoculated pre-and post-tumor resection for recurrent GBM. Mol Ther. 2009;17:199–207. doi: 10.1038/mt.2008.228. [DOI] [PMC free article] [PubMed] [Google Scholar]
- Wojton J, Kaur B. Impact of tumor microenvironment on oncolytic viral therapy. Cytokine Growth Factor Rev. 2010;21:127–134. doi: 10.1016/j.cytogfr.2010.02.014. [DOI] [PMC free article] [PubMed] [Google Scholar]
- Workenhe ST, Mossman KL. Oncolytic virotherapy and immunogenic cancer cell death: sharpening the sword for improved cancer treatment strategies. Mol Ther. 2014;22:251–256. doi: 10.1038/mt.2013.220. [DOI] [PMC free article] [PubMed] [Google Scholar]
- Liu YP, Suksanpaisan L, Steele MB, Russell SJ, Peng KW. Induction of antiviral genes by the tumor microenvironment confers resistance to virotherapy. Sci Rep. 2013;3:2375. doi: 10.1038/srep02375. [DOI] [PMC free article] [PubMed] [Google Scholar]
- Weibel S, Basse-Luesebrink TC, Hess M, Hofmann E, Seubert C, Langbein-Laugwitz J, et al. Imaging of intratumoral inflammation during oncolytic virotherapy of tumors by 19F-magnetic resonance imaging (MRI) PLoS One. 2013;8:e56317. doi: 10.1371/journal.pone.0056317. [DOI] [PMC free article] [PubMed] [Google Scholar]
- Msaouel P, Opyrchal M, Domingo Musibay E, Galanis E. Oncolytic measles virus strains as novel anticancer agents. Expert Opin Biol Ther. 2013;13:483–502. doi: 10.1517/14712598.2013.749851. [DOI] [PMC free article] [PubMed] [Google Scholar]
- Athanasopoulos AN, Schneider D, Keiper T, Alt V, Pendurthi UR, Liegibel UM, et al. Vascular endothelial growth factor (VEGF)-induced up-regulation of CCN1 in osteoblasts mediates proangiogenic activities in endothelial cells and promotes fracture healing. J Biol Chem. 2007;282:26746–26753. doi: 10.1074/jbc.M705200200. [DOI] [PMC free article] [PubMed] [Google Scholar]
- Hasan A, Pokeza N, Shaw L, Lee HS, Lazzaro D, Chintala H, et al. The matricellular protein cysteine-rich protein 61 (CCN1/Cyr61) enhances physiological adaptation of retinal vessels and reduces pathological neovascularization associated with ischemic retinopathy. J Biol Chem. 2011;286:9542–9554. doi: 10.1074/jbc.M110.198689. [DOI] [PMC free article] [PubMed] [Google Scholar]
- Lau LF. CCN1 and CCN2: blood brothers in angiogenic action. J Cell Commun Signal. 2012;6:121–123. doi: 10.1007/s12079-012-0169-z. [DOI] [PMC free article] [PubMed] [Google Scholar]
- Kurozumi K, Hardcastle J, Thakur R, Shroll J, Nowicki M, Otsuki A, et al. Oncolytic HSV-1 infection of tumors induces angiogenesis and upregulates CYR61. Mol Ther. 2008;16:1382–1391. doi: 10.1038/mt.2008.112. [DOI] [PMC free article] [PubMed] [Google Scholar]
- Löbel M, Bauer S, Meisel C, Eisenreich A, Kudernatsch R, Tank J, et al. CCN1: a novel inflammation-regulated biphasic immune cell migration modulator. Cell Mol Life Sci. 2012;69:3101–3113. doi: 10.1007/s00018-012-0981-x. [DOI] [PMC free article] [PubMed] [Google Scholar]
- Bian Z, Peng Y, You Z, Wang Q, Miao Q, Liu Y, et al. CCN1 expression in hepatocytes contributes to macrophage infiltration in nonalcoholic fatty liver disease in mice. J Lipid Res. 2013;54:44–54. doi: 10.1194/jlr.M026013. [DOI] [PMC free article] [PubMed] [Google Scholar]
- Moon HG, Zheng Y, An CH, Kim YK, Jin Y. CCN1 secretion induced by cigarette smoking extracts augments IL-8 release from bronchial epithelial cells. PLoS One. 2013;8:e68199. doi: 10.1371/journal.pone.0068199. [DOI] [PMC free article] [PubMed] [Google Scholar]
- Koon HW, Zhao D, Xu H, Bowe C, Moss A, Moyer MP, et al. Substance P-mediated expression of the pro-angiogenic factor CCN1 modulates the course of colitis. Am J Pathol. 2008;173:400–410. doi: 10.2353/ajpath.2008.080222. [DOI] [PMC free article] [PubMed] [Google Scholar]
- Bai T, Chen CC, Lau LF. Matricellular protein CCN1 activates a proinflammatory genetic program in murine macrophages. J Immunol. 2010;184:3223–3232. doi: 10.4049/jimmunol.0902792. [DOI] [PMC free article] [PubMed] [Google Scholar]
- Haseley A, Boone S, Wojton J, Yu L, Yoo JY, Yu J, et al. Extracellular matrix protein CCN1 limits oncolytic efficacy in glioma. Cancer Res. 2012;72:1353–1362. doi: 10.1158/0008-5472.CAN-11-2526. [DOI] [PMC free article] [PubMed] [Google Scholar]
- Schober JM, Chen N, Grzeszkiewicz TM, Jovanovic I, Emeson EE, Ugarova TP, et al. Identification of integrin alpha(M)beta(2) as an adhesion receptor on peripheral blood monocytes for Cyr61 (CCN1) and connective tissue growth factor (CCN2): immediate-early gene products expressed in atherosclerotic lesions. Blood. 2002;99:4457–4465. doi: 10.1182/blood.v99.12.4457. [DOI] [PubMed] [Google Scholar]
- Schober JM, Lau LF, Ugarova TP, Lam SC. Identification of a novel integrin alphaMbeta2 binding site in CCN1 (CYR61), a matricellular protein expressed in healing wounds and atherosclerotic lesions. J Biol Chem. 2003;278:25808–25815. doi: 10.1074/jbc.M301534200. [DOI] [PubMed] [Google Scholar]
- Fulci G, Breymann L, Gianni D, Kurozomi K, Rhee SS, Yu J, et al. Cyclophosphamide enhances glioma virotherapy by inhibiting innate immune responses. Proc Natl Acad Sci USA. 2006;103:12873–12878. doi: 10.1073/pnas.0605496103. [DOI] [PMC free article] [PubMed] [Google Scholar]
- Fulci G, Dmitrieva N, Gianni D, Fontana EJ, Pan X, Lu Y, et al. Depletion of peripheral macrophages and brain microglia increases brain tumor titers of oncolytic viruses. Cancer Res. 2007;67:9398–9406. doi: 10.1158/0008-5472.CAN-07-1063. [DOI] [PMC free article] [PubMed] [Google Scholar]
- Hokeness KL, Kuziel WA, Biron CA, Salazar-Mather TP. Monocyte chemoattractant protein-1 and CCR2 interactions are required for IFN-alpha/beta-induced inflammatory responses and antiviral defense in liver. J Immunol. 2005;174:1549–1556. doi: 10.4049/jimmunol.174.3.1549. [DOI] [PubMed] [Google Scholar]
- Lee SK, Choi BK, Kang WJ, Kim YH, Park HY, Kim KH, et al. MCP-1 derived from stromal keratocyte induces corneal infiltration of CD4+ T cells in herpetic stromal keratitis. Mol Cells. 2008;26:67–73. [PubMed] [Google Scholar]
- Lathia JD, Gallagher J, Heddleston JM, Wang J, Eyler CE, Macswords J, et al. Integrin alpha 6 regulates glioblastoma stem cells. Cell Stem Cell. 2010;6:421–432. doi: 10.1016/j.stem.2010.02.018. [DOI] [PMC free article] [PubMed] [Google Scholar]
- Suganami T, Nishida J, Ogawa Y. A paracrine loop between adipocytes and macrophages aggravates inflammatory changes: role of free fatty acids and tumor necrosis factor alpha. Arterioscler Thromb Vasc Biol. 2005;25:2062–2068. doi: 10.1161/01.ATV.0000183883.72263.13. [DOI] [PubMed] [Google Scholar]
- Parry GC, Martin T, Felts KA, Cobb RR. IL-1beta-induced monocyte chemoattractant protein-1 gene expression in endothelial cells is blocked by proteasome inhibitors. Arterioscler Thromb Vasc Biol. 1998;18:934–940. doi: 10.1161/01.atv.18.6.934. [DOI] [PubMed] [Google Scholar]
- Brieland JK, Flory CM, Jones ML, Miller GR, Remick DG, Warren JS, et al. Regulation of monocyte chemoattractant protein-1 gene expression and secretion in rat pulmonary alveolar macrophages by lipopolysaccharide, tumor necrosis factor-alpha, and interleukin-1 beta. Am J Respir Cell Mol Biol. 1995;12:104–109. doi: 10.1165/ajrcmb.12.1.7811465. [DOI] [PubMed] [Google Scholar]
- Zhou ZH, Han Y, Wei T, Aras S, Chaturvedi P, Tyler S, et al. Regulation of monocyte chemoattractant protein (MCP)-1 transcription by interferon-gamma (IFN-gamma) in human astrocytoma cells: postinduction refractory state of the gene, governed by its upstream elements. FASEB J. 2001;15:383–392. doi: 10.1096/fj.00-0373com. [DOI] [PubMed] [Google Scholar]
- Goodwin CR, Lal B, Zhou X, Ho S, Xia S, Taeger A, et al. Cyr61 mediates hepatocyte growth factor-dependent tumor cell growth, migration, and Akt activation. Cancer Res. 2010;70:2932–2941. doi: 10.1158/0008-5472.CAN-09-3570. [DOI] [PMC free article] [PubMed] [Google Scholar]
- Young N, Pearl DK, Van Brocklyn JR. Sphingosine-1-phosphate regulates glioblastoma cell invasiveness through the urokinase plasminogen activator system and CCN1/Cyr61. Mol Cancer Res. 2009;7:23–32. doi: 10.1158/1541-7786.MCR-08-0061. [DOI] [PMC free article] [PubMed] [Google Scholar]
- Yu Y, Gao Y, Wang H, Huang L, Qin J, Guo R, et al. The matrix protein CCN1 (CYR61) promotes proliferation, migration and tube formation of endothelial progenitor cells. Exp Cell Res. 2008;314:3198–3208. doi: 10.1016/j.yexcr.2008.08.001. [DOI] [PubMed] [Google Scholar]
- Kim B, Sarangi PP, Lee Y, Deshpande Kaistha S, Lee S, Rouse BT. Depletion of MCP-1 increases development of herpetic stromal keratitis by innate immune modulation. J Leukoc Biol. 2006;80:1405–1415. doi: 10.1189/jlb.0406295. [DOI] [PubMed] [Google Scholar]
- Rother M, Krohn S, Kania G, Vanhoutte D, Eisenreich A, Wang X, et al. Matricellular signaling molecule CCN1 attenuates experimental autoimmune myocarditis by acting as a novel immune cell migration modulator. Circulation. 2010;122:2688–2698. doi: 10.1161/CIRCULATIONAHA.110.945261. [DOI] [PubMed] [Google Scholar]
- Terada K, Wakimoto H, Tyminski E, Chiocca EA, Saeki Y. Development of a rapid method to generate multiple oncolytic HSV vectors and their in vivo evaluation using syngeneic mouse tumor models. Gene Ther. 2006;13:705–714. doi: 10.1038/sj.gt.3302717. [DOI] [PubMed] [Google Scholar]
- Wakimoto H, Fulci G, Tyminski E, Chiocca EA. Altered expression of antiviral cytokine mRNAs associated with cyclophosphamide's enhancement of viral oncolysis. Gene Ther. 2004;11:214–223. doi: 10.1038/sj.gt.3302143. [DOI] [PMC free article] [PubMed] [Google Scholar]
- Yoo JY, Pradarelli J, Haseley A, Wojton J, Kaka A, Bratasz A, et al. Copper chelation enhances antitumor efficacy and systemic delivery of oncolytic HSV. Clin Cancer Res. 2012;18:4931–4941. doi: 10.1158/1078-0432.CCR-12-0697. [DOI] [PMC free article] [PubMed] [Google Scholar]
- Huang P, Rani MR, Ahluwalia MS, Bae E, Prayson RA, Weil RJ, et al. Endothelial expression of TNF receptor-1 generates a proapoptotic signal inhibited by integrin α6β1 in glioblastoma. Cancer Res. 2012;72:1428–1437. doi: 10.1158/0008-5472.CAN-11-2621. [DOI] [PMC free article] [PubMed] [Google Scholar]
Associated Data
This section collects any data citations, data availability statements, or supplementary materials included in this article.
Supplementary Materials
Control secondary staining and MPO neutrophil staining.
CCN1 neutralization reduces macrophage migration towards infected glioblastoma cells.
Chemokine induction by macrophages and glioblastoma cells in vitro.
Co-culturing macrophages with infected glioblastoma cells has no effect on MCP-3 expression.
Impact of anti-CCN1 treatment on OV efficacy in vivo.
Primer sequences.