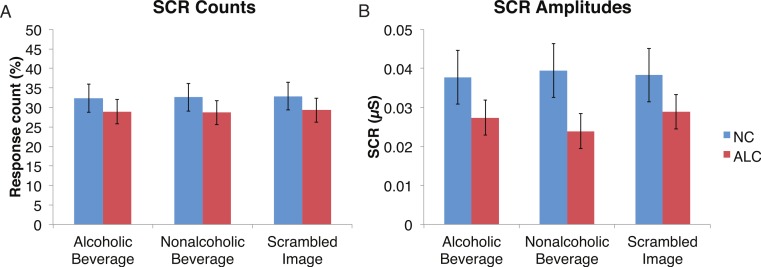
Figure 4. Skin conductance responses (SCR) to the distractor cues were not significantly related to the type of distractor for alcoholic participants compared to nonalcoholic controls.
Data are presented for alcoholic participants (ALC, in red) and nonalcoholic participants (NC, in blue). Error bars represent standard error. (A) A significant interaction of Group × Distractor Type was not identified for SCR counts. (B) SCR amplitudes (µS) also did not reveal a significant interaction.

