Abstract
In this research we investigated the degree of error during the carving phase of central fabrication of prosthetic sockets for people with limb amputation. Three different model shapes were ordered from each of ten central fabrication companies. Using an accurate custom mechanical digitizer and alignment algorithm, we digitized the models and then compared the model shapes with the electronic file shapes. Results showed that 24 of the 30 models had volumes larger than the electronic file shapes while 24 had volumes that were smaller. 29 of the 30 models were oversized at the proximal aspect of the tibial tuberosity and undersized at the patellar tendon and popliteal areas. This error would result in a socket that had less tibial tubercle relief than intended in addition to a larger anterior-posterior dimension than desired. Comparison of the model shapes with socket shapes assessed for nine of the companies in a previous study showed that for five of the companies the sockets were relatively undersized over the tibial crest and fibular head. The results indicate that the socket the prosthetist receives will not always fit as planned, and that errors in the carving process are a source of the discrepancies.
Keywords: CAD-CAM, prosthetic design, fabrication techniques
INTRODUCTION
Central fabrication facilities fulfill an important role in transtibial amputee prosthetic care by providing custom remote manufacturing services for clinical prosthetists. An electronic file of the desired socket shape is used by the central fabrication facility to create a socket. The central fabrication facility carves a solid positive model from the electronic file, and a technician then thermoforms a polymer sheet or cone over the model. The resulting socket is removed from the positive model and sent to the prosthtist for fitting. This process is fast, efficient, and reduces capital equipment expense and space needs for the practitioner compared to performing the fabrication in house.
We recently conducted an assessment of sockets made by central fabrication facilities. Results showed a wide range of quality [1]. While some companies consistently made sockets that well matched the electronic file shapes, others did not. Some companies made sockets that were too large over the entire socket surface, while other companies showed gradients of error from the distal to the proximal end. Some company sockets showed more error in high curvature regions than flat areas. Though the results from that study were intriguing, they did not indicate the sources of fabrication error. It is unclear whether errors were made during carving of the positive model or during forming that resulted in distorted socket shapes.
The purpose of this research was to assess exclusively the carving phase of central fabrication. The goal was to compare the shapes of carved positive models with the electronic file shapes used to create them. Analysis of these data provides insight into the magnitude of carving error and error sources.
METHODS
Socket Designs
Three socket designs were tested. The three sockets were example amputee patient cases from the ShapeMaker (Seattle Limb Systems, Poulsbo, Washington) prosthetic design software package. They were the same shapes as used in our previous assessment [1]. Socket A was of length 12.8 cm from the mid-patellar tendon to the distal end, and included 68 slices. Socket B was of length 14.2 cm and 50 slices. Socket C was of length 15.7 cm and 48 slices. The socket shape data were stored in AAOP file format at 72 points/slice.
Central Fabrication Facilities
Ten central fabrication facilities were contracted to manufacture positive models of each of the three socket shapes. All except one company (Company 7) were those used in our socket shape investigation [1]. That company was not used because they made their models out of a plaster and cornstarch combination, a material we could not digitize using our shape measurement instrument. The shape files were sent to the central fabrication facilities via e-mail. The cost per model ranged from $47 to $75 in 2007–2008 dollars, not including tax or shipping. All models were made of a polyurethane-based foam, though the exact material content and density varied among the companies. One model was ordered at a time, as opposed to ordering all three models together. According to company representatives, none of the companies modified the shape files before carving though companies 3 and 10 lightly sanded the models once carved.
Positive Model Digitization
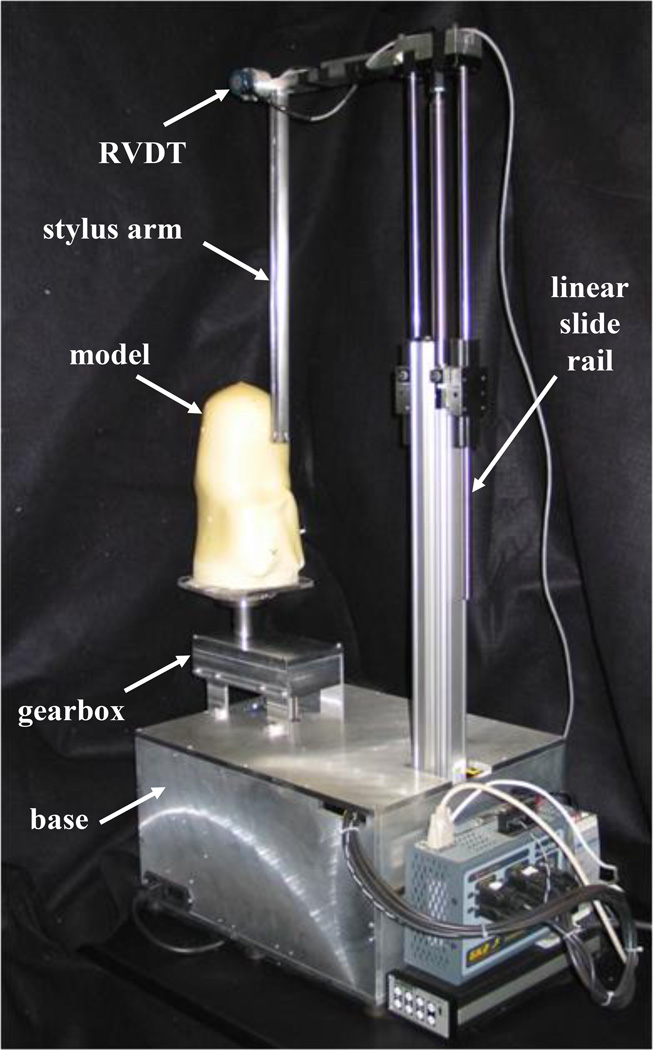
A custom mechanical digitizer was used to measure model shapes (FIGURE 1) [1,2]. We used a custom instrument because commercial digitizers lacked the performance qualities necessary to conduct this analysis. A spring loaded arm contacted the positive model surface such that the tip of the stylus was very accurately measured using position sensors on the stylus arm, slide rail, and motor that rotated the socket. The digitizer was modified from that described previously. A custom gearbox was added to offset the motor axis to prevent excessive angulation of the stylus arm during operation. Excessive angulation of the stylus arm would have increased error. The RVDT to measure stylus arm angular position was replaced (R30A, Schaevitz, Hampton, Virginia) and coupled to an external amplifier (ATA 2001, Schaevitz).
Figure 1. Instrument used to measure model shape.
The model was rotated using a motor in the base while stylus arm position was measured with an RVDT. The gearbox offset the motor axis so that the stylus arm was not excessively angulated during operation.
The models were affixed to 13 mm thick polycarbonate plates using resin. The plates were designed to attach securely to the mounting jig on the gearbox. For all positive models tested, a slice spacing of 0.8 mm and a density of 800 points per slice were used. These selections were established through sensitivity analysis testing as an appropriate tradeoff between the expected resolution needs and the time to conduct the measurement. It took about 6 h to digitize each model. Calibration was conducted using a solid test object with six sections of different external radii: 25, 35, 45, 55, 65, and 75 mm. The range spanned the radial dimensions of the positive models. Calibration was conducted each morning before positive models were evaluated.
Initial efforts to digitize the models were unsuccessful since the stylus ball on the instrument tended to stick in the foam surfaces. To overcome this problem, the models were coated with acrylic sealing resin (Orthocryl, Otto Bock, Minneapolis, Minnesota) before digitization. Once hardened, the resin filled the small holes in the foam and ensured that the stylus ball did not stick. Acetone was added to the resin so as to reduce viscosity and thus facilitate achieving a consistent resin thickness over the entire model surface. The acetone helped avoid resin build up in regions of low slope in the sagittal and frontal planes (e.g. patellar tendon, popliteal fossa, fibular head, anterior distal end). A mixture by mass of 2.5% hardener in resin was made, and then that mixture was combined by volume with 10% acetone. A custom jig was constructed to dip the models quickly and consistently then hold them vertically in a fume hood to dry with the proximal ends of the models upwards. A consistent mixing and dipping procedure was crucial towards achieving a consistent resin thickness.
Because different central fabrication facilities used different foams, potentially the thickness of the applied resin coating varied among the models. To eliminate this variability in analysis, we measured resin coating thickness on each model tested. Sixteen 10 mm×10 mm samples were cut from the proximal, mid-proximal, mid-distal, and distal regions of each model using a sharp blade. The foam was separated from the resin, and the resin thickness measured using a microscope (SMZ-2B, Nikon, Tokyo, Japan). This analysis provided a measurement of the resin thickness variability down the lengths of the positives. For each model, a linear least-squares fit was made to the plot of resin thickness vs. model height. The equation was applied to the data so that resin thickness as a function of length was subtracted from the digitizer measurements. Because this procedure was destructive, i.e. it created holes in the model surfaces, it was conducted after socket digitization.
Shape Analysis
To align the positive shapes to the electronic file shapes, techniques described previously [3] were implemented. The algorithm was an optimization procedure that minimized shape difference while maximizing shape similarity. The optimization criterion for minimizing shape difference was minimization of the mean error. The optimization criterion for maximizing shape similarity was alignment of surface normals. A weight ratio of 80% minimization of mean error to 20% alignment of surface normals was applied. For this analysis 100% of the points on each surface were used in the alignment algorithm.
RESULTS
Digitization Error
The instrument showed good repeatability. The percent volume difference between repeated scans was 0.0%; the mean radii difference was 0.01 mm; and the difference in the standard deviation of the mean radii was 0.07 mm.
Resin thickness measurements averaged 0.29 (±0.08) mm at the proximal ends of the models and 0.45 (±0.09) mm at the distal ends. The root-mean-square error of the sixteen points fit to the lines characterizing resin thickness vs. height averaged 0.04 (±0.02) mm for the 30 models tested.
Volume Difference
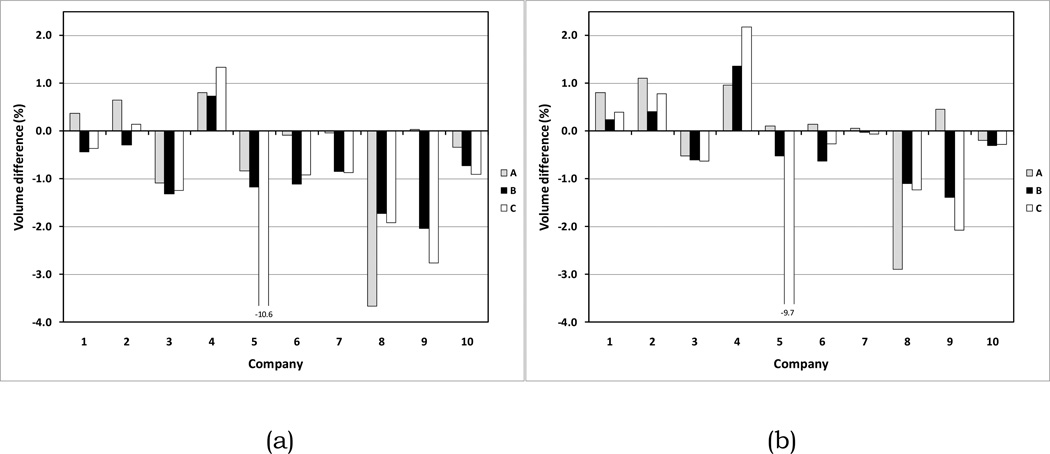
Most of the positive models were of smaller volume than the electronic file shapes (FIGURE 2a). Only six of the 30 models had volumes larger than the electronic file shapes while 24 had volumes that were smaller. On average the positives were 0.8% smaller in volume, approximately 1 ply, than the electronic file shapes.
Figure 2. a,b. Volume differences between positive models and electronic file shapes.
(a) Original data; (b) with 0.25 mm thickness (approximately 1 sock ply) added to the model radii.
All of the companies told us that they added a thin sock or a silicone liquid onto the positives when they formed sockets at their facilities. The reduced volumes of the positive models might have reflected these anticipated additions. In other words, the facilities were intentionally carving positives smaller than the electronic file shapes because they knew that the sock or silicone addition during forming would enlarge the socket. This reduction of the positive model is typically recommended by manufacturers of carving equipment. When we added 0.25 mm to the radius of the models, approximately 1 sock ply [4], the volume fits with the electronic file shapes improved (FIGURE 2b). The median volume difference reduced to −0.1%. With the 1 ply sock addition to the radii, thirteen of the 30 models had volumes greater than the electronic shape files while seventeen had volumes that were smaller. 20 of the 30 models had absolute volume differences with the electronic shape files of less than 1.1%.
Even with the 0.25 mm addition to the radius of the models, all models for three of the companies (3, 8, and 10) were still undersized. The undersizing was approximately ½ ply for companies 3 and 10. It was 1 to 3 ply for company 8.
For the analysis described below, the original data, not the shapes with the 1 ply sock addition to the model radii, are presented.
Company Dependence
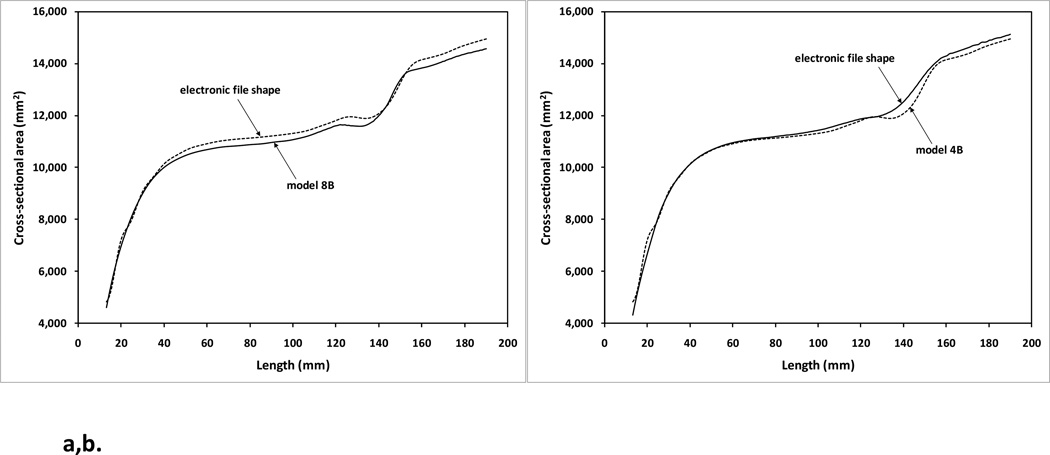
While models from companies 3, 8, and 10 models were consistently undersized, models from company 4 were consistently oversized. Mean radial errors for company 8 averaged −0.7 mm while those for companies 3 and 10 averaged −0.3 mm and −0.2 mm, respectively (TABLE 1). Those for company 4 averaged 0.2 mm. For company 8, the cross-sectional area vs. length plots showed consistent offsets down the model length (FIGURE 3a). Models from company 4, however, did not show this trend. Cross-sectional area vs. length plots did not show consistent offsets down the model length (FIGURE 3b).
TABLE 1.
Performance results for all models.
| Company Number |
Model | ΔVolume Model-AAOP AAOP (%) |
Radius % age of points within ±1.00mm of AAOP design |
Radius Min error (mm) |
Radius Max error (mm) |
Radius Mean error (mm) |
Radius s.d. of mean error (mm) |
PT diameter Difference Model-AAOP (mm) |
|---|---|---|---|---|---|---|---|---|
| 1 | A | 0.4 | 89 | −3.1 | 5.1 | 0.0 | 0.7 | 3.6 |
| 1 | B | −0.4 | 91 | −4.8 | 7.7 | −0.1 | 0.8 | 6.3 |
| 1 | C | −0.4 | 91 | −3.5 | 8.5 | −0.1 | 0.8 | 3.4 |
| 2 | A | 0.6 | 89 | −2.7 | 5.8 | 0.1 | 0.7 | 3.1 |
| 2 | B | −0.3 | 93 | −5.3 | 6.9 | −0.1 | 0.7 | 1.8 |
| 2 | C | 0.1 | 96 | −2.5 | 6.1 | 0.0 | 0.5 | 1.5 |
| 3 | A | −1.1 | 85 | −2.3 | 7.2 | −0.3 | 0.8 | 2.9 |
| 3 | B | −1.3 | 81 | −4.8 | 4.5 | −0.4 | 0.7 | 3.0 |
| 3 | C | −1.2 | 88 | −2.7 | 7.5 | −0.3 | 0.7 | 1.9 |
| 4 | A | 0.8 | 86 | −4.9 | 5.5 | 0.1 | 0.8 | 2.6 |
| 4 | B | 0.7 | 87 | −6.5 | 8.3 | 0.2 | 0.9 | 8.8 |
| 4 | C | 1.3 | 91 | −1.9 | 5.7 | 0.3 | 0.6 | 2.3 |
| 5 | A | −0.8 | 68 | −4.2 | 8.5 | −0.3 | 1.2 | 3.6 |
| 5 | B | −1.2 | 80 | −4.7 | 11.7 | −0.4 | 1.1 | 7.2 |
| 5 | C | −10.6 | 40 | −26.3 | 6.3 | −2.4 | 5.0 | −11.8 |
| 6 | A | −0.1 | 90 | −3.0 | 6.6 | −0.1 | 0.7 | 3.4 |
| 6 | B | −1.1 | 85 | −5.7 | 8.0 | −0.4 | 0.9 | 4.6 |
| 6 | C | −0.9 | 92 | −3.7 | 8.9 | −0.2 | 0.7 | 2.2 |
| 7 | A | 0.0 | 86 | −2.5 | 9.7 | −0.1 | 0.9 | 2.9 |
| 7 | B | −0.8 | 76 | −7.1 | 9.8 | −0.3 | 1.1 | 4.4 |
| 7 | C | −0.9 | 90 | −2.5 | 8.5 | −0.3 | 0.7 | 2.1 |
| 8 | A | −3.7 | 39 | −4.3 | 11.8 | −1.0 | 1.4 | 2.1 |
| 8 | B | −1.7 | 78 | −4.0 | 7.2 | −0.5 | 0.8 | 2.2 |
| 8 | C | −1.9 | 78 | −3.8 | 11.0 | −0.5 | 0.8 | 1.8 |
| 9 | A | 0.0 | 88 | −3.6 | 5.4 | −0.1 | 0.7 | 3.4 |
| 9 | B | −2.0 | 65 | −4.1 | 9.5 | −0.6 | 1.0 | 5.6 |
| 9 | C | −2.8 | 66 | −3.1 | 7.8 | −0.7 | 0.9 | 2.1 |
| 10 | A | −0.3 | 91 | −1.7 | 7.7 | −0.1 | 0.7 | 2.6 |
| 10 | B | −0.7 | 91 | −6.7 | 7.9 | −0.2 | 0.7 | 3.6 |
| 10 | C | −0.9 | 95 | −2.3 | 7.5 | −0.2 | 0.5 | 1.1 |
Figure 3. Original model shape compared with electronic file shape: Cross-sectional area vs. distance.
(a) model 8B; (b) model 4B. The model was consistently undersized down the length for model 8B. For model 4B the size difference was inconsistent down the model length.
Error Consistency Among Models from the Same Company
The radial errors were relatively consistent among the three model shapes for four of the companies (1, 2, 3, and 10). For each of these manufacturers, the mean radial errors varied by less than 0.1 mm among the three models (TABLE 1). The spread in radial error was also relatively consistent. Standard deviations of the mean radial error varied by less than 0.2 mm among the three models for each of these manufacturers (1, 2, 3, and 10).
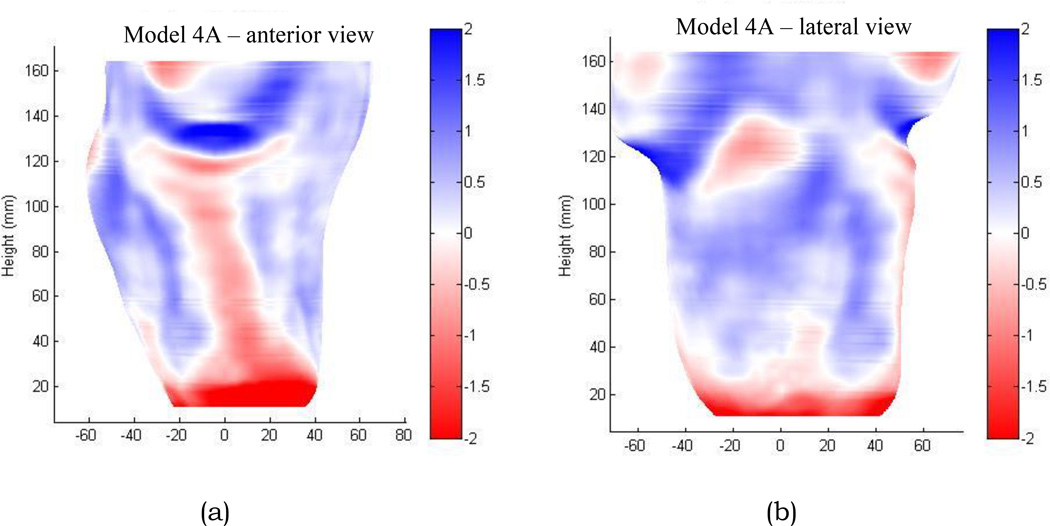
One company (company 4) showed very similar shape difference between the models and electronic file shapes for all three shapes. The positives were distorted at bony prominence locations, areas with high curvature change. The shapes were essentially smoothed and filtered, particularly over the anterior crest of the tibia and the proximal aspect of the fibular head (FIGURE 4a,b). All three models from company 4 showed this result. Relative to the electronic file shapes, the models were too small at these bony prominence areas and too large elsewhere.
Figure 4. a,b. Shape differences between model and electronic file shapes, showing mismatches over bony prominences.
(a) anterior view; (b) lateral view (model 4A).
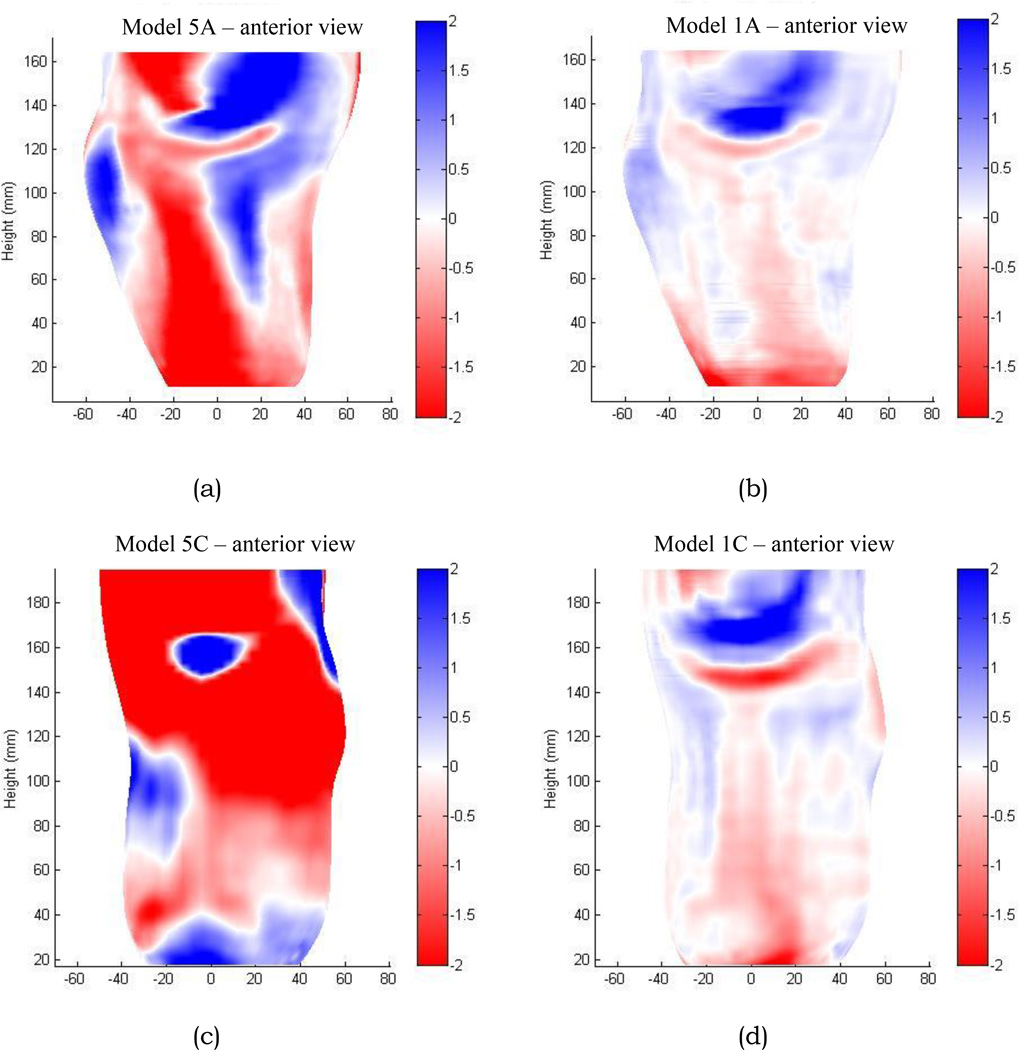
For another company (company 5), the patterns of shape difference were not consistent. For the part of the socket below the patellar tendon, model 5A displayed proximal to distal decreases in radial error (FIGURE 5a). However, model 5C exhibited proximal to distal increases in radial error (FIGURE 5b).
Figure 5. a–d. Shape differences between original model and electronic file shapes.
(a) model 5A; (b) model 1A; (c) model 5C; (d) model 2C. Models 5A and 5C poorly matched the electronic file shapes compared with models 1A and 2C.
The tabulated radial error data (TABLE 1) provide further insight into the nature of the distortion for the A and C models from company 5. Both 5A and 5C had relatively high standard deviations of the mean radial error, 1.2 mm and 5.0 mm, respectively (TABLE 1, column 8). As a comparison the standard deviations for models 1A and 2C were 0.7 mm and 0.5 mm, respectively. This result means that for models 5A and 5C, some areas were much too large and some areas were much too small. The range of distortion was much greater than that for models 1A and 2C. Further, model 5C showed substantial mean radial error, −2.4 mm (roughly 9 ply), indicating that it was substantially undersized compared with the electronic file shape. The mean radial error for 5A was −0.3 mm (approximately 1 ply). Thus model 5C had a combination of substantial undersizing and distortion while model 5A suffered mainly from distortion. Conversely, models from companies 1 and 2 consistently showed relatively strong matches between the positive models and the electronic file shapes (FIGURE 5b,d).
Local Shape Differences at the Level of the Patellar Tendon
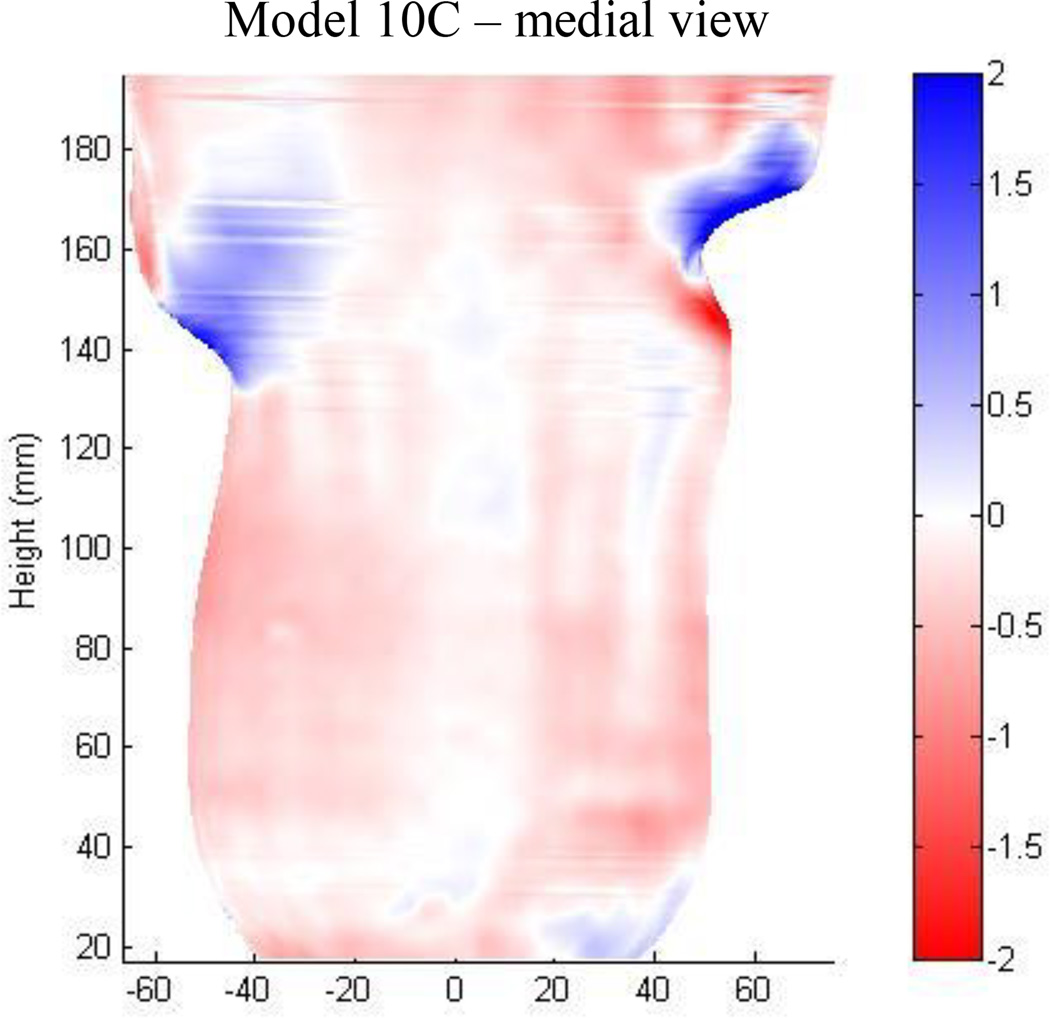
All 30 of the models showed error proximally at the level of the patellar tendon. For 29 of the 30 models the proximal aspect of the tibial tuberosity was carved too deep, while the patellar tendon and popliteal areas were carved too shallow. Thus the tibial tuberosity regions of the models were undersized while the patellar tendon and popliteal regions were oversized. This error would result in a socket that had less tibial tubercle relief than intended in addition to a larger anterior-posterior dimension than desired. In some cases these regions were the only sites that showed any substantial error (FIGURE 6). Anterior-posterior diameter differences at the patellar tendon ranged from 1.1 mm to 8.8 mm, except for model 5C which was −11.8 mm.
Figure 6. Shape difference between model and electronic file shapes showing greater error at the level of the patellar tendon than elsewhere.
(model 10C).
Comparison of Socket and Model Shapes
To gain insight into the sources of manufacturing error for companies common with our previous investigation of socket shape [1], we compared the shapes of the sockets from that study to the shapes of the models from this investigation.
Results varied among the manufacturers. For companies 1, 6, and 9 and to a lesser degree companies 2 and 3, the sockets compared to the positives models were smaller over the anterior crest of the tibia and the fibular head than elsewhere (FIGURE 7a–c). Company 4, 6, and 10 results showed consistent size differences between the sockets and models. Mean radii differences were −0.5, 0.7, and 1.5 mm, respectively. Thus company 4 sockets were consistently smaller than the models (~2 ply) while company 6 and 10 sockets were consistently larger than the models (~3 ply and ~6 ply, respectively). However, of these three manufacturers, only company 10 showed greater than 1.0 mm average error between the sockets and the models. The standard deviation of the difference in mean radii between the sockets and models was at least 1.3 mm for each of the three shapes for company 10. It was less than 0.7 for all company 4 cases and less than 1.0 for all company 6 cases.
Figure 7. a–c. Shape differences between sockets and models.
The sockets compared to the positives models were smaller over the anterior crest of the tibia and the fibular head than elsewhere. (a) model 1A; (b) model 1B; and (c) model 1C. Similar patterns were measured for companies 2, 3, 6, and 9, though the magnitude of the radial differences varied among the companies.
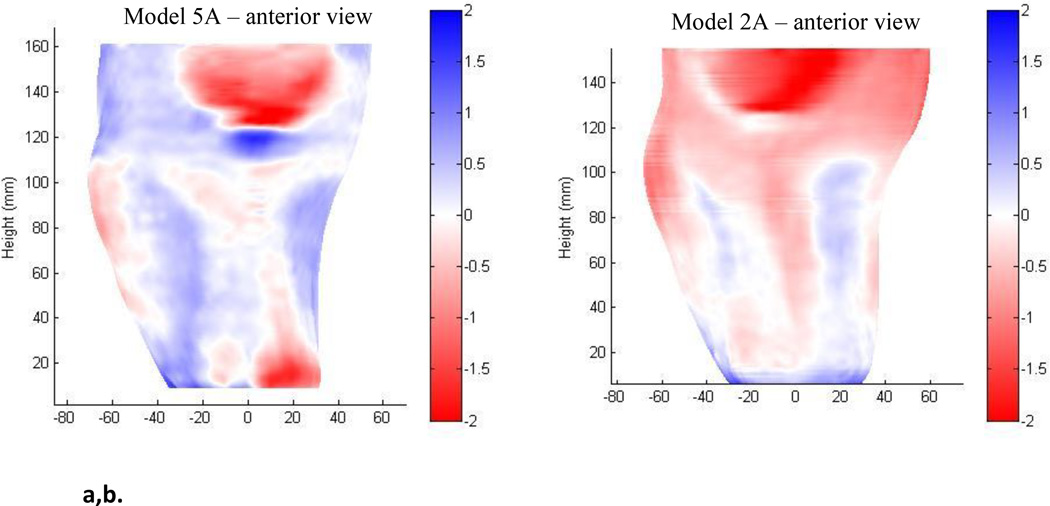
Models 5A and 5B were poor in that the shapes were distorted compared with the electronic file shapes. They had a large standard deviation of radial error (TABLE 1) and visible shape error (FIGURE 5a). However, the 5A and 5B sockets well matched the 5A and 5B positive models. Mean radii differences were 0.1 (±0.7) for both models. In terms of absolute error, the match between the sockets and models below the patellar tendon was comparable to that of the company with the best socket-to-model matches, company 2 (FIGURE 8a,b).
Figure 8. a,b. Shape differences between sockets and models.
Below the patellar tendon, the ranges of radial error were comparable between company 5 and company 2.
DISCUSSION
We compared the shapes of positive models from ten central fabrication facilities with their electronic file shapes in an effort to determine the degree of error from carving. The analysis helps towards identifying strengths and limitations in carving the positive model, the first stage of central fabrication of prosthetic sockets. The insight gained here can potentially be used by the industry to enhance model fabrication.
The resin used to coat the models, necessary here so that the digitizer stylus ball travelled smoothly over the surface, changed the size of the models. However, the resin coating was very thin, ranging in average thickness from 0.29 (±0.08) mm at the proximal end to 0.45 (±0.09) mm at the distal end. Further, its thickness was measured and accounted for in each model. The average root-mean-square error in the equations used to characterize resin thickness vs. length, 0.04 (±0.02) mm, was much smaller than the radial shape differences of interest in this analysis. Thus the resin thickness deviation from linearity from the proximal to distal end had minimal influence on the analysis of interest here.
Our results suggest that most of the central fabrication companies followed carver manufacturer recommendations of reducing the model radii by 1 sock ply when carving. This adjustment is made in anticipation of adding a sock or a silicone layer during forming. When we added 0.25 mm to the measured model radii the volume matches with the electronic file shapes improved.
The consistent undersizing by three companies (companies 3, 8, and 10) despite the 1 ply sock addition to the model radii suggests an additional systematic source of error. For companies 3 and 10 the error was only about ½ sock ply. Since these were the only companies that sanded the models after carving, it is reasonable to conclude that sanding was responsible for this ½ ply undersizing. The error for company 8, however, was more substantial, ranging from an additional 1 ply to 3 ply undersizing beyond the 1 ply we added to the model radii to account for the sock to be used during forming. There was likely a consistent error in the carver, possibly a calibration error. Removing and repositioning the carver bit at a different radial position between calibrations would also explain this result.
A proximal to distal gradient in error suggests a longitudinal misalignment problem in manufacturing. The axis of bit movement was not parallel to the model longitudinal axis. However, this interpretation for company 5 results is unlikely. The direction of the gradient for model 5A was opposite that of model 5C. In addition, one model (5A) suffering mainly from shape distortion while the other model (5C) suffered from both shape distortion and undersizing. Further investigation would be needed to identify the sources of error for company 5 models.
The filtering phenomenon seen for company 4 models (FIGURE 4a,b) points to a resolution issue. In these models, areas over bony prominences were carved deeper than other regions. A possible explanation for this result is that the models were carved at such a high speed that the tools paths smoothed the high curvature areas. Clinically, sockets formed on these models are potentially problematic in that they are too small over the crest of the tibia and fibular head, regions typically sensitive for the patient and prone to injury.
Because all models were oversized at the level of the patellar tendon except one (model 5C), it is reasonable to suspect a systematic source of error across companies. The patellar tendon is typically a complex region with much curvature change through a small distance. It is difficult to maneuver the relatively large carver bit (12.7 mm and 19.1 mm diameter bits are typically used in the industry) into this space to remove material at the patellar tendon without removing material in adjacent areas. The oversizing of the models at the patellar tendon for 29 of the 30 models suggests a limitation common in the industry.
By combining the information from this study on positive models with that from our previous study on sockets [1], we can gain insight into the relative error from carving vs. forming for companies common to both studies. However, this comparison has the limitation that for all companies there was at least 6 mo time between when we ordered the sockets for the previous study and when we ordered the positive models for this investigation. Companies could have changed their manufacturing practices or equipment over this time interval. Nevertheless, companies should be distributing a product of consistent quality, thus such a comparison is warranted.
For some of the companies comparison of socket and model shapes showed noteworthy patterns. Company 2’s models and sockets were relatively well matched to the electronic file shapes and well matched to each other ([1], TABLE 1). Mean radial errors for the sockets compared with the models averaged 0.1 (±0.7) mm for the three shapes. Shrinkage of the socket polymer during cooling might have contributed to the slight socket undersizing observed in some regions (e.g. FIGURE 8b).
Results comparing sockets to models for two of the sockets from company 5 (A and B) suggest effective forming processes but limitations in model carving. The sockets well matched the model shapes, indicating a proper socket forming process. However, the models poorly matched the electronic file shapes, indicating a limitation in carving. In other words, errors in carving propagated through fabrication to appear in the socket shapes.
Results comparing sockets to models for the sockets from company 10 suggest effective carving processes but limitations in forming. The positive models shapes evaluated here showed less than ±1.1% volume differences compared with the electronic file shapes and −0.2 (±0.7) mm mean radial error. Over 90% of the points on the surfaces were within 1 mm of the electronic file surface. However, results from the socket study for company 10 were poor, with socket oversizing averaging 6 ply for the three sockets tested [1].
The consistent error in forming over bony prominences apparent in results from five of the companies (1, 2, 3, 6, and 9) suggests a limitation common in the industry. The sockets compared to the models were smaller over the tibial crest and fibular head than at other locations (FIGURE 7a–c). The polymer could have deformed the positive during forming. However, very low density polyurethane foam would have had to be used for this to occur. If the sockets were removed from the models before completely cooled, subsequent shrinkage might have occurred, particularly in areas stretched over bony prominences. If the polymer were not raised to the proper temperature it would later tend to return to its original flat configuration, with greatest shrinkage in the areas that were stretched the most. Since the magnitude of distortion over bony prominences varied among manufacturers it is reasonable to conclude that specific manufacturing practices affected the severity of the distortion.
CONCLUSION
An assessment of the shape difference between positive models and electronic file shapes was conducted in an effort to identify limitations in the carving processes performed by central fabrication facilities. Results from ten companies showed a range in shape quality of the models. Some companies carved models that well matched the electronic file shapes but other companies showed sizing errors or shape distortions. Combining insight from this investigation with that from a previous study [1], we conclude that errors in both carving and forming affect the industry. The impact of these errors is that the test socket the prosthetist receives will not always fit as planned, and that discrepancies from the desired shape vary among manufacturers.
ACKNOWLEDGEMENTS
This material was based on work supported by the National Institutes of Health (NIH), National Institute of Bioimaging and Biomedical Engineering grant NIH R01EB07329.
Contributor Information
Joan E Sanders, University of Washington, Bioengineering.
Michael R Severance, University of Washington, Bioengineering.
Timothy R Myers, University of Washington, Bioengineering.
Marcia A Ciol, University of Washington, Rehabilitation Medicine.
REFERENCES
- 1.Sanders JE, Rogers EL, Sorenson EA, Lee GS, Abrahamson DC. CAD/CAM transtibial prosthetic sockets from central fabrication facilities: How accurate are they? J Rehabil Res Dev. 2007;44(3):395–406. doi: 10.1682/jrrd.2006.06.0069. [DOI] [PMC free article] [PubMed] [Google Scholar]
- 2.Sanders JE, Mitchell SB, Zachiarah SG, Wu K. A digitizer with exceptional accuracy for use in prosthetics research: A technical note. J Rehabil Res Dev. 2003;40(2):191–196. [PubMed] [Google Scholar]
- 3.Zachariah SG, Sorenson E, Sanders JE. A method for aligning trans-tibial residual limb shapes so as to identify regions of shape change. IEEE Trans Neural Syst Rehabil Eng. 2005;13(4):551–557. doi: 10.1109/TNSRE.2005.858459. [DOI] [PubMed] [Google Scholar]
- 4.Fernie GR, Holliday PJ. Volume fluctuations in the residual limbs of lower limb amputees. Arch Phys Med Rehabil. 1982;63(4):162–165. [PubMed] [Google Scholar]


