Abstract
Bioimpedance analysis was used to measure conductive tissue, extracellular fluid volume changes in the residual limbs of four unilateral trans-tibial amputee subjects during standing and walking conditions. Results were useful towards clinical assessment, patient education, and decision-making about treatment.
INTRODUCTION
Diurnal residual limb volume change is an important clinical challenge in lower-limb prosthetics. Volume reduction induces a loose socket fit, and if no accommodation is performed can cause stresses to concentrate in soft tissue, particularly at bony prominences. Volume expansion can increase tissue pressures in the residual limb and cause blood flow occlusion, restricting venous return and causing a buildup of cell waste products in the limb. Both conditions can lead to soft tissue injury.
Residual limb volume fluctuations can be challenging to manage. Diurnal volume change is often difficult to predict, and it can be hard for amputees to decide how many socks to add or remove. Additionally, patients often have difficulty understanding how their behavior (e.g. diet, activity, smoking) affects limb volume fluctuation. Establishing when a residual limb has achieved a stable limb size after amputation surgery so as to fabricate a definitive socket is another important clinical issue.
We have shown bioimpedance analysis to have sufficient sensitivity in prosthetics for the measurement of residual limb conductive tissue volume change [1]. In a fifteen subject study, it was used effectively to distinguish subjects who regularly added socks during the day from those who did not [2]. Bioimpedance measurement is potentially attractive for clinical use in that it provides a very sensitive quantitative assessment of conductive tissue volume change, measuring volume alterations as small as those over the course of a 5 min standing interval [2].
The purpose of this paper is to present four clinical cases where residual limb, conductive tissue, volume change measurement using bioimpedance analysis was useful towards clinical assessment. We present these cases, how volume change was assessed, and how the findings were useful in treatment.
METHODS
All four subjects were individuals with unilateral trans-tibial amputation who had their amputations at least 6 mo prior and could walk on a treadmill without assistive devices for 5 min intervals. A human subject application was approved by an institutional review board, and informed consent was obtained before any study procedures were initiated.
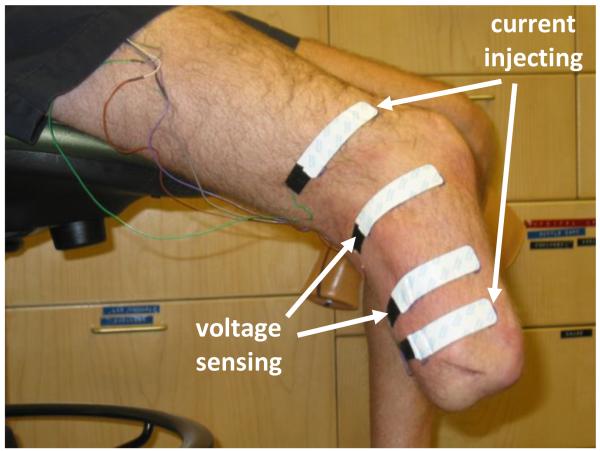
A commercial bioimpedance analyzer that measured impedances at 50 frequencies between 5 kHz and 1 MHz each second was used (Hydra 4200, Xitron Technologies, San Diego, California). Four strip electrodes (77 mm × 20 mm contact surface, 0.81 mm thickness) were implemented where the outer two electrodes delivered current (<700 μA) and the inner two electrodes sensed voltage (FIGURE 1). Much care was taken to prepare the electrodes for measurement. 24 g multi-stranded wires were soldered to the electrode tabs and strain-relieved at their attachments. A custom connector was designed to attach the electrode wires to the instrument cable to ensure a stable attachment.
FIGURE 1. Subject ready for bioimpedance analysis testing.
Current injecting and voltage sensing electrodes were positioned on the residual limb and the attached wires strain relieved.
Electrodes were positioned on the lateral and posterior aspects of the residual limb. The proximal voltage sensing electrode was at the level of the patellar tendon. The distance between the voltage sensing electrodes was 7.0 to 9.0 cm depending on the limb length. The distal current injecting electrode was at least 3.0 cm distal to the distal voltage sensing electrode and was positioned on the relatively cylindrical portion of the residual limb. The proximal current injecting electrode was at least 6.5 cm proximal to the proximal voltage sensing electrode. Custom Matlab (Mathworks, Natick, MA) code was written on a laptop (D620 Latitude, Dell, Round Rock, TX) to visualize bioimpedance data from the instrument in approximately real time (3 s delay). Our algorithm was similar to that described by De Lorenzo [3] except that the error criteria were slightly relaxed. This change ensured that our algorithm ran faster, albeit with slightly less accuracy. Since the visualization data were used only to ascertain performance of the instrumentation and to identify gross changes in limb volume, the algorithm’s performance was considered acceptable for this application.
The data collection protocol involved intervals of sitting, standing, and walking. After the subject’s weight was measured and his or her self-selected walking speed determined, the skin was cleaned, electrode locations were determined, and reference marks were made. The electrodes were positioned on the residual limb. Data collection was initiated at a 1 Hz sampling rate, and after a stable limb volume signal was demonstrated the subject donned the prosthesis. He/she sat quietly for 2 min. Conductive tissue volume measured at the end of the 2 min interval was used as a reference. The subject then stepped onto a 6.4 cm high platform with an electronic scale (349KLX Health-O-Meter, Pelstar, Bridgeview, Illinois) embedded in the surface so that weight on the instrumented limb was measured. The subject was asked to maintain equal weight bearing. Weight was monitored continuously at a 1 Hz sampling rate, and the subject instructed to shift his/her weight if a change of more than 10% of half the subject’s body weight occurred. After a 5 min standing interval, the subject stepped onto a treadmill (Clubtrack, Quinton Instrument Company, Bothell, Washington) and walked at his or her nominal walking speed for a 5 min interval. The subject then sat and rested for a 2 min period. The stand and walk portions were then repeated again. After the second walk interval, the subject sat and doffed the prosthesis, liner, and socks.
Collected bioimpedance data were post processed using software provided by the manufacturer (v2.2, Xitron). The algorithm rejected points with excessive error based on quality of fit criteria [3], less than 4% of the data collected in this study. Bioimpedance data were converted to conductive tissue, extracellular fluid volume using a well accepted model [4], and then expressed as a percentage of the conductive tissue extracellular fluid volume measured after the initial 2 min sit interval with the prosthesis donned. It is important to note that only conductive tissue volume change (i.e. not including bone and adipose tissue) was characterized in this analysis. Thus the data are presented as a percentage of conductive tissue volume, not as a percentage of the entire residual limb volume.
To facilitate data analysis, a 10-point moving mean of the percent change in volume and a 2nd order Butterworth low-pass filter of the 10-point moving mean were plotted. Since there was a time delay caused by the moving average filter, these two curves were moved back 10 points so as to realign them with the original data. These curves were particularly useful for analysis of the walking segments of the trials. Those sections had a lot of fluctuation because of the change in volume over the course of each step. Because the sampling rate was less than the walking frequency, it was not possible to measure the volume change during each step. However, in this analysis it was the change over the course of the walking interval that was of interest. Thus use of the moving mean and filter curves was appropriate. In the results presented below, we present only the moving mean and filtered curves, not the raw data, so as to simplify visualization of the data.
RESULTS
Data from a healthy subject with a comfortable prosthesis and no reported residual limb problems are presented in Case 1 so as to provide a base for comparison with the other three subjects (Cases 2, 3, and 4) described below.
Case 1
This male subject was 60 years of age and had his amputation 4 yr prior due to traumatic injury. He was 72.7 kg in mass and 175 cm in height, and had no abnormalities other than his unilateral amputation. He used a transtibial socket with an elastomeric liner with a locking pin. A K-4 level ambulatory, this subject regularly walked and played golf and racquet sports. He did not add socks or perform any prosthesis modification over the course of the day to accommodate limb volume reduction, except under extreme physical exertion.
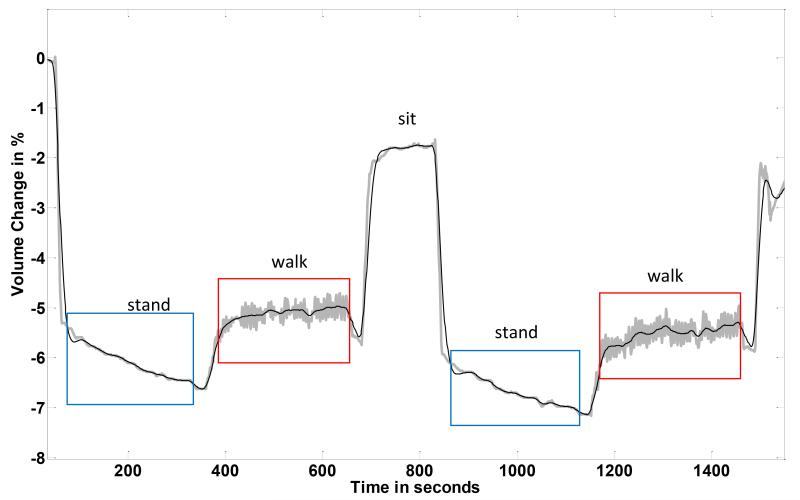
The subject demonstrated residual limb, conductive tissue, volume reduction during standing and increase during subsequent walking (FIGURE 2). Results from the first stand/walk segment were similar to those from the second stand/walk segment. The conductive tissue volume loss during the standing intervals averaged 1.1%. Conductive tissue volume gain during the walking intervals averaged 0.9%.
FIGURE 2. Results from a healthy subject (Case 1).
Data from the central part of a session are shown.
Case 2
This was a 69 year old male who had been an amputee for 23 years. He was 105.0 kg in mass and 185 cm in height, and had his amputation due to arterial vascular disease and gangrene. For the past 2½ years he was diabetic. A K-2 level ambulator, this individual used a transtibial socket with an expanded polyethylene foam liner and neoprene suspension sleeve. He was retired and used a hand-crank bicycle for transportation instead of walking.
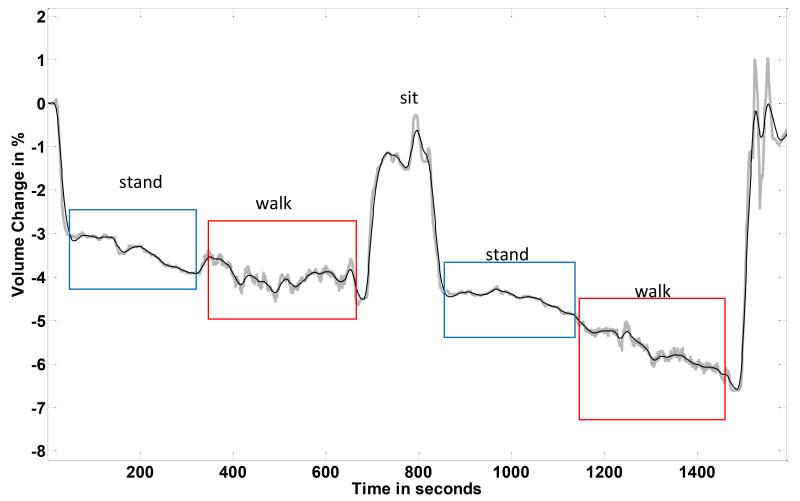
Results from this subject (FIGURE 3) were much different from those of the healthy subject shown above (FIGURE 2). There was a gradual conductive tissue volume decrease over the session. Most notably the subject’s limb did not enlarge when the walking intervals were initiated. Instead he kept on reducing. This result is consistent with the subject’s health status. We expect that his arterial vascular insufficiency resulted in a lower than normal arterial to interstitial fluid drive during walking. Without a sufficient arterial vascular plexus, fluid transport into the residual limb did not increase upon the initiation of walking.
FIGURE 3. Results from a subject with vascular insufficiency (Case 2).
Data from the central part of a session are shown. The subject’s limb, conductive tissue, volume decreased over the course of the session.
Of particular note in this case was the subject’s interpretation of his fitting. He was adamant that over the course of the session his residual limb was enlarging, not reducing. He was sure that he was experiencing distal discomfort because his residual limb was swelling so excessively in the socket. He felt that the induced tightness was causing a slight throbbing sensation.
After two sessions with similar data collected on the subject, the research practitioner showed this subject the bioimpedance data. The subject was surprised that his limb was actually reducing in conductive tissue volume over the session. Interestingly, he quickly accepted the data as valid. In the subsequent session one month later, he was using a smaller socket and clinically his limb was much healthier. The improvement in his limb tissue health was marked. In the research practitioner’s view, this attitude change to accept the new socket was due to his being shown the bioimpedance, conductive tissue volume change data. For months he had refused to use the new prosthesis with the smaller socket. Showing and interpreting for him the bioimpedance data helped to convince him that using the new socket was in his best interest.
Case 3
This subject was a 25 year old female who had her amputation 6 mo prior due to traumatic injury. She was in good health, was an avid long-distance runner, and was 58.2 kg in mass and 160 cm in height. She used a transtibial socket with a silicone liner with a locking pin.
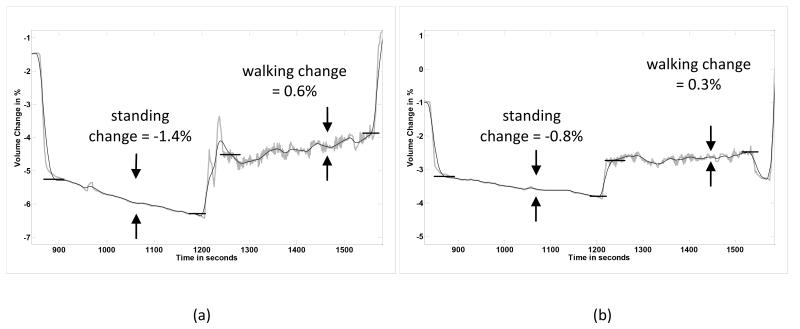
Initial testing results on this subject showed substantial absolute, conductive tissue, volume changes during standing and moderate changes during walking (FIGURE 4a). She was very early post amputation, approximately 6 mo since surgery. At 12 mo post amputation, however, her absolute, conductive tissue, volume changes were much less (FIGURE 4b). Clinically, she had transitioned from adding two sock ply midday to not adding any ply during the day. Instead the additional two ply were put on in the morning when she initially donned her prosthesis.
FIGURE 4a,b. Subject transitioning to a stable limb volume (Case 3).
Only one set of stand and walk segments is shown in each plot. The ranges on the vertical axes are the same for both panels. (a) 6 months after amputation. (b) 12 months after amputation. Absolute, conductive tissue, volume changes during standing and walking segments were less 12 mo after amputation than at 6 months post amputation.
Her bioimpedance results are consistent with those of the health subject who had achieved a stable residual limb (FIGURE 2). After she stabilized, much less absolute, conductive tissue, volume change during both the standing and walking intervals was measured. Thus the bioimpedance data helped to reassure the subject that her change to no midday sock addition was due to limb volume stabilization.
Case 4
This subject was a 64 year old male unilateral amputee who had his amputation 42 years prior. His cause of amputation was trauma. He was 90.5 kg in mass and 183 cm in height, and was a K-3 level ambulator. Though he was retired, he reported walking frequently, using a transtibial socket with a wool sock, an expanded polyethylene foam liner, and neoprene suspension. He had congestive heart failure and was taking medication for it.
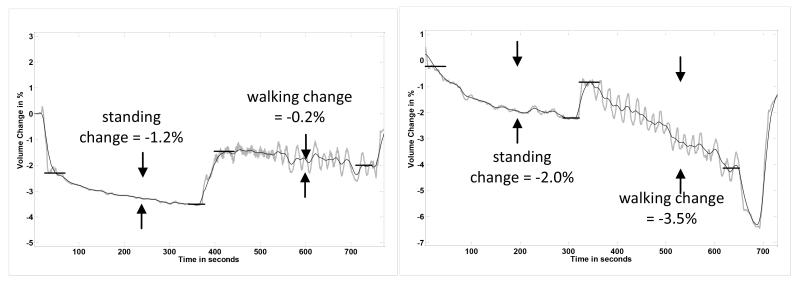
Results from a typical session for this subject over many months showed very stable and consistent limb conductive tissue volume changes during the stand and walking portions (FIGURE 5a). Results were essentially identical over a sixteen month period.
FIGURE 5a,b. Results from a congestive heart failure patient (Case 4).
Only one set of stand and walk segments is shown in each plot. The ranges on the vertical axes are the same for both panels. (a) On a healthy diet. (b) After 3 wk on a high salt diet. Conductive tissue volume reductions during the stand and walk segments were much greater after 3 wk on a high salt diet than on a healthy diet.
Drastically different results were obtained in a subsequent session. Instead of showing stable curves, his residual limb conductive tissue volume decreased during the session, particularly during the walking interval (FIGURE 5b), similar to results for Case 2 above. Upon querying by the study practitioner about recent changes to his diet or daily routine, the subject admitted that he had eaten a lot of ham and other salty foods over the past three weeks, unlike his usual low-salt diet. We expect that the high salt intake coupled with his congestive heart failure condition caused him to retain much interstitial fluid, providing greater resistance to fluid transport from the arterial compartment to the interstitial space. This reduced transport would explain the decrease in residual limb conductive tissue volume during walking.
DISCUSSION
Measurement of residual limb, conductive tissue, volume fluctuation achieved with bioimpedance analysis is potentially useful in clinical prosthetics practice. Because data are collected while the residual limb is within the prosthetic socket and while the subject is ambulating, insight into the effects of different activities on residual limb, conductive tissue, volume can be obtained. With an appropriate study protocol, we can gain insight relevant to clinical treatment.
In prosthetics applications, bioimpedance analysis is appropriate for the assessment of change in conductive tissue volume as opposed to absolute conductive tissue volume [1]. It is important to recognize that it is only changes in fluid volume that can be reliably assessed. In addition, percentage change in the conductive tissue volume is presented here as opposed to percentage change relative to the entire limb including bone and adipose tissue. The percentages are higher than if the entire limb volume were used in the calculation. We present the data in this format not only because it is the convention in bioimpedance analysis but also because it allows comparisons to be made among subjects.
Conductive tissue volume changes measured during 5 min of standing followed by 5 min walking proved to be clinically useful here. This protocol was essentially a stress test. During standing, interstitial fluid pressure increased, which increased fluid transport from the interstitial space into the venous vasculature, reducing the volume of the residual limb. All subjects in this study showed limb conductive tissue volume reduction during standing. During subsequent walking, arterial pressure increased but the limb conductive tissue volume response varied depending on the health of the subject. In healthy subjects (Cases 1 and 3) residual limb conductive tissue volume increased due to the increased fluid transport from the arterial vasculature into the interstitial space. These subjects’ arterial fluid drives were strong and intact. The bioimpedance data for Cases 2 and 4, however, suggest a weak arterial fluid drive, consistent with their health conditions. A poor arterial vascular plexus was the likely source of volume decrease during standing and walking for Case 2. This subject did not have enough intact arterial conduits to bring sufficient fluid into the residual limb for transport across into the interstitial space. There was an imbalance between fluid leaving and entering the residual limb. Excessive interstitial fluid buildup combined with cardiovascular insufficiency was presumably the source for Case 4. This subject’s interstitial fluid resistance was high, making it difficult to transport fluid across from the arterial system into the interstitial space.
It is reasonable to expect that conductive tissue fluid volume changes during standing with equal weight-bearing reflect the porosity of the residual limb. A limb that experiences much transport from the interstitial space into the venous vasculature during standing, thus undergoes much conductive tissue volume reduction, is very porous. A limb with minimal interstitial to venous transport during standing is not as porous. The results from Subject 3 are consistent with this interpretation. After amputation, as her residual limb matured it reduced in volume and became firmer. The amount of fluid transport during standing decreased. The bioimpedance data quantified this maturation process. An interesting next step would be to use bioimpedance measurement to monitor subjects postoperatively to determine if the results can be used to establish the timing of definitive socket fabrication. Bioimpedance investigation might also prove useful towards evaluation of treatments to promote limb stabilization.
Case 4 presented in this report demonstrated that a useful application of bioimpedance analysis was in establishing when a subject’s condition had changed. Because we had collected data on this subject previously we immediately recognized when we measured a different response. That difference prompted investigation of the source, which led to a clinically relevant issue concerning salt consumption in this cardiovascular insufficiency patient. These results point to the potential value of bioimpedance analysis as a regular analysis tool in prosthetics practice.
The use of quantitative measurement to help demonstrate to a subject his or her status and the need for modification is a powerful tool in biomedicine. As demonstrated in Case 2, patients are more likely to accept a practitioner’s diagnosis if shown data. Bioimpedance analysis potentially adds this very useful capability to a prosthetist’s toolset.
Currently the bioimpedance analysis system used in this research is an experimental research tool. To take this system to a clinical product level, practical concerns need to be resolved. Principally, logistical issues concerning electrode preparation and attachment need to be simplified, and the system needs to be made easier to use. There is potential to create new protocols to provide different insight into a patient’s status and appropriate treatments, depending on the clinical need. It will be through extensive amputee subject testing and careful interpretation of the data that the clinical potential of bioimpedance analysis in prosthetics will be realized.
CONCLUSION
Bioimpedance analysis provided clinically useful insight towards understanding and managing of limb conductive tissue volume change in four case study patients with trans-tibial amputation.
ACKNOWLEDGEMENTS
This material was based on work supported by the National Institutes of Health (grant R01EB-004329). The authors have declared that no competing interests exist.
REFERENCES
- 1.SANDERS JE, ROGERS EL, ABRAHAMSON DC. Assessment of residual limb volume change using bioimpedance. J Rehabil Res Dev. 2007;44(4):525–536. doi: 10.1682/jrrd.2006.08.0096. [DOI] [PubMed] [Google Scholar]
- 2.SANDERS JE, HARRISON DS, ALLYN KJ, MYERS TR. Bioimpedance analysis and diurnal volume change: Assessment on trans-tibial amputee prosthesis users. Arch Phys Med Rehabil. 2008 submitted. [Google Scholar]
- 3.DE LORENZO A, ANDREOLI A, MATTHIE J, WITHERS P. Predicting body cell mass with bioimpedence by using theoretical methods: a technological review. Am Physiological Soc. 1997;82(5):1542–1558. doi: 10.1152/jappl.1997.82.5.1542. [DOI] [PubMed] [Google Scholar]
- 4.FENECH M, JAFFRIN MY. Extracellular and intracellular volume variations during postural change measured by segmental and wrist-ankle bioimpedance spectroscopy. IEEE Trans Biomed Eng. 2004;51(1):166–175. doi: 10.1109/TBME.2003.820338. [DOI] [PubMed] [Google Scholar]


