Abstract
Singlet oxygen (1O2) is generally believed to be the major cytotoxic agent during photodynamic therapy (PDT), and the reaction between 1O2 and tumor cells define the treatment efficacy. From a complete set of the macroscopic kinetic equations which describe the photochemical processes of PDT, we can express the reacted 1O2 concentration, [1O2]rx, in a form related to time integration of the product of 1O2 quantum yield and the PDT dose rate. The production of [1O2]rx involves physiological and photophysical parameters which need to be determined explicitly for the photosensitizer of interest. Once these parameters are determined, we expect the computed [1O2]rx to be an explicit dosimetric indicator for clinical PDT. Incorporating the diffusion equation governing the light transport in turbid medium, the spatially and temporally-resolved [1O2]rx described by the macroscopic kinetic equations can be numerically calculated. A sudden drop of the calculated [1O2]rx along with the distance following the decrease of light fluence rate is observed. This suggests that a possible correlation between [1O2]rx and necrosis boundary may occur in the tumor subject to PDT irradiation. In this study, we have theoretically examined the sensitivity of the physiological parameter from two clinical related conditions: (1) collimated light source on semi-infinite turbid medium and (2) linear light source in turbid medium. In order to accurately determine the parameter in a clinical relevant environment, the results of the computed [1O2]rx are expected to be used to fit the experimentally-measured necrosis data obtained from an in vivo animal model.
Keywords: Photodynamic therapy, singlet oxygen, oxygen diffusion, light transport, PDT dosimetry
1. INTRODUCTION
Photodynamic therapy is a cancer treatment modality based on the interaction of light, a photosensitizing drug (PS), and oxygen [1]. Singlet oxygen (1O2) is believed to be the major cytotoxic agent during type II photodynamic therapy, and the reaction between 1O2 and tumor cells define the treatment efficacy at the most fundamental level.
Due to the complicated reactions among light, sensitizer, and oxygen, numerical modeling can be a complementary method to the experimental dosimetry. A macroscopic model has been proposed to model the production of reacted singlet oxygen during PDT. However, to rigorously simulate the reacted 1O2 dose, several parameters need to be determined explicitly in vivo for the particular photosensitizer of interest. Some of these photophysical parameters can be compared to microscopic experiments in tumor spheroid environment [2, 3]. In this study, Photofrin was chosen as the sensitizer, since the corresponding photophysical parameters were determined comprehensively by Georgakpudi et al. [3] and Mitra et al. [2]. Other than the photophysical parameters, the physiological parameter such as oxygen perfusion rate also needs to be determined. In this study, we have examined the sensitivity of determining the physiological parameter from two clinical related conditions: (1) collimated light source on semi-infinite turbid medium and (2) linear light source in turbid medium.
A sudden drop of the calculated [1O2]rx along with the distance following the decrease of light fluence rate is observed [4, 5]. This suggests that a possible correlation between [1O2]rx and necrosis boundary may occur in the tumor subject to PDT irradiation. In this study, we propose animal studies to accurately determine the physiological parameter in the clinical relevant environments. The results of the computed [1O2]rx are expected to fit the treatment-induced necrosis data obtained from the in vivo animal model. To explicitly characterize the light distribution of the targeted tumor tissue, we also perform measurements in the two treatment conditions to extract the optical properties for the murine radiation-induced fibrosarcoma (RIF) tumor.
2. METHODS
2.1 Theory-PDT dosimetry model
Based on the PDT processes with 1O2-mediated bleaching mechanism, we can write down a complete set of coupled differential equations describing the photochemical reactions for each species,
| (1) |
| (2) |
| (3) |
| (4) |
| (5) |
| (6) |
where [S0], [S1] and [T] are the ground, first excited singlet and triplet sensitizer concentration, respectively, and [3O2] and [1O2] are the ground triplet and excited singlet state oxygen concentration, respectively, and P and [A] are the oxygen perfusion rate and the concentration of 1O2 acceptor excluding sensitizer molecular. δ is a low photosensitizer concentration correction term [6–8]. In most clinical environment, the sensitizer concentration is normally low. In such environment, the 1O2 molecular has large possibility to react with its parent sensitizer and induce sensitizer degradation. Therefore, the introduction of δ term improves the theoretical description of bleaching mechanism in low concentration environment. The definitions of the other photochemical parameters k1 to k7 are listed in Zhu et al. [4] and Table 1. The light propagation (fluence rate ϕ) in tumor tissue can be described by the diffusion equation as follows,
Table 1.
Parameter list for Photofrin and values at 630 nm
| Symbol | Definition [4] | ||
|---|---|---|---|
| k0 | Photon absorption rate of sensitizer per sensitizer concentration | ||
| k1 | Bimolecular rate for 1O2 reaction with ground-state photosensitizer | ||
| k2 | Bimolecular rate of triplet sensitizer quenching by 3O2 | ||
| k3 | Decay rate of first excited singlet state sensitizer to ground state sensitizer | ||
| k4 | Rate of monomolecular decay of the sensitizer triplet state | ||
| k5 | Rate of first excited triplet state sensitizer to ground state sensitizer | ||
| k6 | 1O2 to 3O2 decay rate | ||
| k7 | Bimolecular rate of reaction of 1O2 with biological substrate [A] | ||
| Symbol | Definition | Value | References |
| SΔ | Fraction of triplet-state sensitizer-3O2 reactions which produce 1O2 | 0.5 | [4] |
| δ | Low concentration correction term | 33 (μM) | [7] |
| ε | Extinction coefficient of sensitizer | 0.0035 (cm−1 μM−1) | [2] |
| α | k7[A]/k6 | 0.95 | [3]* |
| β | k4/k2 | 11.9 (μM) | [3] |
| γ | k5/(k3 + k5) | 0.8 | [2] |
| κ | k1/k6 | 7.2 × 10⁻⁵ (μM−1) | [3]* |
| η | ε/hν | 0.0019 (cm2 mW−1 s−1) | based on [2] |
| SΔγηα/(1+α)** | 0.0037 (cm2 mW−1 s−1) | [3]* | |
The calculation of the parameter values are based on tumor spheroid studies [3].
This value corresponds to the oxygen consumption rate per light fluence (in mW/cm2) per initial sensitizer concentration (in μM).
| (7) |
where S is the source term, D is the optical diffusion coefficient of the (tumor) tissue, which is equal to 1/(3μs′), and μa and μs′ are the absorption and reduced scattering coefficient of the (tumor) tissue, respectively. The optical properties used in this study are list in Table 2.
Table 2.
Optical properties extracted from surface irradiation (630 nm, RIF tumor)
| μeff | 1.9 (1/cm) |
| μs′ | 4.2 (1/cm) |
| μa | 0.27 (1/cm) |
Since the lifetime of the excited species [S1], [T], and [1O2] are much shorter than their ground state species [S0] and [3O2] (ns to μs vs. s to hrs). We can treat [S1], [T], and [1O2] as reaching instantaneous steady state relative to the ground state sensitizer and oxygen population. We are only interested in the variation in the time scale from second to hours. This assumption allows us to simplify Eqs. (2–3) and (5) by setting d[S1]/dt, d[T]/dt, and d[1O2]/dt equal to zero. The approximated kinetic equations can be written as follows,
| (8) |
| (9) |
| (10) |
| (11) |
| (12) |
It is worth-while to mention that the term k1[S0] + k7[A] was replaced by k7[A] since k1[S0]≪ k7[A]. The accumulated [1O2]rx killing cell targets can be estimated by calculating time integral of Eq. (6),
| (13) |
where f is a fraction of the reaction between 1O2 and [A], which effectively leads tumor cell death, and in this work, we set f as one. We can rewrite Eq. (13) with the use of Eq. (12),
| (14) |
Using the convention list in Table 1 and taking time derivative of Eq. (14), we can write down Eqs. (7–9) and (14) as follows,
| (15) |
| (16) |
| (17) |
| (18) |
where u1, u2, u3, and u4 represent ϕ, [S0], [3O2], and [1O2]rx, respectively. The photophysical parameters k1 to k7 can be replaced by α, β, γ, κ, and η, and the definition and value of these parameters for Photofrin are listed in Table 1. The appropriate boundary and initial conditions are list in Table 3. Because the concentration of sensitizer in an in vivo environment is usually low, we can ignore the term εu2 in Eq. (15), compared to the tissue absroption coefficient μa. The oxygen perfusion rate P is not necessarily a constant. Currently, we adopt the following form
Table 3.
Boundary and initial conditions for PDT dosimetry model
| Boundary conditions | Initial conditions | ||
|---|---|---|---|
| u1 | u1+2ADn̂·∇u1=0 | u1 | 0 |
| u2 | ∇u2 = 0 | u2 | 7 μM |
| u3 | ∇u3 = 0 | u3 | 83 μM [4] |
| u4 | ∇u4 = 0 | u4 | 0 |
| [A] | 830 μM [4] | ||
The value of the initial conditions of u2 (Sec. 2.2.2) and u3 [4] are extracted from in vivo experiment. A is a constant that can be calculated based on the index of the refractions of the tissue and air at the boundary, where A = [2/(1−R0) − 1 + |cosθc|3]/[1−|cosθc|2], and R0 = (n − 1)2/(n+1)2. n is the ratio of the refractive indices between the tissue and outside medium: n = ntiss/nout. θc = arcsin(1/n) is the critical angle [9]. For tissue-air and tissue-tissue boundary, A is 2.9 and 1, respectively (ntiss ~ 1.4).
| (19) |
where [3O2]0 is the initial oxygen concentration before PDT treatment, and g is the maximum oxygen perfusion rate when there is no oxygen gradient. Eq. (19) limits the oxygen level to not exceed the initial value. The Eqs. (15–18) is a set of universal PDT kinetic equations incorporating light transport which can be used for any treatment geometry.
The macroscopic model shown above was solved numerically by using finite element method. COMSOL 3.4 (Burlington, MA, United States) was chosen as the software package.
2.2 Experimental method
2.2.1 Quantification of optical properties of RIF
To quantify the light fluence rate distribution, it is important to obtain correct optical properties of the targeted tumor tissue. In this study, we performed interstitial as well as surface irradiation to exam the light fluence rate distributions in RIF tumor.
2.2.1.1 Determination of optical properties under surface irradiation
For surface irradiation, experiment setup is shown in Fig. 1. Two catheters are used for each mouse. One is inserted in an angle through the tumor and another one is placed on the surface of the tumor. The isotropic detector 1 and 2 are inserted into the catheters, respectively. The surface irradiation is performed using a fiber coupled into 630 nm water cool dye laser (Fig. 1 (B)). The fluence rates we used for this study are 38 and 75 mW/cm2. Photofrin were injected to six mice intravenously at a dose of 5 mg per kg body weight 24 h before experiment. Since detector 1 is inserted in an angle θ, between the axial axis to the tumor surface and the detector axis, (Fig 1 (A)), cosθ is used to correct the tumor depth-dependent fluence rate distribution.
Fig. 1.
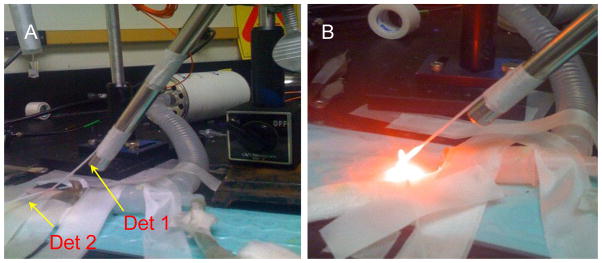
(A) Experiment setup. Detector 1 and 2 are used to measure the depth-dependence and surface fluence rate, respectively. (B) Experiment setup with surface irradiation on.
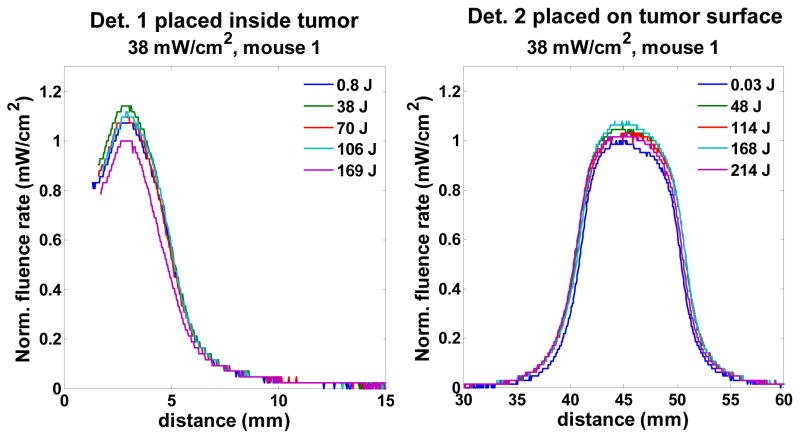
Fig. 2 shows the represent scan profiles of isotropic detectors 1 and 2 at different fluences. For each scan, there is one maximum fluence rate. The profiles shown in Fig. 2 were normalized to the minimum value of the group of the maximum fluence rates among all the scans. From the results of Fig. 2, we notice there is no treatment (fluence)-dependence on these profiles and the uncertainty of the fluence rate is 11 and 7 % for detector 1 and 2 cases. This uncertainty is most likely from experimental measurement or artificial error rather than the treatment-induced fluence rate change. In conclusion, the optical properties of RIF tumor are not affected by the PDT treatment.
Fig. 2.
The profile scan for detector 1 and 2 for mouse 1 for 38 mW/cm2 treatment. The profiles were normalized to the minimum value of the group of the maximum fluence rates among all the scans.
(i) Calculation of μeff
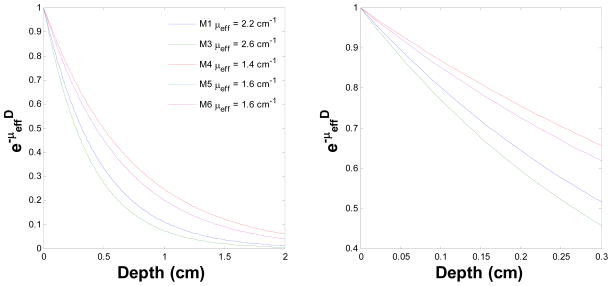
According to the diffusion theory, subject to a surface irradiation, the fluence rate ϕ within biological tissue follows the form of ϕ(d)/ϕ(d = 0) = exp(−μeffd), where d is depth. Therefore, we can use this exponential form to extract the μeff by fitting the detector 1 profiles of light fluence rate vs. depth. From the detector 1 cases, the fluence rate starts to increase up to the maximum value while the detector approaching to the tumor surface and then gradually decreases when the detector pulled out from the tumor surface (Fig. 2). We therefore, fit this increasing part by using the exp(−μeffd) form. The fitting uses simplex search method built in MATLAB (Natick, MA, United States). Fig. 3 shows the behavior of exp(−μeffd) vs. depth corresponding to each mouse. The right figure is within 0.3 cm depth range, which is the standard RIF tumor-depth. The average value of exp(−μeffd) at 0.3 cm for this set of mouse is 0.58 +/− 0.08, and the average μeff in this study is 1.9 +/− 0.5 (1/cm).
Fig. 3.
exp(-μeffd) vs. depth for five mouse. The figure legends represent the extracted μeff for each mouse (M1 to M6). The right figure represents the same scenario as left figure but within 0.3 cm depth range.
(ii) Calculation of μs′
From the reference [10], the μs′ can be obtained by surface measurement if μeff is known. The ratio of the fluence rate on the tissue surface and the incident or in air measured fluence rate follows
| (20) |
where Rd is the total diffuse reflectance, and follows
| (21) |
where a′ = μs′/(μs′ + μa) is transport albedo. A is the internal reflection parameter, and for air-tissue interface, 3.25 is a good approximation. For a Lambertian surface and a uniform incident light, Rd is equal 1. Therefore, ϕsurface/ϕair is equal to 3. However, in reality, an isotropic detector does not respond to light isotropically, and the difference is quantified by a detector calibration factor β. Therefore,
| (22) |
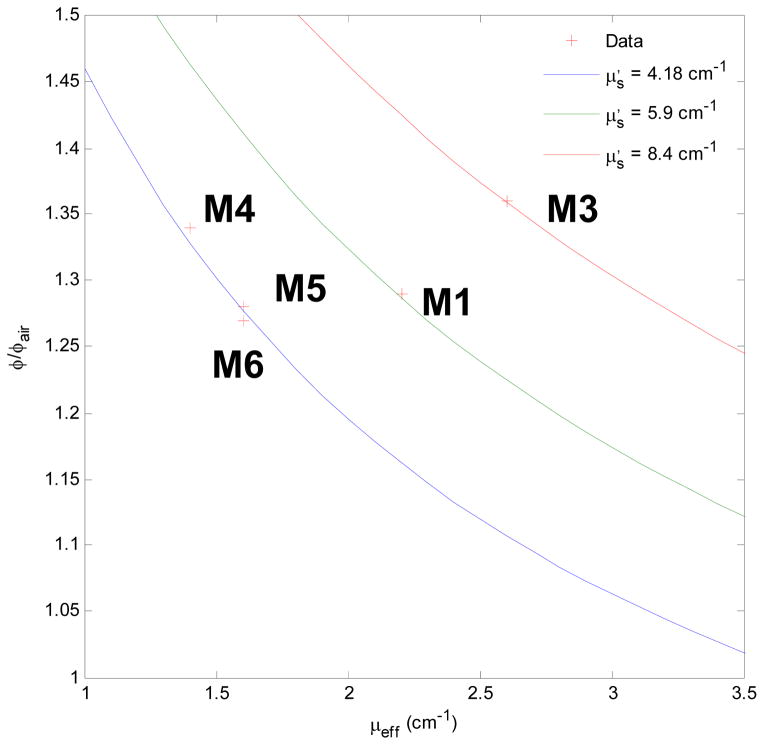
where β is 0.72 for the 0.5 mm isotropic Cardio detectors used in this study. With the above equations, the relation between μeff and μa and μs′, , and experiment measurement on the surface and in air, we can obtain the result of Fig. 4 for μs′. We observed the μs′ for mouse 4 – 6 are more consistent than mouse 1 and 3, and the μs′ for mouse 4 – 6 is 4.2 (1/cm).
Fig. 4.
The ratio of the measured fluence rate at the tumor surface to incident fluence rate as a function of μeff and μs′.
2.2.1.2 Determination of optical properties under interstitial condition
Except using the surface irradiation geometry to extract optical properties of tumor tissue, we also considered interstitial source irradiation geometry. A point source and an isotopic detector were inserted into the tumor interstitially using the same interstitial catheters for PDT treatment at 3 mm seperation. The point source was positioned using a motorized translational stage at five locations penetrating through the tumor, each position is 2 mm apart from others. For each source position, the isotropic detector measured the spatially-resolved fluence rate by scanning along the source axis. This point source geometry allows us obtain the spatially-dependent optical properties [11]. One mouse had been used to this study and the μeff, μa and μs′ are 4.42 +/− 0.11, 0.72 +/− 0.02 and 9.05 +/− 0.26 (1/cm), respectively, by fitting the light fluence rate distribution profiles.
2.2.2 Determination of sensitizer concentration in vivo
Twenty four hours after i.v. injection (5 mg per kg body weight Photofrin), the sections of RIF tumor were removed from mice and dissected into 10 mg per piece. Each tissue piece was placed in a polypropylene vial with 0.15 ml Solvable. The vials were placed into 50 degree water bath over night. The emission Photofrin spectrum from the dissolved tissue was measured by spectrofluorometer and compared to the spectrum of known concentration. The extracted Photofrin concentration used in the following simulation is 7 μM.
2.2.3 in vivo experiment to quantify necrosis distance
In parallel characterizing light distribution of RIF tumor, we also performed a series of animal experiment to build the relation between the computed 1O2 reacted dose and experimentally measured necrosis distance in vivo. Eight mice were subjected to surface Photofrin-PDT irradiation using 630 nm laser line. 5 and 100 mW/cm2 with 50 and 100 J/cm2 treatment scenarios were chosen for surface irradiation. Immediately after PDT treatment, the tumors with skin were moved and sent to H&E staining to characterize necrosis depth induced by 1O2. However, for surface irradiation, we observed a separation between skin surface and tumor tissue, and no obvious necrosis death of cells.
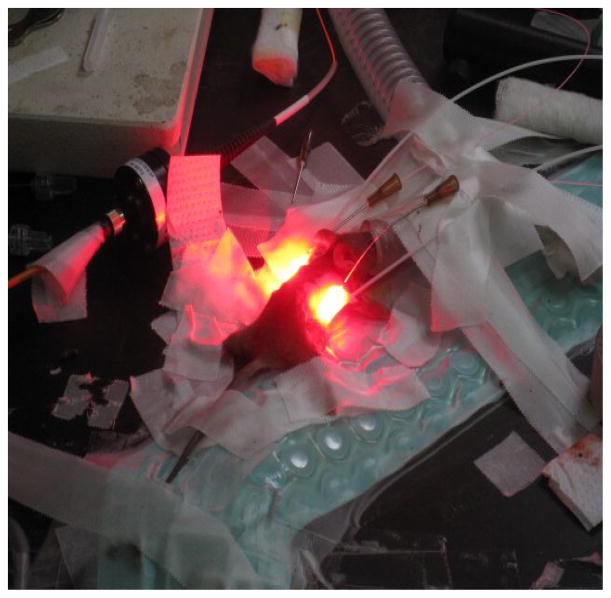
To improve our methodology, we interstitially irradiate tumors using linear source with 75 mW/cm 100 J/cm and 150 mW/cm 50 to 300 J/cm, separately. Seven mice were used in this study. Fig. 5 shows the experiment setup; the linear source and isotropic detector were inserted into the mouse tumor, and there were two tumor growing on each mouse shoulder. The detector was placed outside the tumor region but close to the tumor, and the fluence rate was monitored by the detector during treatment. The advantages of treating mouse with interstitial linear source are the setup similar to our clinical prostate treatment protocol, avoiding the separation of skin and tumor tissue observed in the surface irradiation.
Fig. 5.
Interstitial-PDT experiment setup. Linear source and isotropic detector were inserted into mouse shoulder tumor.
3. RESULTS AND DISCUSSION
We perform a series of theoretical result to exam the sensitivity of the oxygen perfusion rate coefficient g (Eq. 19) for CW treatments using a planar source and linear source, subject to a clinical relevant physiological environment (Table 2). All the simulations were performed for Photofrin-PDT at 630 nm.
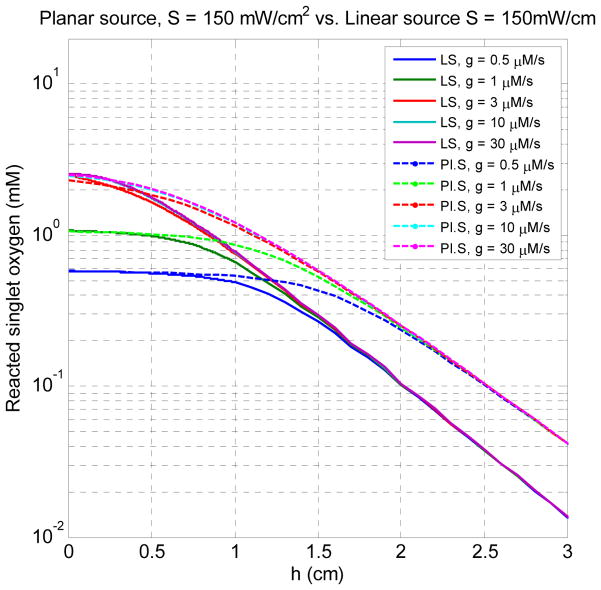
Fig. 6 shows the spatial distributions of [1O2]rx for five different values of g for surface and interstitial treatment. The source strengths for planar treatment and linear source are 150 mW/cm2 and 150 mW/cm, respectively. h = 0 is the air-tissue interface for the surface treatment and the source location for the interstitial treatment. From the result of Fig. 6, we observe a flat region formed within the region close to h = 0, for the low perfusion rate cases g = 0.5 and 1 μM/s. From this result, it also demonstrates that the [1O2]rx profile is strongly sensitive to low oxygen supply rate and, once g is larger than 10 μM/s, the effect of g on the [1O2]rx profile is negligible.
Fig. 6.
The spatial distributions of [1O2]rx for five different values of g for surface (planar source) and interstitial treatment (linear source). The source strengths for planar treatment and linear source are 150 mW/cm2 and 150 mW/cm, respectively. h = 0 is the air-tissue interface for the surface treatment and the source location for the interstitial treatment.
Moreover, the flat regions observed in the Fig. 6 may be related to the necrosis regime induced by 1O2. The plateau region is more extensive for surface treatment case than the interstitial treatment case (Fig. 6). The reason is given in Fig. 7. Fig. 7 (A) shows the spatial distributions of [1O2]rx for the case of g = 0.5 (μM/s) and light fluence rate for surface and interstitial treatments. We observe the fluence rate induced by surface treatment is higher than interstitial treatment after h = 0.25 cm. Fig. 7 (B) shows the oxygen and reacted singlet oxygen concentration for the same scenario. For the planar source case, more oxygen is depleted by the surface irradiation than the linear source case after h = 0.25 cm. Therefore, the higher fluence rate and stronger oxygen depletion induced by the surface irradiation deposited larger dose deposition than the interstitial treatments within the large distance relative to the source location.
Fig. 7.
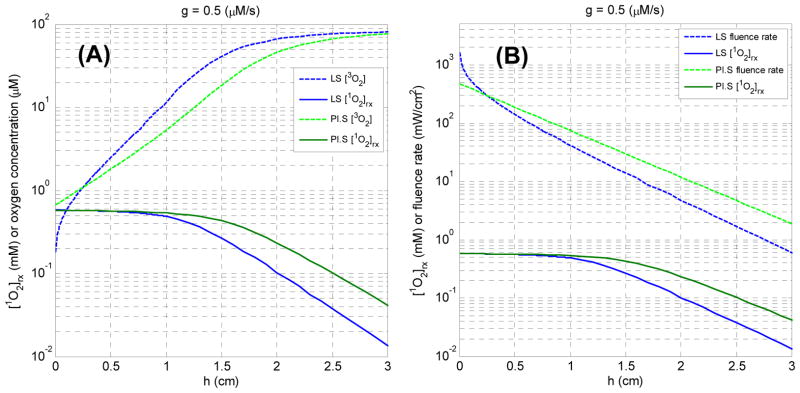
(A) The spatial distributions of [1O2]rx for the case of g = 0.5 (μM/s) and light fluence rate for surface and interstitial treatments. (B) The spatial distributions of [1O2]rx for the case of g = 0.5 (μM/s) and oxygen concentration for surface and interstitial treatments.
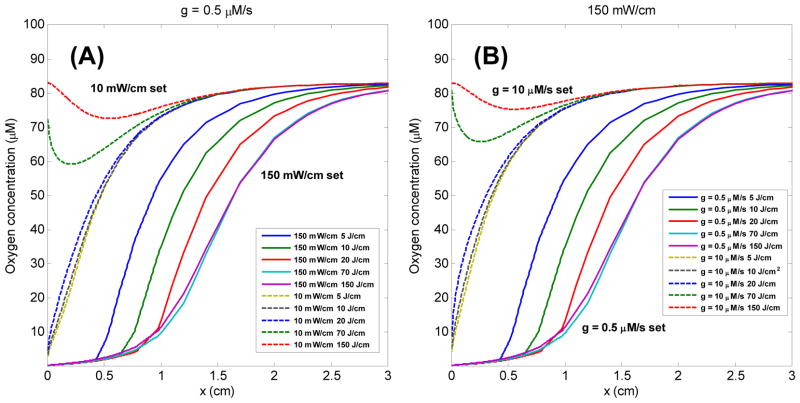
Fig. 8 (A) shows the oxygen concentration [3O2] vs. the distance for the cases of linear source strength 10 and 150 mW/cm for different fluences for g = 0.5 μM/s. Stronger oxygen depletion is observed in the case of 150 mW/cm, and the oxygen recovery is also shown in the case of 10 mW/cm. Fig. 8 (B) shows the oxygen concentration [3O2] vs. the distance for the cases of g = 0.5 and for a linear source strength 150 mW/cm. It is no surprise that a significant oxygen recovery is shown in high oxygen perfusion rate case. However, there is almost no difference between the case of 10 mW/cm, g = 0.5 μM/s (Fig. 8 (A)) and 150 mW/cm, g = 10 μM/s (Fig. 8 (B)). It implies that high fluence rate case does not induce sufficient oxygen depletion after a certain treatment time, and the treatment efficacy is about the same as low fluence rate case, which is not consistent with experimental results [12, 13]. Therefore, from the results of Fig. 8, using low oxygen perfusion rate as a model parameter may be more reasonable than high oxygen perfusion rate.
Fig. 8.
(A) Oxygen concentration [3O2] (μM) for 150 and 10 mW/cm vs. distance (cm) (relative to the linear source) for different fluence (J/cm) for g = 0.5 μM/s. (B) Oxygen concentration [3O2] (μM) for g = 0.5 and 10 μM/s vs. distance (cm) (relative to the linear source) for different fluence (J/cm) for 150 mW/cm.
Fig. 9 shows [1O2]rx (mM) for 150 (A) and 10 (B) mW/cm vs. distance (cm) relative to the linear source for fluences between 5 – 150 (J/cm) using g = 0.5 μM/s. The difference of the [1O2]rx profile is clearly shown in the region close to the source for 150 mW/cm vs. 10 mW/cm. The plateau of the [1O2]rx observed in high fluence rate case is due to the limitation of oxygen supply (Fig. 8 (A)). The extent of the plateau indicates the depth of necrosis induced by PDT treatment. The model predicts that the necrosis depth increases up to 1 cm after 20 J/cm treatment, assuming the singlet oxygen threshold is 0.1 mM. However, there is no flat region of [1O2]rx profile is not shown in the case of 10 mW/cm.
Fig. 9.
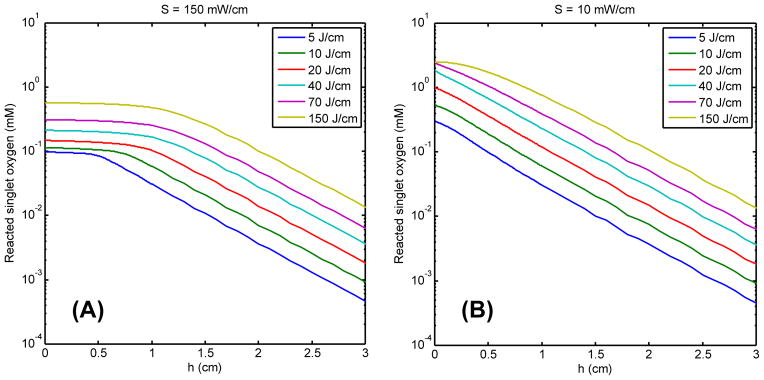
The reacted singlet oxygen [1O2]rx (mM) for 150 (A) and 10 (B) mW/cm vs. distance (cm) relative to the linear source for six fluence (J/cm) for g = 0.5 μM/s.
Fig. 10 (A) and (B) show H&E staining of a RIF tumor treated with Photofrin-PDT at 150 mW/cm, 150 and 300 J/cm (interstitial fiber placement), respectively. The central-located holes in the section are the insertion location of the light sources. Surprisingly, there is no necrosis region developed in these treatment cases. Sixteen mice had been used for the interstitial or surface treatment. However, none of them shows significant necrosis region. Fig. 11 shows H&E staining of a RIF tumor treated with Photofrin-PDT at 75 mW/cm, 100 J/cm. The black circles shown in Fig. 11 (A) identify regions of necrosis. Fig. 11 (B) is an amplified 10 X image of the left circled area in Fig. 11 (A). Although pockets of necrosis were found in this case, a measurable necrosis depth was still not detected for this treatment condition. The results of Fig. 10 and 11 could be a consequence of the study design, which stipulated that tumors be removed immediately after PDT treatment and as a result limited time was available for necrotic development.
Fig. 10.
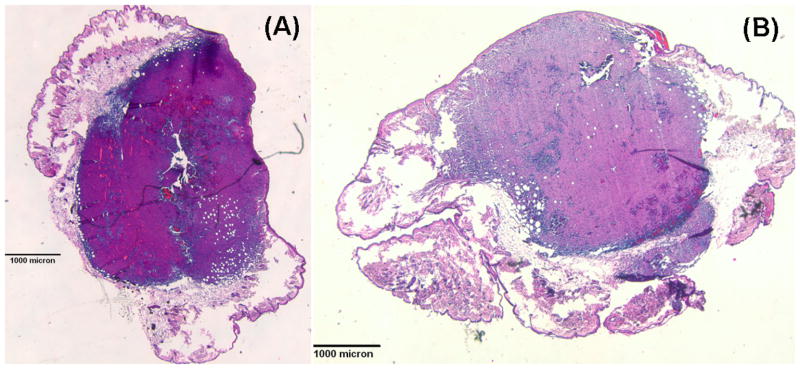
(A) H&E-stained section of a PDT-treated (150 mW/cm and 150 J/cm) RIF tumor (1.25 X) (B) H&E-stained section of a PDT-treated (150 mW/cm and 300 J/cm) RIF tumor (1.25 X)
Fig. 11.
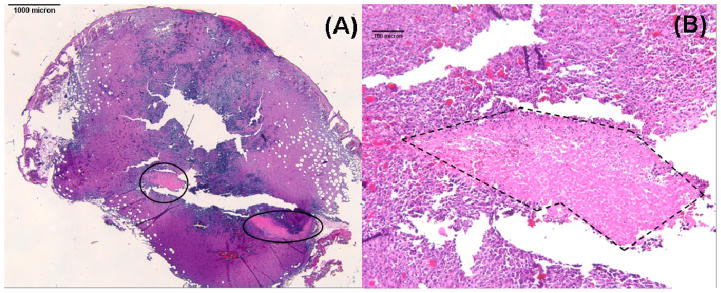
(A) H&E-stained section of a PDT-treated RIF tumor (1.25 X). Necrotic regions are circled. (B) Magnified (10 X) view of the left necrotic region in panel A. Necrosis is outlined with dashed lines.
4. CONCLUSION
To apply the macroscopic model as a clinical dosimetry, it is necessary to determine the photophysical and physiological parameters correctly. The photophysical parameter of Photofrin had been determined by the tumor spheroid experiment [2, 3]. In this work, we exam the sensitivity of the oxygen perfusion rate coefficient g from (1) collimated light source on semi-infinite turbid medium and (2) linear light source in turbid medium. Our results indicate the low oxygen perfusion rate is more appropriate to be adopted as modeling parameter.
It is urgent to correlate the computed [1O2]rx with the experimentally-measured necrosis distance. Currently, we have not observed significant necrosis induced by PDT treatment. The possible reason is that the tumor slide was taken immediately after PDT, which does not allow tumor tissue to develop necrosis in a reasonable time frame. An improved experiment is ongoing in our group.
Acknowledgments
The authors would like to thank the help of mice experiments from Elizabeth Erickter. We thank Michael Feldman for help with reading the H&E staining results. This work is supported by grants from National Institute of Health (NIH) R01 CA 109456 and P01 CA87971.
References
- 1.Brown SB, Brown EA, Walker I. The present and future role of photodynamic therapy in cancer treatment. Lancet Oncol. 2004;5(8):497–508. doi: 10.1016/S1470-2045(04)01529-3. [DOI] [PubMed] [Google Scholar]
- 2.Mitra S, Foster TH. Photophysical parameters, photosensitizer retention and tissue optical properties completely account for the higher photodynamic efficacy of meso-tetra-hydroxyphenyl-chlorin vs Photofrin. Photochem Photobiol. 2005;81(4):849–59. doi: 10.1562/2005-02-22-RA-447. [DOI] [PubMed] [Google Scholar]
- 3.Georgakoudi I, Nichols MG, Foster TH. The mechanism of Photofrin photobleaching and its consequences for photodynamic dosimetry. Photochem Photobiol. 1997;65(1):135–44. doi: 10.1111/j.1751-1097.1997.tb01889.x. [DOI] [PubMed] [Google Scholar]
- 4.Zhu TC, Finlay JC, Zhou X, Li J. Macroscopic modeling of the singlet oxygen prodution during PDT. Proc SPIE. 2007;6427:642708 1–12. doi: 10.1117/12.701387. [DOI] [PMC free article] [PubMed] [Google Scholar]
- 5.Zhu TC, Zhou X. Finite-element modeling of singlet oxygen during photodynamic therapy. Proc COMSOL Multiphysics. 2007:189–195. [Google Scholar]
- 6.Wang KK, Mitra S, Foster TH. A comprehensive mathematical model of microscopic dose deposition in photodynamic therapy. Med Phys. 2007;34(1):282–93. doi: 10.1118/1.2401041. [DOI] [PubMed] [Google Scholar]
- 7.Dysart JS, Singh G, Patterson MS. Calculation of singlet oxygen dose from photosensitizer fluorescence and photobleaching during mTHPC photodynamic therapy of MLL cells. Photochem Photobiol. 2005;81(1):196–205. doi: 10.1562/2004-07-23-RA-244. [DOI] [PubMed] [Google Scholar]
- 8.Finlay JC. Ph D Thesis. University of Rochester; Rochester: 2003. Reflectance and fluorescence spectroscopies in photodynamic therapy. [Google Scholar]
- 9.Li J, Zhu TC, Finlay JC. Study of light fluence rate distribution in photodynamic therapy using finite-element method. Proc SPIE. 2006;6139:613901–8. doi: 10.1117/12.646251. [DOI] [PMC free article] [PubMed] [Google Scholar]
- 10.Dimofte A, Zhu TC, Hahn SM, Lustig RA. In vivo light dosimetry for motexafin lutetium-mediated PDT of recurrent breast cancer. Lasers Surg Med. 2002;31(5):305–12. doi: 10.1002/lsm.10115. [DOI] [PubMed] [Google Scholar]
- 11.Dimofte A, Finlay JC, Zhu TC. A method for determination of the absorption and scattering properties interstitially in turbid media. Phys Med Biol. 2005;50(10):2291–311. doi: 10.1088/0031-9155/50/10/008. [DOI] [PMC free article] [PubMed] [Google Scholar]
- 12.Foster TH, Murant RS, Bryant RG, Knox RS, Gibson SL, Hilf R. Oxygen consumption and diffusion effects in photodynamic therapy. Radiat Res. 1991;126(3):296–303. doi: 10.2307/3577919. [DOI] [PubMed] [Google Scholar]
- 13.Sitnik TM, Henderson BW. The effect of fluence rate on tumor and normal tissue responses to photodynamic therapy. Photochem Photobiol. 1998;67(4):462–6. [PubMed] [Google Scholar]


